


British Pound holds near 1.3500 as CPI relief meets Hormuz risk
- GBP/USD holds firm as US CPI matches market expectations.
- Fed hold bets rise, but December hike risks remain.
- UK GDP data could reshape BoE rate-hike expectations.
The Pound Sterling holds firm within familiar levels after the US inflation report was aligned with estimates, a relief for the Federal Reserve, which is laser-focussed on tackling higher prices. The GBP/USD trades at around 1.3500 after reaching a high of 1.3546.
GBP/USD steadies after inline US inflation data; traders await UK GDP
US inflation on the consumer front in July was in line with estimates, showing a deceleration from 3.6% to 3-5% on a yearly basis. Core inflation dipped as well to 2.5% YoY from 2.6%.
The data triggered a reaction in the bond markets. Now investors expect the Fed to hold rates unchanged at the September meeting, with odds at 60%, while the odds of a 25-basis-point rise stand at nearly 40%, according to Prime Terminal data.
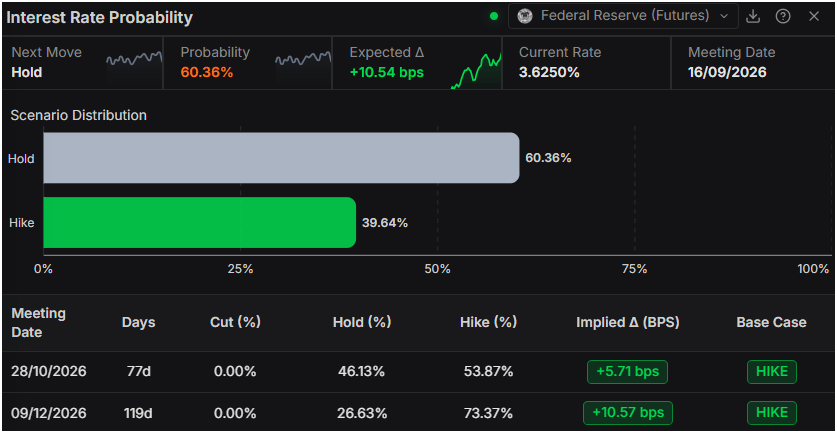
For the December meeting, the chances for a Fed rate hike are 73%, though there are three inflation reports left, ahead of the December 9 meeting.
Although the report is positive, geopolitics continued to play its role. Negotiations between the US and Iran are showing signs of stalling, with Iran adopting a robust military posture in the Strait of Hormuz, read a Bloomberg headline. Also, CNN reported that US embassies in the Middle East are preparing for extended periods with reduced staff, due to the Iran war.
In the UK, the schedule was absent, yet on Thursday, traders would scrutinize Gross Domestic Product (GDP) figures. On an annual basis, the figures are expected to improvefrom 0.9% to 1.1%, and on a quarterly basis, the British economy is expected to deteriorate from 0.6% to 0.4%:
If the GDP print comes in worse than expected, investors could price out rate increases by the Bank of England (BoE).
GBP/USD Price Forecast: Technical outlook
In the daily chart, GBP/USD trades at 1.3497. The pair holds a bullish near-term bias as it remains above the clustered support formed by the 50-, 100- and 200-day simple moving averages (SMA) around 1.3369 and the reclaimed descending trendline break at 1.3427, while the more recent rising trend line off 1.3140 also underpins price at 1.3340. The Relative Strength Index (RSI) at 59.4 stays in positive territory, hinting at constructive momentum but still short of overbought conditions, which reinforces the notion of dips being supported rather than signaling exhaustion.
On the topside, immediate resistance is seen at the descending resistance trend line break near 1.3511, followed by the higher rising trendline break level at 1.3573, where bullish attempts could start to face stronger supply. On the downside, initial support is located at the former resistance trend line now acting as a floor around 1.3427, ahead of the multi-period SMA cluster near 1.3369 and the lower rising trendline support at 1.3340, levels that would need to give way to undermine the current constructive tone.
(The technical analysis of this story was written with the help of an AI tool. Know more.)
Pound Sterling Price Today
The table below shows the percentage change of British Pound (GBP) against listed major currencies today. British Pound was the strongest against the New Zealand Dollar.
| USD | EUR | GBP | JPY | CAD | AUD | NZD | CHF | |
|---|---|---|---|---|---|---|---|---|
| USD | 0.13% | 0.08% | 0.08% | 0.12% | 0.00% | 0.41% | 0.26% | |
| EUR | -0.13% | -0.04% | -0.07% | -0.01% | -0.16% | 0.32% | 0.12% | |
| GBP | -0.08% | 0.04% | -0.02% | 0.03% | -0.12% | 0.33% | 0.17% | |
| JPY | -0.08% | 0.07% | 0.02% | 0.05% | -0.08% | 0.33% | 0.19% | |
| CAD | -0.12% | 0.00% | -0.03% | -0.05% | -0.13% | 0.30% | 0.13% | |
| AUD | -0.01% | 0.16% | 0.12% | 0.08% | 0.13% | 0.43% | 0.31% | |
| NZD | -0.41% | -0.32% | -0.33% | -0.33% | -0.30% | -0.43% | -0.14% | |
| CHF | -0.26% | -0.12% | -0.17% | -0.19% | -0.13% | -0.31% | 0.14% |
The heat map shows percentage changes of major currencies against each other. The base currency is picked from the left column, while the quote currency is picked from the top row. For example, if you pick the British Pound from the left column and move along the horizontal line to the US Dollar, the percentage change displayed in the box will represent GBP (base)/USD (quote).
추천 기사


