

Euro holds losses at six-week lows amid high Oil prices, geopolitical uncertainty
- EUR/USD holds losses at six-week lows around 1.1600 on Wednesday.
- Fading hopes of a negotiated end to Iran's war and high Oil prices are weighing on the Euro.
- Eurozone HICP data is expected to confirm the inflationary pressures stemming from Iran's war.
The Euro (EUR) consolidates losses against the US Dollar (USD) on Wednesday, trading at six-week lows around 1.1600 at the time of writing, after retreating from the 1.1660 area on Tuesday. Oil prices remain above $100 as the US and Iran ramp up threats, boosting the safe-haven USD and keeping the common currency on the defensive.
US President Donald Trump said on Tuesday that the US might attack Iran in two ot three days if Tehran does not sign a peace deal, and Vice President JD Vance affirmed that the US remains “locked and loaded” to restart the military action. Iran’s Foreign Minister, Abbas Araghchi, warned of “many more surprises” if the US renews its hostilities against the Islamic Republic.
Meanwhile, the blockade of the Strait of Hormuz approaches its third month, strangling the global supply of Oil, Gas, and other key commodities, and boosting Crude prices. Brent is trading near $108.00 per barrel on Wednesday, levels that put the Eurozone’s Oil-importing economies against the wall and are hammering the Euro.
In the economic docket, German Producer Prices Index (PPI) confirmed the inflationary pressures stemming from Iran’s war, with the yearly PPI accelerating to 1.7% in April from -0.2% in March. Later on the day, the Eurozone Harmonised Index of Consumer Prices (HICP) is expected to confirm that price pressures accelerated to 3% year-over-year in April from 2.6% in March
In the US, the focus will be on the minutes of April’s Federal Reserve meeting, which are expected to show some hawkish tweak. The bank left interest rates on hold amid a widely split committee, with one member voting for a rate cut and three calling for removing the “easing bias” line from the bank’s statement.
Technical Analysis: Bears remain in control
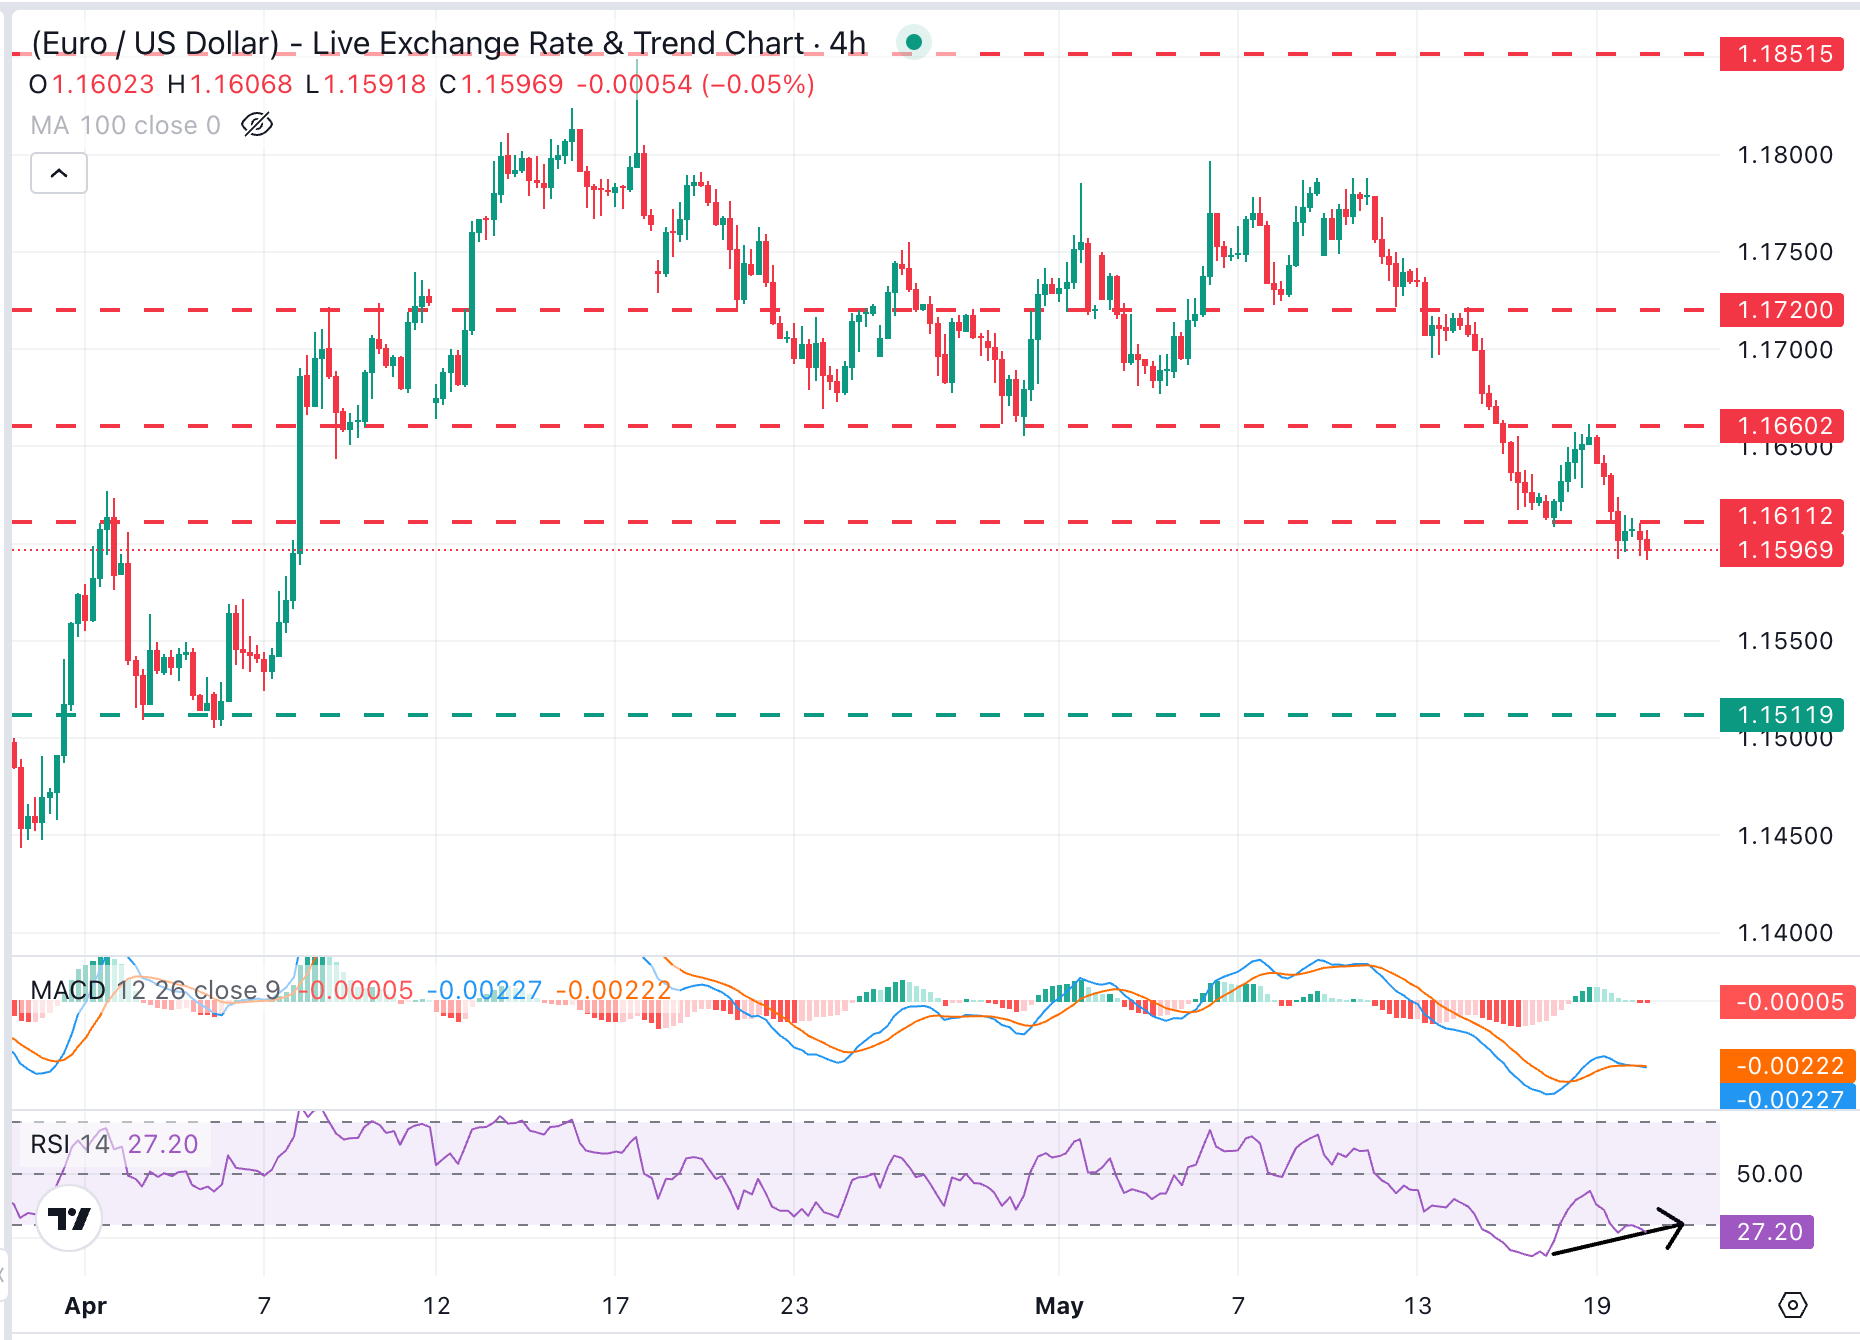
EUR/USD shows a bearish near-term bias after losing about 1.6% in a bit more than a week, with no sign of an upcoming recovery other than a bullish divergence in the 4-hour Relative Strength Index (RSI), which trades near 27, up from heavily oversold levels earlier this week. The Moving Average Convergence Divergence (MACD) histogram hovers around the zero line, suggesting a lack of strong corrective forces for now.
Upside attempts are being limited below Monday's low at the 1.1610 area, which is closing the path towards a support-turned-resistance, roughly between 1.1650 and 1.1670. On the downside, session lows are at 1.1590, but there is no clear support area in sight until April's bottom in the 1.1510-1.1525 area.
(The technical analysis of this story was written with the help of an AI tool.)
Economic Indicator
Producer Price Index (MoM)
The Producer Price Index released by the Statistisches Bundesamt Deutschland measures the average changes in prices in the German primary markets. Changes in the PPI are widely followed as an indicator of commodity inflation. Generally speaking, a high reading is seen as positive (or bullish) for the EUR, whereas a low reading is seen as negative (or bearish).
Read more.Last release: Wed May 20, 2026 06:00
Frequency: Monthly
Actual: 1.2%
Consensus: 1%
Previous: 2.5%
Source: Federal Statistics Office of Germany
Economic Indicator
Producer Price Index (YoY)
The Producer Price Index released by the Statistisches Bundesamt Deutschland measures the average changes in prices in the German primary markets. Changes in the PPI are widely followed as an indicator of commodity inflation. Generally speaking, a high reading is seen as positive (or bullish) for the EUR, whereas a low reading is seen as negative (or bearish).
Read more.Last release: Wed May 20, 2026 06:00
Frequency: Monthly
Actual: 1.7%
Consensus: 1.5%
Previous: -0.2%
Source: Federal Statistics Office of Germany
추천 기사


