


USD/JPY slides as Iran reopens Hormuz, WTI plunges and USD weakens
- USD/JPY edges lower as softer USD and falling Oil prices support the Yen.
- WTI plunges over 10% after Hormuz reopening, easing inflation concerns.
- Technically, USD/JPY trades below the 20-day SMA, keeping the near-term bias bearish.
USD/JPY edges lower on Friday as the Japanese Yen (JPY) strengthens against a softer US Dollar (USD), with easing Oil prices providing additional support, given Japan’s heavy reliance on imported energy. At the time of writing, the pair is trading around 158.18, down 0.61% on the day.
Despite the decline, the pair remains largely range-bound within a one-month range between 157.50 and 160.50 and is on track for a third consecutive weekly decline, mirroring moves in the US Dollar Index (DXY), which tracks the Greenback against a basket of six major currencies. The index remains under pressure amid improving market sentiment surrounding a potential US-Iran peace deal.
Crude prices plunged more than 10% after Iran reopened the Strait of Hormuz. Iranian Foreign Minister Abbas Araghchi said in a statement on X that, in line with the ceasefire in Lebanon, passage for all commercial vessels through the Strait has been declared open for the remaining period of the truce, with transit taking place along coordinated routes set by Iran’s Ports and Maritime Organisation.
The sharp drop in Oil prices is easing immediate inflation risks, reviving expectations for Federal Reserve (Fed) rate cuts, while reinforcing the Bank of Japan’s (BoJ) gradual policy normalization path.
Looking ahead, traders will closely monitor developments around US–Iran talks over the weekend, with markets watching for signs of a lasting peace deal. However, unresolved differences, particularly over nuclear issues, could keep uncertainty elevated.
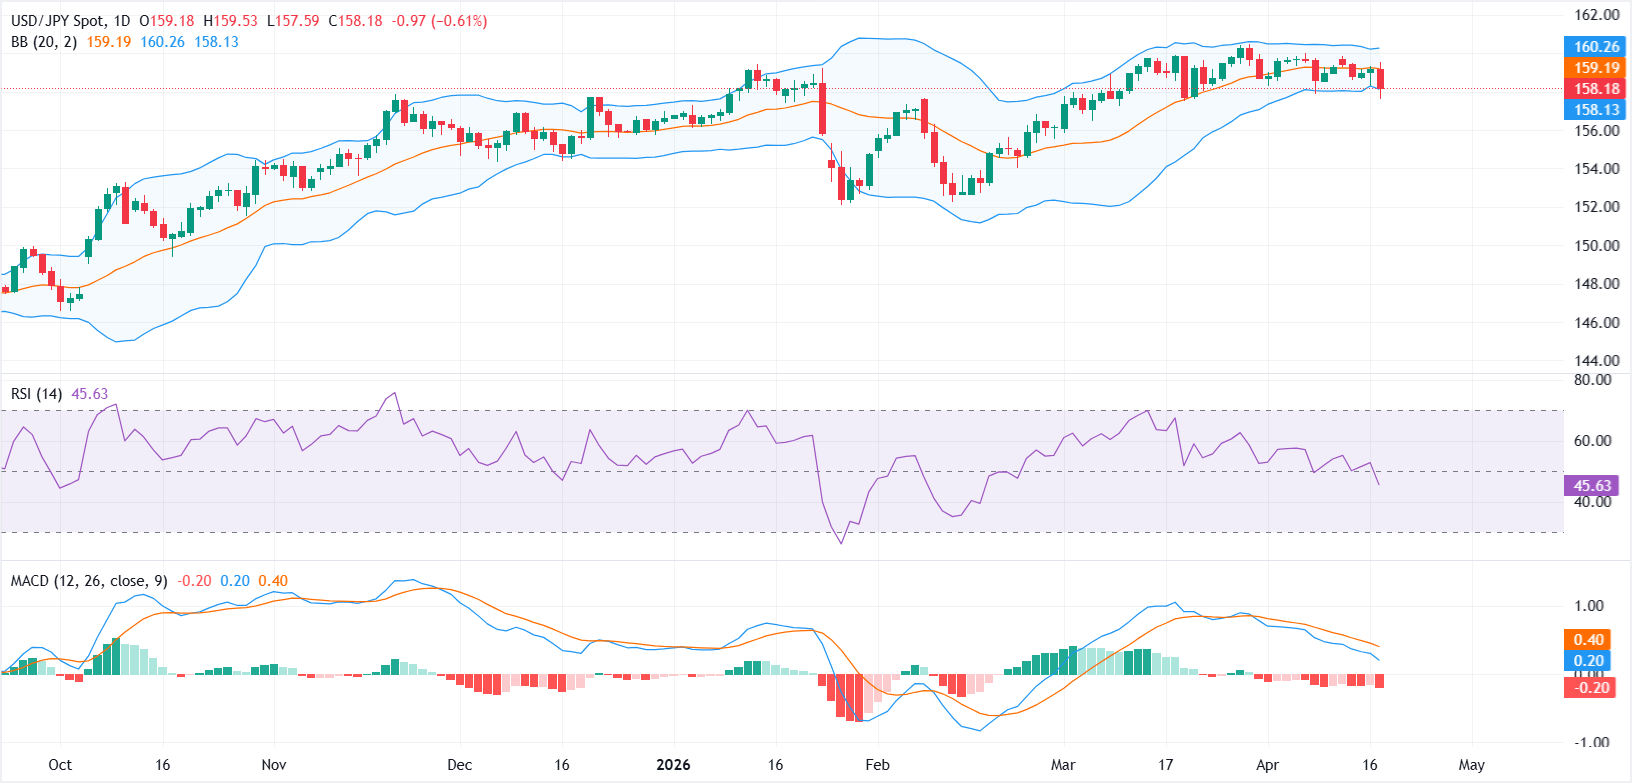
In the daily chart, USD/JPY holds a bearish near-term bias as spot sits below the 20-day simple moving average (SMA) component of the Bollinger Bands at 159.20 while only marginally above the lower band support at 158.15. This configuration suggests the recent pullback is not yet resolved, with the pair trading in the lower half of its volatility envelope; a sub-50 Relative Strength Index (RSI) at 46 and a negative Moving Average Convergence Divergence (MACD) reading around -0.19 both hint that downside momentum still outweighs buying interest.
On the topside, initial resistance is located at the Bollinger SMA midline near 159.20, with a stronger cap emerging at the upper band around 160.25, where renewed selling pressure could reappear if the pair attempts a rebound. On the downside, immediate support is seen at the lower Bollinger Band near 158.15; a daily close below this level would expose deeper losses toward prior price floors, whereas holding above it would keep the pair confined to a corrective consolidation within the broader uptrend.
(The technical analysis of this story was written with the help of an AI tool.)
Japanese Yen Price Today
The table below shows the percentage change of Japanese Yen (JPY) against listed major currencies today. Japanese Yen was the strongest against the US Dollar.
| USD | EUR | GBP | JPY | CAD | AUD | NZD | CHF | |
|---|---|---|---|---|---|---|---|---|
| USD | -0.12% | -0.19% | -0.62% | -0.20% | -0.28% | -0.16% | -0.51% | |
| EUR | 0.12% | -0.07% | -0.52% | -0.09% | -0.17% | -0.05% | -0.41% | |
| GBP | 0.19% | 0.07% | -0.45% | -0.02% | -0.10% | 0.02% | -0.33% | |
| JPY | 0.62% | 0.52% | 0.45% | 0.44% | 0.35% | 0.46% | 0.12% | |
| CAD | 0.20% | 0.09% | 0.02% | -0.44% | -0.08% | 0.02% | -0.31% | |
| AUD | 0.28% | 0.17% | 0.10% | -0.35% | 0.08% | 0.12% | -0.23% | |
| NZD | 0.16% | 0.05% | -0.02% | -0.46% | -0.02% | -0.12% | -0.35% | |
| CHF | 0.51% | 0.41% | 0.33% | -0.12% | 0.31% | 0.23% | 0.35% |
The heat map shows percentage changes of major currencies against each other. The base currency is picked from the left column, while the quote currency is picked from the top row. For example, if you pick the Japanese Yen from the left column and move along the horizontal line to the US Dollar, the percentage change displayed in the box will represent JPY (base)/USD (quote).
추천 기사


