AMD Q3 Earnings Preview: Can Data Center Revenues Continue to Set Records?

coverImg
Source: DepositPhotos

Insights - AMD (AMD.US) is set to release its Q3 FY2024 earnings on October 29. As one of the few companies capable of genuinely capturing market share from NVIDIA, AMD’s earnings report will be a focal point for the market.

Analysts' Projections Align with AMD’s Q3 Guidance


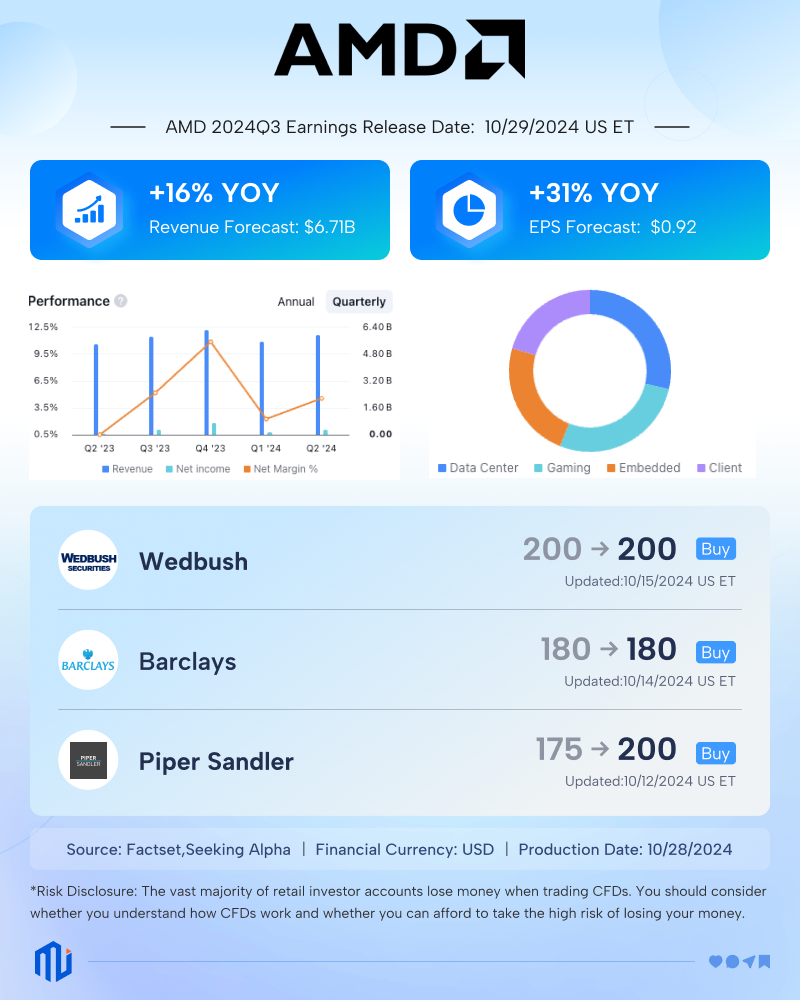
According to analyst estimates tracked by FactSet, AMD’s Q3 revenue is expected to reach $6.71 billion, with earnings per share (EPS) of $0.92 and net income of $333 million.

17301714423835


Previously, AMD’s Q3 revenue outlook had exceeded market expectations. The company projected Q3 FY2024 revenue to be around $6.7 billion, with a $300 million variance either way. At the midpoint, this would represent a year-over-year growth of approximately 16% and a quarter-over-quarter growth of around 15%. AMD also expects a non-GAAP gross margin of about 53.5%.


Can Data Center Growth Continue to Set Records?


The market remains focused on the performance of AMD’s Data Center and Client segments. In Q2, the Data Center segment posted record revenue of $2.8 billion, representing a 115% year-over-year growth, driven by strong shipments of the Instinct MI300 GPU and solid double-digit growth in EPYC CPU sales.


Analysts suggest that if AMD's AI chip sales, especially the MI300 series, exceed expectations and gain ground against NVIDIA, it could boost investor confidence and drive up the stock price. However, if sales disappoint, concerns about AMD's competitiveness could lead to a decline in stock value.


Wedbush analysts maintain an "Outperform" rating on AMD with a price target of $200, citing the company’s lack of updates on AI sales guidance or announcements of any new major customers. Bank of America analysts also retain a "Buy" rating with a price target of $180. However, Piper Sandler is more optimistic, raising AMD's price target from $175 to $200 and reaffirming its "Overweight" rating on the stock.

Read more

  • Bitcoin Plunges 13% in a Week as Market Retreats to $60,000 Level
  • Note: If you want to share the article 《AMD Q3 Earnings Preview: Can Data Center Revenues Continue to Set Records?》, make sure you retain the original link. For more information, please visit Insights or browse www.mitrade.com.

    * The content presented above, whether from a third party or not, is considered as general advice only.  This article should not be construed as containing investment advice, investment recommendations, an offer of or solicitation for any transactions in financial instruments.

    goTop
    quote
    Related Articles
    placeholder
    Nvidia Q3 Earnings Loom as Market Expects Revenue Near $109 Billion: Can NVDA Stock Hold $150? As of the close on November 16 ET, Nvidia (NVDA) shares fell 4.12% to close at $156.14, with an intraday low of $155.01 and trading volume of about 334 million shares. Compared with its p
    Author  TradingKey
    2 hours ago
    As of the close on November 16 ET, Nvidia (NVDA) shares fell 4.12% to close at $156.14, with an intraday low of $155.01 and trading volume of about 334 million shares. Compared with its p
    placeholder
    Weekly Report: The index rose 2.5% while Nvidia fell 12.7% — two equity divergences, one should closeThe S&P 500 rose 2.51% to 7,561.67 and the QQQ rose 3.63% to 679.89 last week, while Nvidia fell 12.75% to 162.85 — a sixth straight weekly loss and 32% below its October record. In the same five sessions, energy equities rose 5.42% while WTI fell 2.52%. Both pairs normally move together (60-day correlations of +0.64 and +0.58). This report ranks which divergence closes first, with the trigger for each.
    Author  Irene Q.
    Yesterday 02: 35
    The S&P 500 rose 2.51% to 7,561.67 and the QQQ rose 3.63% to 679.89 last week, while Nvidia fell 12.75% to 162.85 — a sixth straight weekly loss and 32% below its October record. In the same five sessions, energy equities rose 5.42% while WTI fell 2.52%. Both pairs normally move together (60-day correlations of +0.64 and +0.58). This report ranks which divergence closes first, with the trigger for each.
    placeholder
    Anthropic is six times oversubscribed at $1.4 trillion while Nvidia is down 32% — the AI trade has two pricesAnthropic lists on Nasdaq as ANT on Thursday at $70 ~ $78 a share, raising up to $64.4 billion at a target valuation near $1.4 trillion, and the book is reportedly six times covered. In the same six weeks, Nvidia has fallen 32% and the QQQ is 10.9% below its October peak. Private capital and public markets are marking the same AI complex at two very different prices. This piece separates the two books: what the S-1 shows, who is anchoring the $26 billion private placement, and what Thursday's debut would have to do to change the public tape.
    Author  Irene Q.
    Yesterday 02: 27
    Anthropic lists on Nasdaq as ANT on Thursday at $70 ~ $78 a share, raising up to $64.4 billion at a target valuation near $1.4 trillion, and the book is reportedly six times covered. In the same six weeks, Nvidia has fallen 32% and the QQQ is 10.9% below its October peak. Private capital and public markets are marking the same AI complex at two very different prices. This piece separates the two books: what the S-1 shows, who is anchoring the $26 billion private placement, and what Thursday's debut would have to do to change the public tape.
    placeholder
    Nvidia reports tomorrow with an interim CEO — $108 billion is the easy numberNvidia closed at 162.85 on Friday, down 12.75% on the week and 32% below its 6 October record, with market value down to $3.92 trillion. The Q3 bar is $108 billion ±2%, and consensus already sits at $108.7 ~ 108.8 billion, so the revenue line is not where the surprise lives. The number that decides the reaction is the 71 ~ 72% Q4 gross-margin trough, followed by a Q4 guide against a $124.9 billion consensus. This piece prices the print, marks the 158.39 line and lays out the three scenarios in a table.
    Author  Irene Q.
    Yesterday 02: 11
    Nvidia closed at 162.85 on Friday, down 12.75% on the week and 32% below its 6 October record, with market value down to $3.92 trillion. The Q3 bar is $108 billion ±2%, and consensus already sits at $108.7 ~ 108.8 billion, so the revenue line is not where the surprise lives. The number that decides the reaction is the 71 ~ 72% Q4 gross-margin trough, followed by a Q4 guide against a $124.9 billion consensus. This piece prices the print, marks the 158.39 line and lays out the three scenarios in a table.
    placeholder
    Today’s Market Recap: Nvidia Drops Over 4% After Jensen Huang Resigns, AMD and Broadcom Both Rise Over 5% On November 12, the three major U.S. stock indices closed slightly lower. Nvidia announced that Jensen Huang had stepped down immediately as CEO and director, draggi
    Author  TradingKey
    Nov 13, Fri
    On November 12, the three major U.S. stock indices closed slightly lower. Nvidia announced that Jensen Huang had stepped down immediately as CEO and director, draggi

    US Stocks Related Articles

    • 10 Best Day Trading Platforms for Beginners and Active Traders in 2026: A Practical Guide
    • How To Invest in SpaceX Stock in 2026? Everything Investors Need to Know
    • Practice Trading Us Stocks? These Are 10 Best Stock Trading Demo Apps For Beginners
    • ​5 Best Paper Trading Platforms for 2026 (Free Demo Accounts for Beginners & Traders)
    • Wall Street’s Top 10 US Stocks for 2026 vs What Reddit Is Actually Buying
    • Is Mitrade Right for You? A Complete Guide on How to Start Trading CFDs in 5 Steps

    Click to view more