NAB's 13% profit fall was mostly accounting — the bad-debt line wasn't

coverImg
Source: DepositPhotos

Mitrade Insights — Three numbers explain National Australia Bank's full-year result, and only one of them is about credit. Cash earnings fell 13% to A$6.1bn, roughly 4% below Macquarie's forecast. An A$1.3bn software amortisation charge sits inside that figure — a non-cash accounting item. Strip it out and earnings were flat at A$7.1bn, with the final dividend held at A$1.70.

The shares did not read it that way. NAB fell as much as 7.9% to A$37.91 and was trading 6.19% lower at A$38.62 in afternoon Sydney trade, against a prior close of A$41.17.
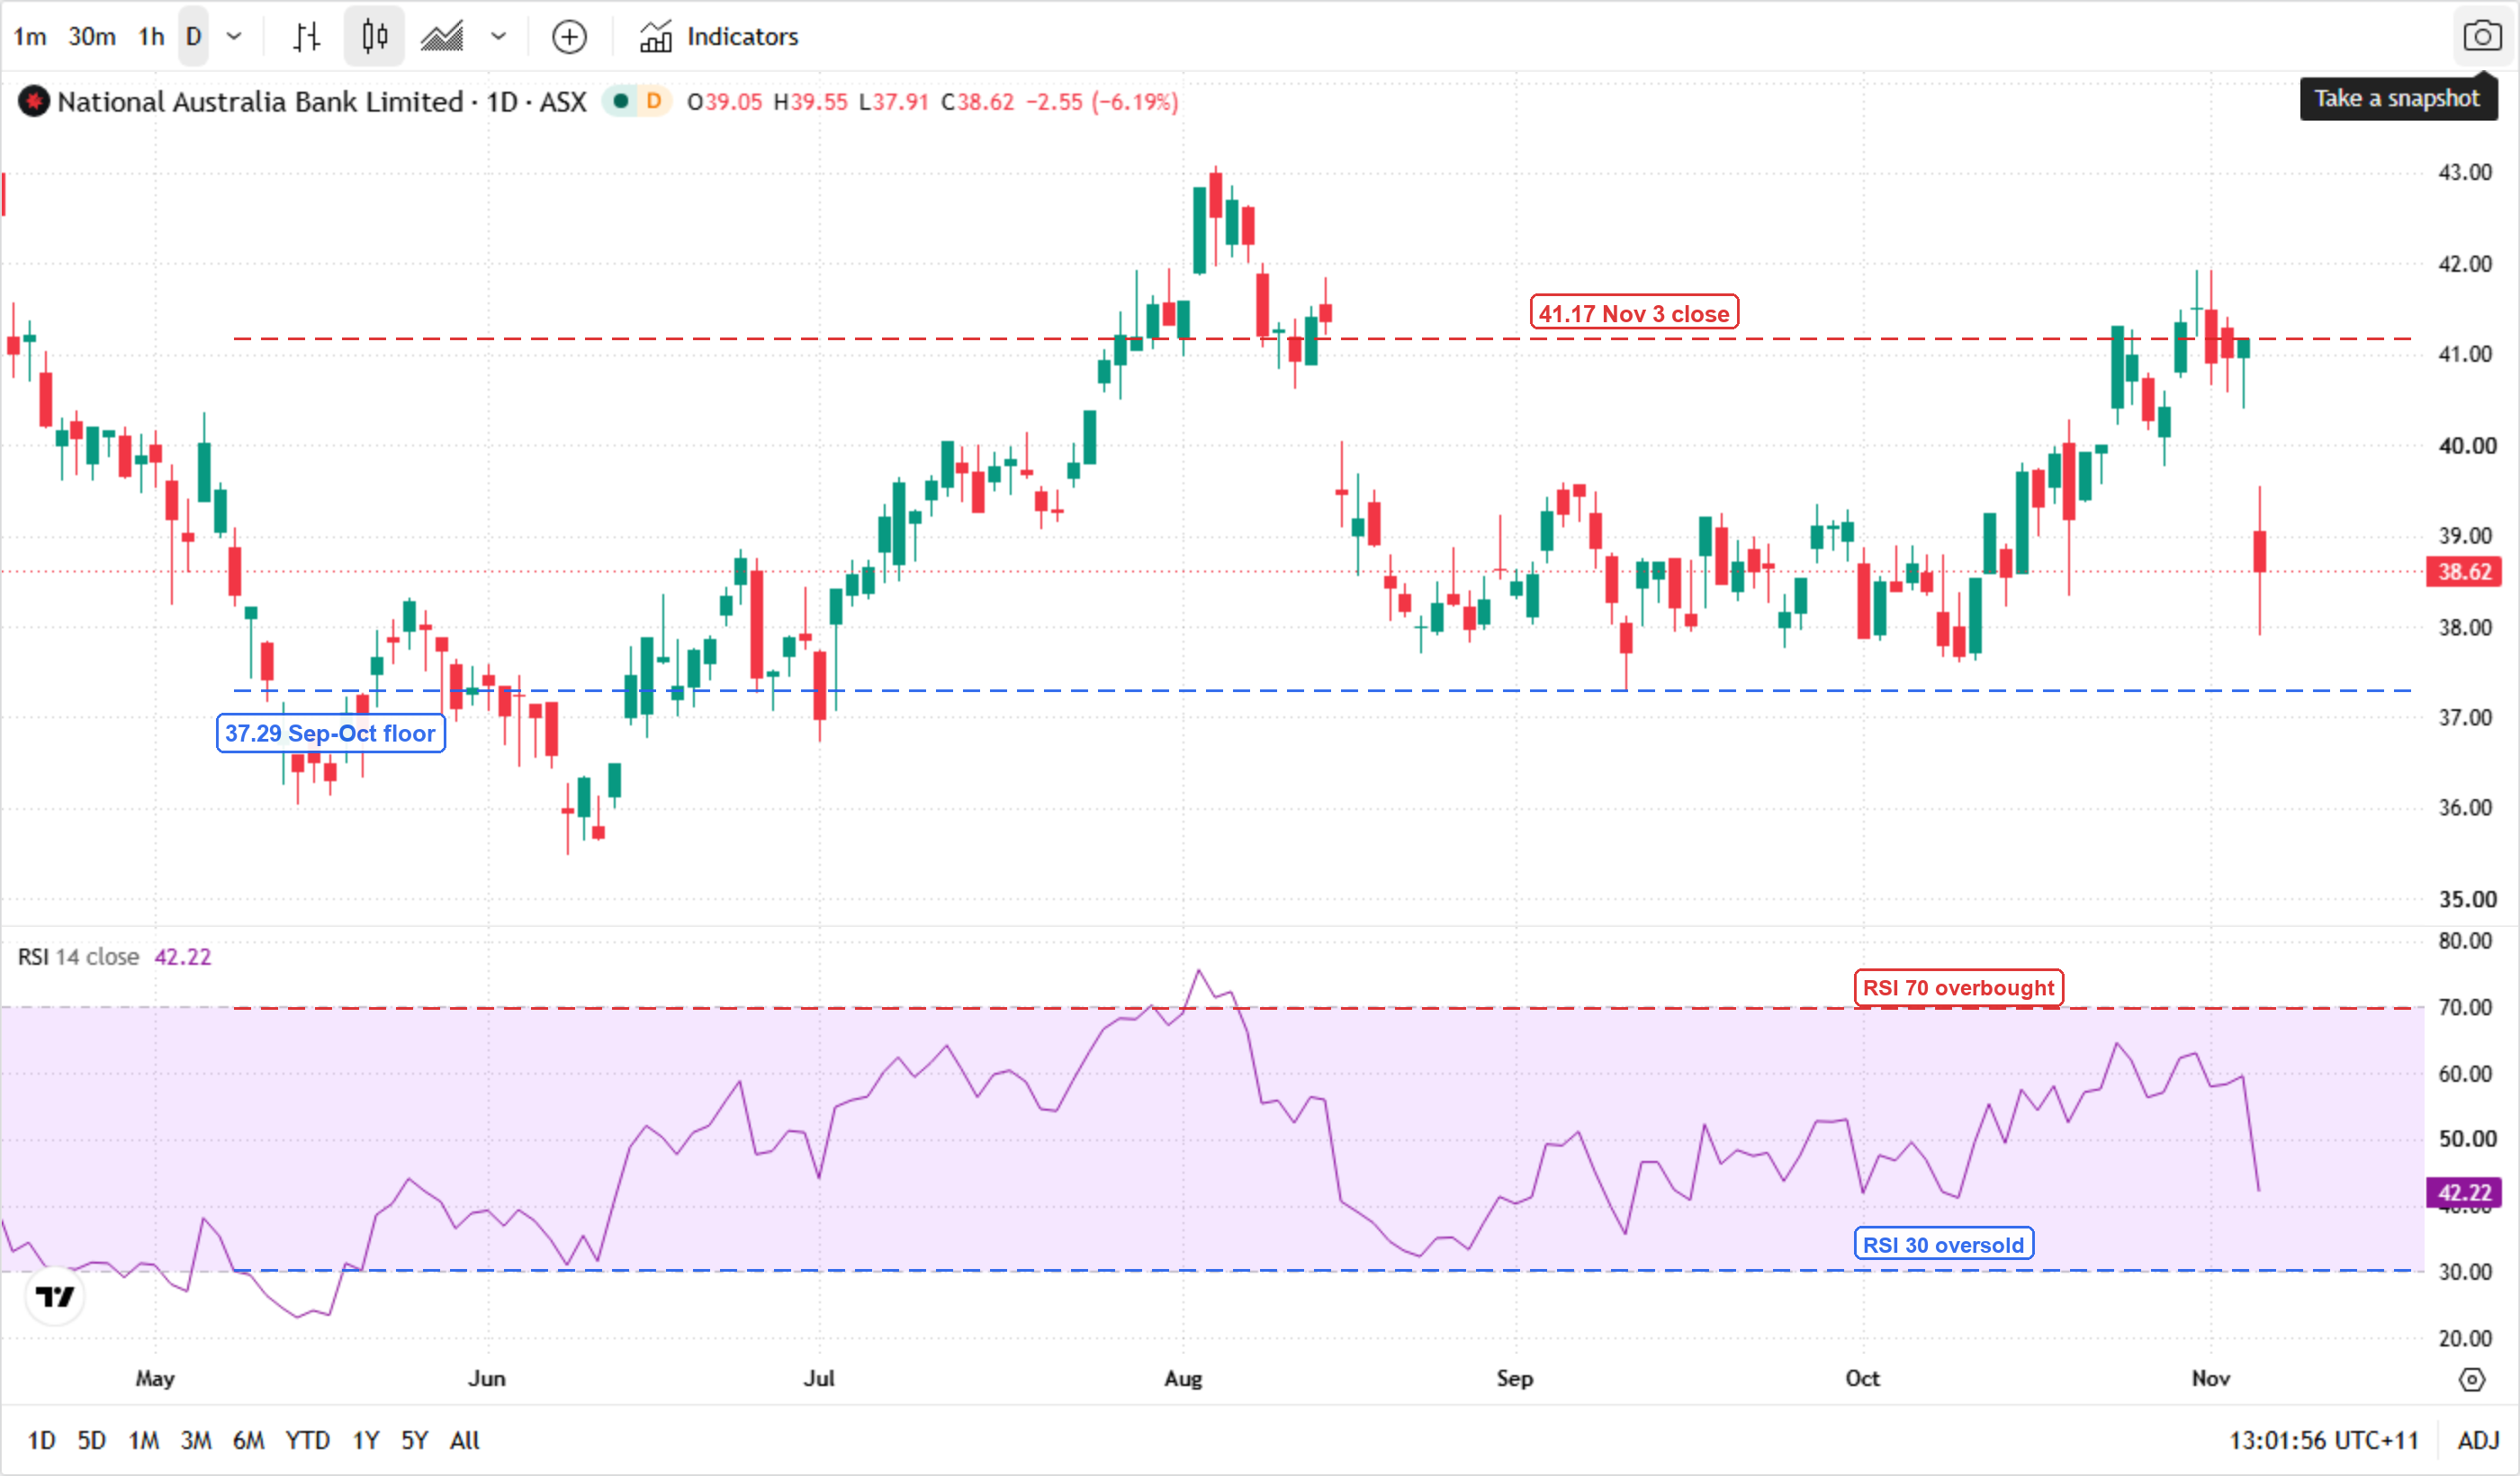
National Australia Bank (ASX: NAB) daily chart from May to November 2026 with a 14-period RSI sub-panel, marking the A$41.17 November 3 close that was left behind, the A$37.29 September-October floor, and RSI at 42.22 between the 70 and 30 lines.

* Chart source: TradingView (ASX: NAB, daily)

Two things stand out on the chart. The gap from A$41.17 leaves the whole October rally stranded above the current price, and the RSI is at 42.22 — well above the 30 line. This is not an oversold bounce setup; momentum has room to keep falling before it looks stretched.

What the 13% actually contains

LineFY2026What it means
Cash earnings (reported)A$6.1bn−13% year on year, ~4% below the Macquarie forecast
Software amortisation chargeA$1.3bnNon-cash; hits the reported number, not cash flow
Cash earnings ex-chargeA$7.1bnFlat year on year
Final dividendA$1.70 per shareHeld, not cut
Bad debt chargesSharply higherFlagged in the result as the credit line deteriorated

The distinction between a non-cash charge and a bad-debt charge is the difference between a bookkeeping decision and a statement about the economy. Amortisation is a schedule. Bad debts are borrowers who cannot pay, and they arrive on the P&L long after the cash rate has already moved.

The rest of the Big Four did not follow

Westpac fell around 2.4% and ANZ about 2.0%. Commonwealth Bank was roughly flat. If this were a sector-wide credit event, all four would have repriced together. The market instead singled out NAB's book — which is the correct response when one bank reports a deteriorating credit line before the others have reported theirs.

The strongest case against the accounting defence

Even after removing the A$1.3bn charge, earnings were flat, not higher — in a year when the cash rate sat at 4.85%, an 18-year high. A bank holding rates that high should be earning more on its deposit base. Flat ex-charge earnings is therefore not a clean result being misread; it is a result where the clean number already shows no growth.

What would make the 13% matter

One-off case. The amortisation schedule is a reclassification, ex-charge earnings held, the dividend held at A$1.70, and the bad-debt commentary is backward-looking. In that world the shares should reclaim A$41.17 within a few sessions, and the September-October floor of A$37.29 is never tested.

Cycle case. The bad-debt line is the leading indicator, not the trailing one. Cash rate at 4.85% with employment softening means arrears keep building for another two quarters. Westpac and ANZ report similar language at their own updates, and the market stops pricing NAB alone — the whole sector de-rates, and A$37.29 becomes the level that decides whether this is a de-rating or a trend.

The two cases are separated by one disclosure: the size and composition of the bad-debt charge. Until that is quantified, the ex-charge A$7.1bn is the number the bulls need to defend, and A$41.17 is the print that tells you which case the market has picked.

Read more

  • Democrats Win Midterms, Driving Gold Up Over $100 Intraday Back Above $4,000
  • Note: If you want to share the article 《NAB's 13% profit fall was mostly accounting — the bad-debt line wasn't》, make sure you retain the original link. For more information, please visit Insights or browse www.mitrade.com.


    Before making any trading decisions, it is important to equip yourself with sufficient fundamental knowledge, have a comprehensive understanding of market trends, be aware of risks and hidden costs, carefully consider investment targets, level of experience, risk appetite, and seek professional advice if necessary.


    Furthermore, the content of this article is solely the author's personal opinion and does not necessarily constitute investment advice. The content of this article is for reference purposes only, and readers should not use this article as a basis for any investment decisions.


    Investors should not rely on this information as a substitute for independent judgment or make decisions solely based on this information. It does not constitute any trading activity and does not guarantee any profits in trading.


    If you have any inquiries regarding the data, information, or content related to Mitrade in this article, please contact us via email: insights@mitrade.com. The Mitrade team will carefully review the content to continue improving the quality of the article.


    goTop
    quote
    Related Articles
    placeholder
    AMD's data center nearly doubled — the $554 million free-cash-flow line is the catchAMD Q3 revenue rose 45% to $13.38B, data center jumped 97% to $8.5B, and EPS hit $2.09; Q4 guidance is $17B. The stock rose 3.65% to $483.90, but free cash flow was $554M versus $1.97B expected.
    Author  Irene Q.
    Yesterday 03: 13
    AMD Q3 revenue rose 45% to $13.38B, data center jumped 97% to $8.5B, and EPS hit $2.09; Q4 guidance is $17B. The stock rose 3.65% to $483.90, but free cash flow was $554M versus $1.97B expected.
    placeholder
    Apple beat, then fell: the memory bill is the AI trade's new tellApple's Q4 revenue rose 12% to $114.48B and EPS hit $2.10, but the stock fell 1.83% to $338.32 as gross-margin guidance dropped to 45%–46% on higher memory costs.
    Author  Irene Q.
    Nov 03, Tue
    Apple's Q4 revenue rose 12% to $114.48B and EPS hit $2.10, but the stock fell 1.83% to $338.32 as gross-margin guidance dropped to 45%–46% on higher memory costs.
    placeholder
    Microsoft passed the free-cash-flow test. Alphabet failed it by $9 billion — and Amazon is nextMicrosoft's Azure grew 48% and free cash flow came in at $18.6 billion; Alphabet's cloud grew 103% but free cash flow was negative $9.07 billion and the stock fell about 9.3% after hours. The AI capex test from October 26 now has a scorecard: Microsoft is the cushion, Alphabet is the warning, and Amazon reports tonight.
    Author  Irene Q.
    Oct 29, Thu
    Microsoft's Azure grew 48% and free cash flow came in at $18.6 billion; Alphabet's cloud grew 103% but free cash flow was negative $9.07 billion and the stock fell about 9.3% after hours. The AI capex test from October 26 now has a scorecard: Microsoft is the cushion, Alphabet is the warning, and Amazon reports tonight.
    placeholder
    Anthropic files for a $2 trillion IPO — the $80.7 billion loss is the decoy, the $450 billion compute bill is the riskAnthropic publicly filed its S-1 on October 26, revealing $16.29 billion of first-half revenue (+1,304% year over year) and a $80.7 billion net loss — of which $72.4 billion is a non-cash convertible-note charge. The real number is the $450 billion of signed, mostly non-cancelable compute commitments. Here is what the filing says, why NVDA, ARM and MU are the tradeable read-through, and the conditions that decide whether the AI trade passes its first public valuation test.
    Author  Irene Q.
    Oct 27, Tue
    Anthropic publicly filed its S-1 on October 26, revealing $16.29 billion of first-half revenue (+1,304% year over year) and a $80.7 billion net loss — of which $72.4 billion is a non-cash convertible-note charge. The real number is the $450 billion of signed, mostly non-cancelable compute commitments. Here is what the filing says, why NVDA, ARM and MU are the tradeable read-through, and the conditions that decide whether the AI trade passes its first public valuation test.
    placeholder
    Tesla jumps 5% as Barclays puts a $450 target on the SpaceX merger — the chart was already pointing to 431Tesla closed at $391.62 on October 26, up 5.21%, after Barclays upgraded the stock to Overweight and lifted its target to $450 from $370, citing a sharp inflection in Robotaxi miles and a potential SpaceX merger. The move also completed a double bottom at $345.88 and $349.33, with a neckline at $388.56 and a measured target of $431.24. Here is what the upgrade actually says, why the chart and the analyst now point the same way, and what would break the target.
    Author  Irene Q.
    Oct 27, Tue
    Tesla closed at $391.62 on October 26, up 5.21%, after Barclays upgraded the stock to Overweight and lifted its target to $450 from $370, citing a sharp inflection in Robotaxi miles and a potential SpaceX merger. The move also completed a double bottom at $345.88 and $349.33, with a neckline at $388.56 and a measured target of $431.24. Here is what the upgrade actually says, why the chart and the analyst now point the same way, and what would break the target.
    Live Quotes
    Name / SymbolChart% Change / Price
    AUS200
    AUS200
    0.00%0.00
    XLF
    XLF
    0.00%0.00