


Home Depot vs. Walmart: Which Consumer Stock Is a Better Buy for 2027?
Key Points
Home Depot dominates the professional contractor market through specialized service programs and strategic logistics acquisitions.
Walmart utilizes its immense scale and grocery leadership to drive consistent traffic across its global omnichannel network.
Which retail giant is better positioned to deliver steady growth for your portfolio through 2027?
- Motley Fool Issues Rare "Total Conviction" Buy Alert ›
Deciding whether to invest in Home Depot (NYSE:HD) or Walmart (NASDAQ:WMT) involves weighing specialized home improvement expertise against the sheer scale of the world's largest general merchandise retailer.
Home Depot focuses on the specialized market for building materials and professional services, while Walmart relies on its massive grocery business and value-based global reach. Both companies are foundational to the consumer economy, yet they respond differently to shifting interest rates and household budgets.
The case for Home Depot
Home Depot is the world's largest home improvement specialty retailer, catering to both DIY enthusiasts and professional contractors, known as "Pros." The company has intensified its focus on these Pro customers through its Pro Xtra loyalty program and Pro Trade Credit offerings. It recently expanded its capabilities in this segment through the strategic acquisitions of SRS and GMS, which provide distribution for roofing and interior construction products. These moves strengthen its position among retail stocks that serve the residential construction and remodeling markets.
In the 12 months ended Aug. 2, 2026, revenue reached nearly $169.2 billion, representing a growth rate of approximately 2.5% compared to the prior year. The company reported net income of roughly $14.2 billion. This financial performance reflects steady demand for home renovation projects, even as high interest rates affected the broader housing market at times.
As of its February 2026 balance sheet, Home Depot carries a debt-to-equity ratio of nearly 5.1. This value indicates that the company's total liabilities exceed five times its total shareholders' equity. The current ratio, which measures a company's ability to pay short-term obligations with assets that can be converted to cash quickly, is approximately 1.1. In the fiscal year ended Feb. 1, 2026, free cash flow was close to $12.6 billion.
The case for Walmart
Walmart serves approximately 280 million customers weekly through a vast network of discount stores, warehouse clubs, and e-commerce websites. The company leverages its massive scale to provide low prices on groceries, health and wellness products, and general merchandise across its Walmart U.S. and Sam's Club segments. Its tech-powered omnichannel strategy allows it to compete effectively in the digital marketplace by offering pickup and delivery services that complement its physical footprint in 19 countries.
In the 12 months ended July 31, 2026, revenue reached roughly $735.8 billion, a 6.2% increase over the preceding 12-month period. Net income was approximately $22.1 billion. This growth demonstrates the resilience of the grocery segment, which continues to drive frequent store visits and online orders even when consumers pull back on discretionary spending.
As of January 2026, Walmart maintains a debt-to-equity ratio of nearly 0.7. This suggests that total liabilities are roughly 70% of shareholder equity, indicating a lower reliance on debt relative to its equity base compared to many industry peers. The current ratio is approximately 0.8, which means short-term liabilities slightly exceed short-term assets. In the fiscal year ended Jan. 31, 2026, free cash flow reached nearly $14.9 billion.
Risk profile comparison
Home Depot faces risks from intense competition in a fragmented home improvement market and the complex integration of its recent large-scale acquisitions. The company also navigates cybersecurity vulnerabilities and potential data breaches as it increases its reliance on digital platforms and automation. Additionally, Home Depot manages ongoing litigation risks, including a class action lawsuit regarding the alleged unauthorized use of AI-powered license plate readers in its store parking lots.
Walmart must successfully execute its omnichannel strategy and realize benefits from heavy investments in technology and supply chain automation to stay ahead of digital rivals. The company faces significant regulatory and legal risks, including recent settlements related to labor practices and the sale of expired products. Furthermore, Walmart's international operations are exposed to risks from fluctuating currency exchange rates and changes in global trade policies or tariffs.
Valuation comparison
Walmart appears cheaper based on its lower sales multiple, while Home Depot offers a lower entry point relative to its future earnings estimates.
| Metric | Home Depot | Walmart |
|---|---|---|
| Forward P/E | 23.2 | 43.7 |
| P/S ratio | 2.1 | 1.4 |
Valuation metrics include sourcing from Financial Modeling Prep (FMP) and may differ from other data providers.
Which stock would I buy for 2027?
Retailers are generally not super attractive stocks to me. For one, their net margins tend to be on the low side. Home Depot's net margin for the 12 months ended in August was 8.4%. Walmart's net margin for roughly the same period was only 3%. However, I do like stocks that reward shareholders with dividends. The home renovation specialist is currently paying a dividend of about 2.7%. Walmart's payout is much more modest, with a yield around 0.8%.
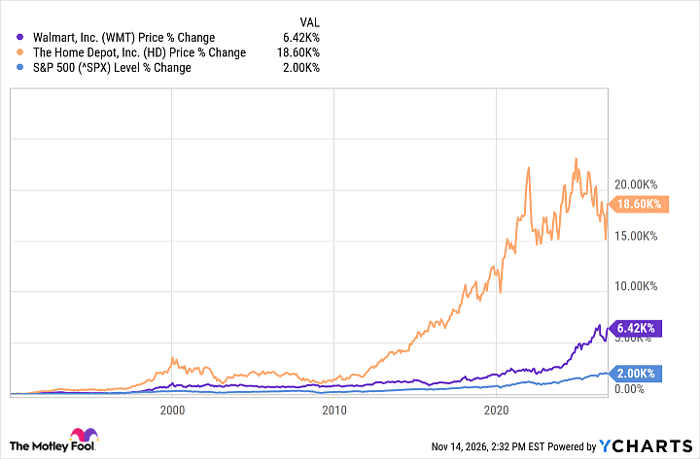
Let's consider the two retail stocks' long-term performance:
WMT data by YCharts
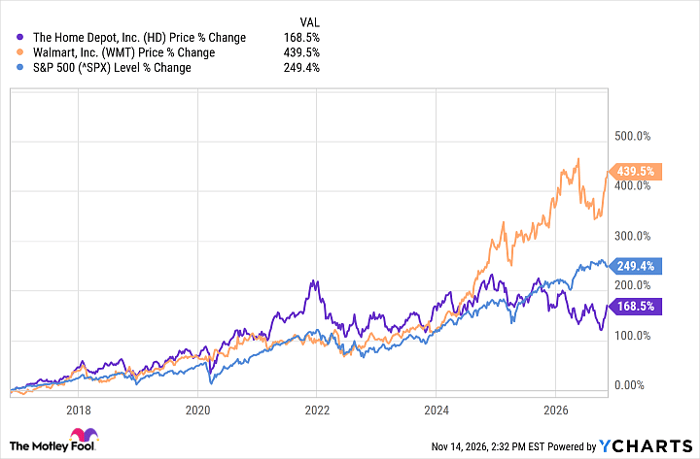
Home Depot has absolutely crushed it. But the tables turn on a shorter time frame:
HD data by YCharts
Walmart has outperformed Home Depot over the past 10 years. Of course, past performance is no guarantee of future results. It would be nice if you'd bought Home Depot decades ago, or Walmart 10 years ago. But for 2027 and beyond, I think Home Depot looks like a better stock. Shares haven't been as strong as those of Walmart recently, but the DIY giant has outperformed the S&P 500. I also like its higher net margin. And you'll be paid a respectable dividend while you wait for growth to reaccelerate.
Should you buy stock in Home Depot right now?
Before you buy stock in Home Depot, consider this:
The Motley Fool Stock Advisor analyst team just identified what they believe are the 10 best stocks for investors to buy now… and Home Depot wasn’t one of them. The 10 stocks that made the cut could produce monster returns in the coming years.
Consider when Netflix made this list on December 17, 2004... if you invested $1,000 at the time of our recommendation, you’d have $335,171!* Or when Nvidia made this list on April 15, 2005... if you invested $1,000 at the time of our recommendation, you’d have $1,000,640!*
Now, it’s worth noting Stock Advisor’s total average return is 823% — a market-crushing outperformance compared to 208% for the S&P 500. Don't miss the latest top 10 list, available with Stock Advisor, and join an investing community built by individual investors for individual investors.
See the 10 stocks »
*Stock Advisor returns as of November 15, 2026.
Erin Kennedy has positions in Home Depot. The Motley Fool has positions in and recommends Home Depot and Walmart. The Motley Fool has a disclosure policy.
Recommended Articles


