

Target Stock Heads Into Earnings Up 70% This Year, With $169.24 the Level to Beat

Source Tradingkey

TradingKey - Target (NYSE: TGT) reports fiscal third-quarter results on Wednesday, November 18, before the market opens. The stock rose 70.3% this year through November 11, far ahead of the 11.6% gain in the S&P 500 ETF and 18.7% in the consumer staples ETF.

That rally has left the stock close to where analysts thought it should be. The average analyst target sits around $163 to $165, only a few dollars above recent prices, so Wednesday's report has to give analysts a reason to raise their targets.

Shoppers Came Back in the Second Quarter

Under CEO Michael Fiddelke, shoppers have started coming back. In the second quarter, net sales rose 5.3% to $26.5 billion, and comparable sales, which compare sales from stores open at least a year plus digital orders, rose 3.8%. Transactions rose 3.6%, while the average purchase rose just 0.2%, so the growth came from more shoppers, not bigger baskets. Digital comparable sales rose 8.7%, and same-day delivery grew more than 25%. Fiddelke said the results show "increasing confidence that our strategy is resonating with our guests."

The Tariff Refund Flatters the Headline

Earnings per share jumped to $4.11 from $2.05, but a one-time $994 million tariff refund added $1.65 a share. The refund also added 3.7 percentage points to the operating margin, which reached 9.6%. Without it, EPS grew about 20% and the operating margin rose about 70 basis points, or 0.7 percentage point.

Target raised its fiscal 2026 EPS guidance to $9.90 to $10.90, including the roughly $1.65 refund. By my calculation, that leaves $8.25 to $9.25 without the refund. The full-year analyst estimate of $8.89, reported by Barchart, falls inside that range, which suggests analysts are looking past the refund. For the third quarter, Barchart puts consensus EPS at $2.08, up 16.9% from $1.78, and Target has beaten estimates in each of its last four quarters.

What Could Still Go Wrong

The 70% rally assumes the turnaround will last, but revenue has not grown much over time. Trefis notes that trailing 12-month revenue of $108 billion is the same as in mid-2022. Home furnishings and decor sales fell 6.5% last fiscal year, and Target cut prices on nearly 2,000 home, apparel and accessories items in late September. According to Trefis, management has said work on home and apparel will continue "into 2027 and beyond." So Wednesday's key tests are whether traffic is still rising and whether margins hold up without refunds.

Target Technical Analysis: Weekly Close Above $169.24 Could Open $184.69

That optimism shows clearly on the weekly chart. Target has climbed steadily inside a rising channel, two parallel lines that have guided prices higher, since mid-2025, nearly doubling from the low near $80. Buyers defended the lower edge of that channel, now near $147.3, in recent weeks, and the latest bounce started from the $144.80 low just below it. An earnings marker on the chart also points to volatility ahead.

RSI, a momentum gauge that runs from 0 to 100, sits near 67, just above its signal line. The MACD, another momentum indicator, still shows slightly negative histogram bars, but they are shrinking, which hints that buyers are regaining momentum.
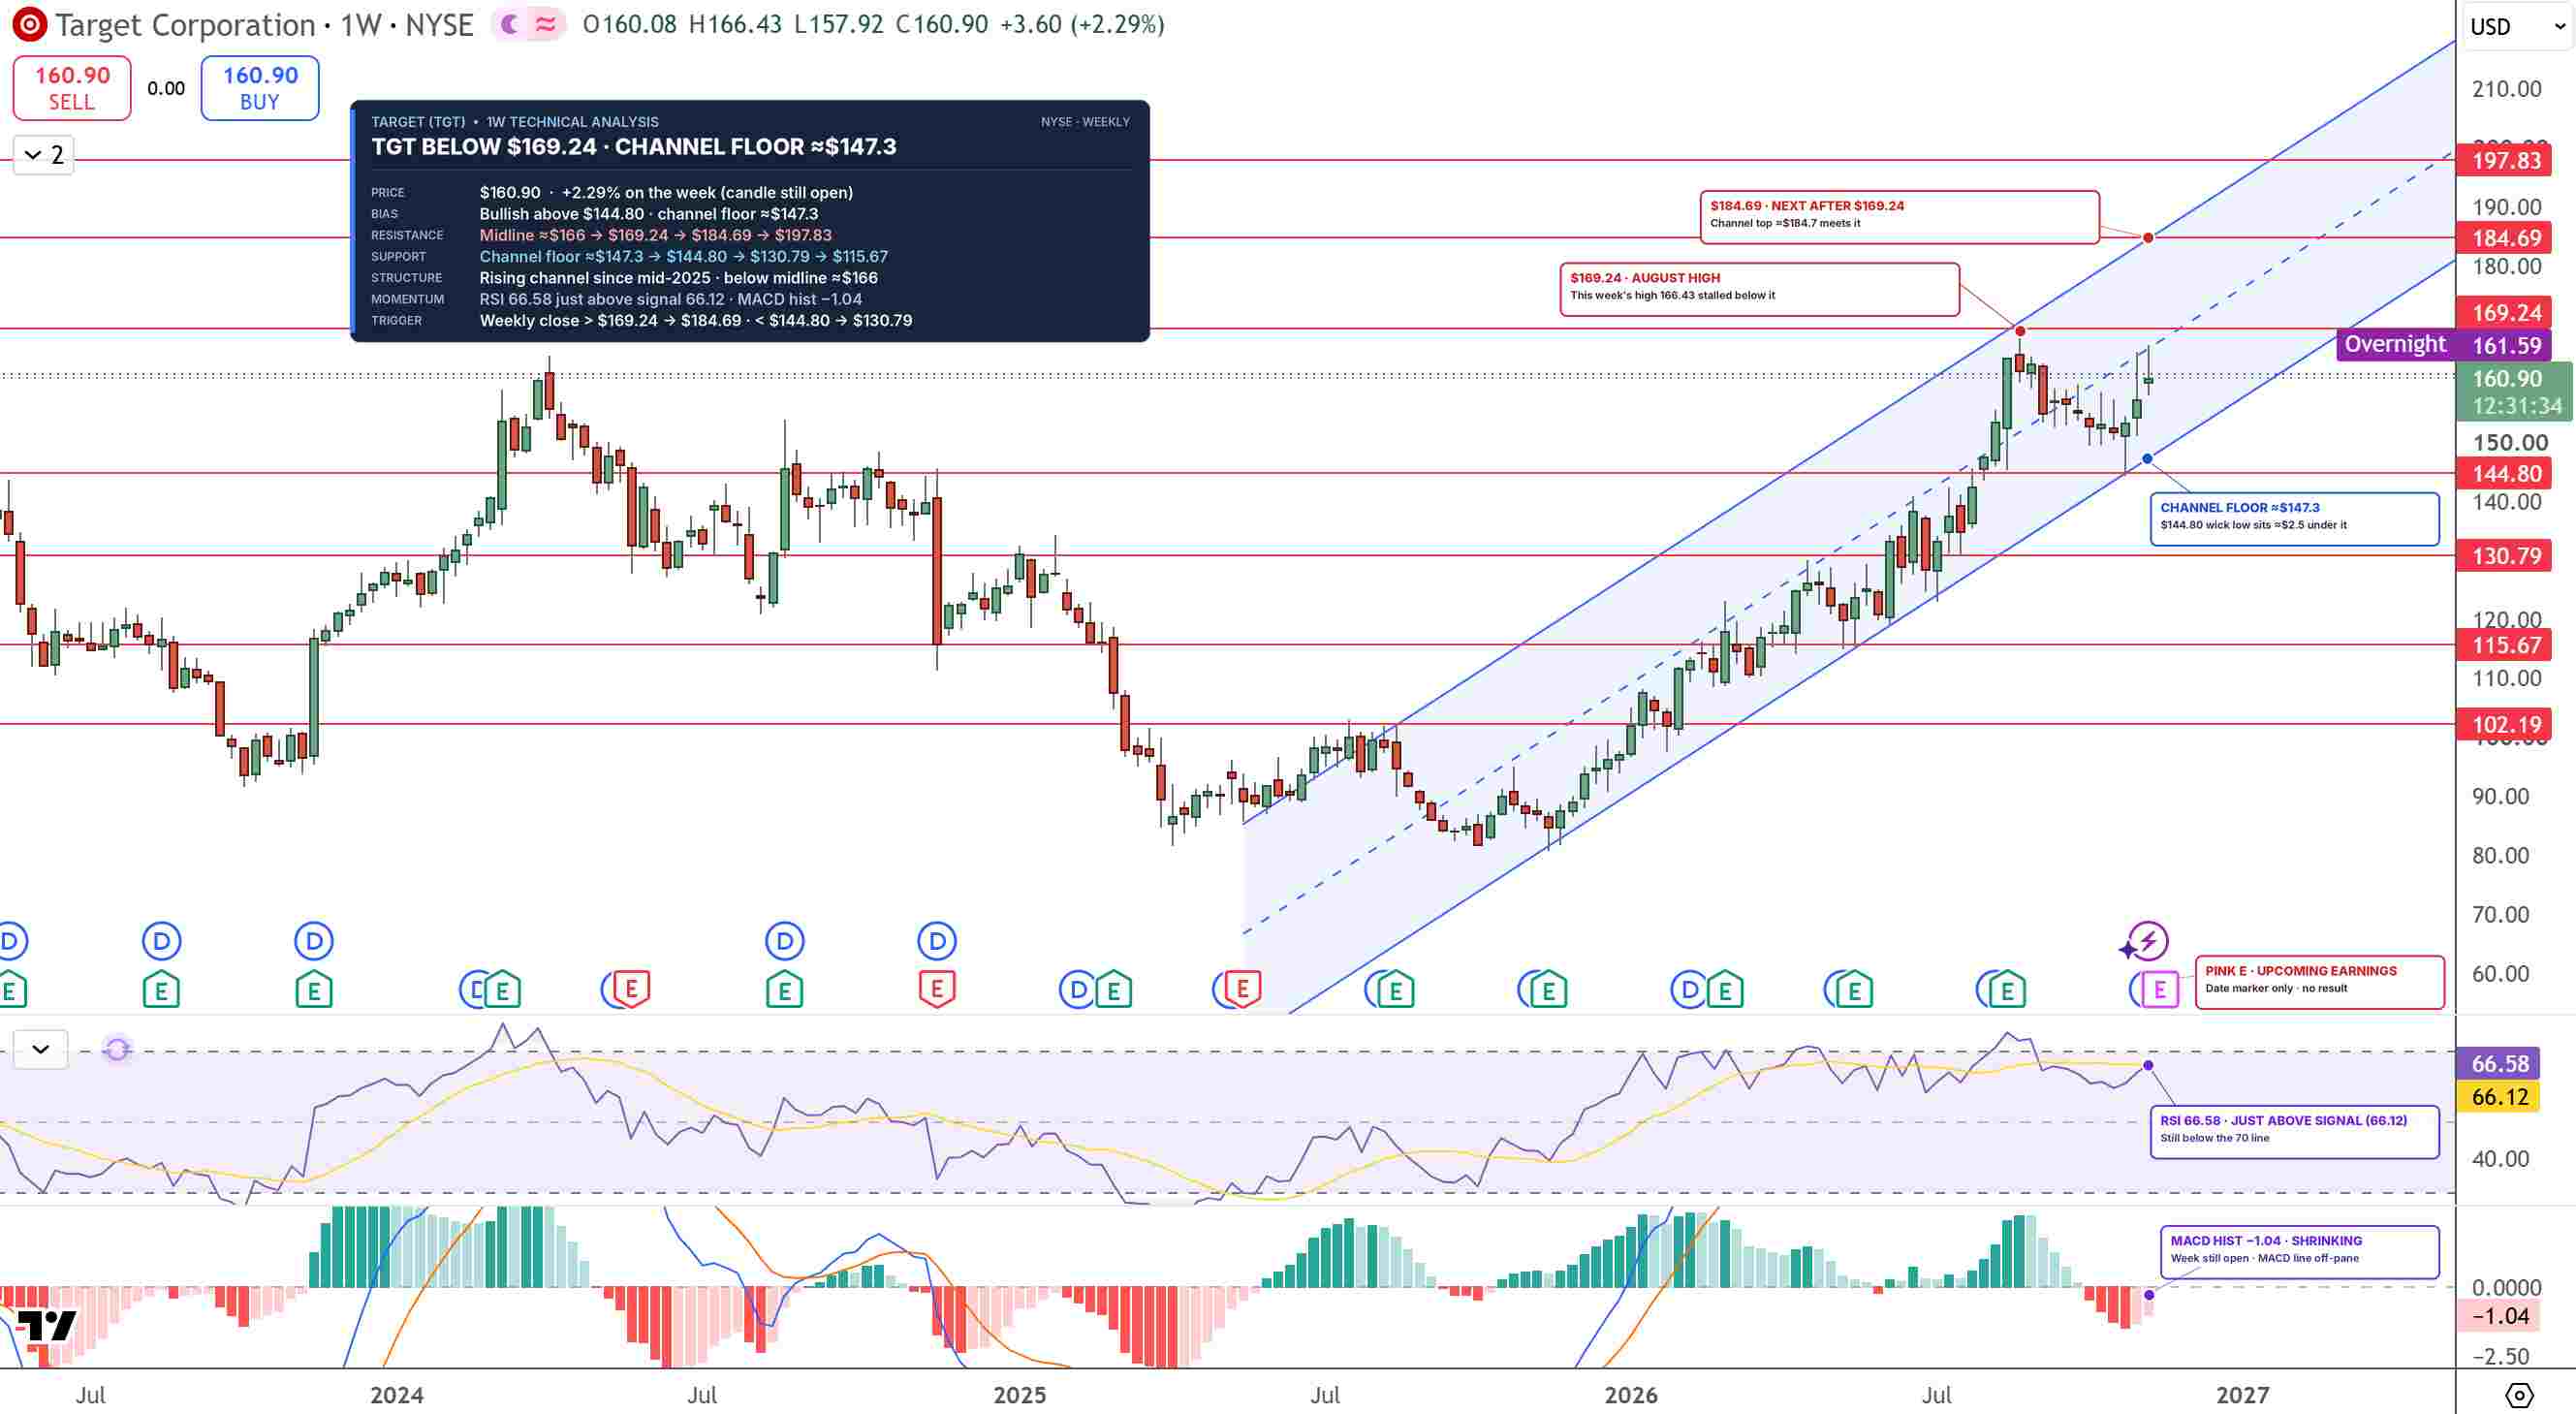
TGT Price Chart - Source: Tradingview

TGT Price Chart - Source: Tradingview

A weekly close above $169.24, the August high, could open $184.69, followed by $197.83. On the downside, $144.80 is key support, and a weekly close below it would break the channel and could send TGT toward $130.79.

I'm bullish while TGT holds above $144.80, with $169.24 as the next breakout level.

Key Levels

  • Last close: $160.90 on Thursday, November 12 (overnight: $161.59)
  • Support: $144.80, $130.79
  • Resistance: $169.24, $184.69, $197.83
  • RSI: 66.58
  • Bullish trigger: Weekly close above $169.24
  • Bearish trigger: Weekly close below $144.80

FAQs

When does Target report Q3 2026 earnings?

Target reports fiscal third-quarter results on Wednesday, November 18, before the market opens. Analysts expect EPS of $2.08, up 16.9% from a year earlier.

What is the Target stock forecast before earnings?

The bias is bullish while TGT holds above $144.80, just below the lower edge of its rising channel on the weekly chart. A weekly close above $169.24 could open $184.69 and $197.83, while a weekly close below $144.80 could send the stock toward $130.79.

Bottom Line

Target has earned its rally with more shoppers, but much of this year's profit jump came from a one-time refund, and the stock already sits near analysts' average target. The level that matters is $169.24. In my view, a weekly close above it would confirm the uptrend, while a weekly close below $144.80 would end the channel that has carried the stock since mid-2025.

Disclaimer: For information purposes only. Past performance is not indicative of future results.
placeholder
Gold Price Analysis Today | Forex Gold Analysis | XAU/USD Analysis - November 11, 2026Get the latest gold price analysis, forex gold insights, and XAU/USD analysis for November 11, 2026. Read on for the details.
Author  Mitrade
Nov 11, Wed
Get the latest gold price analysis, forex gold insights, and XAU/USD analysis for November 11, 2026. Read on for the details.
placeholder
Bitcoin lost its 200-day average — but the exit started three sessions before the CPIBitcoin fell 2.5% to about $73,400 on 11 November, an 11-week low, breaking its 200-day moving average near $73,100. The 24-hour liquidation tally reached $632 to $705 million, roughly 82% of it longs. But spot ETF outflows began three sessions earlier and USDT's market cap has shrunk $6.6 billion in 60 days — the leveraged length left before the inflation print did. A double top at 81,890 and 81,080 leaves a measured target of 69,366.
Author  Suzie
Nov 11, Wed
Bitcoin fell 2.5% to about $73,400 on 11 November, an 11-week low, breaking its 200-day moving average near $73,100. The 24-hour liquidation tally reached $632 to $705 million, roughly 82% of it longs. But spot ETF outflows began three sessions earlier and USDT's market cap has shrunk $6.6 billion in 60 days — the leveraged length left before the inflation print did. A double top at 81,890 and 81,080 leaves a measured target of 69,366.
placeholder
Nvidia slid 7.7% after hours while AMD and Broadcom rose — the AI trade changed hands, it didn't breakNvidia closed Wednesday at 173.73, up 2.87%, then fell as much as 8.1% to 159.44 after reports that its board was preparing for a possible leadership change. The same session, the Philadelphia Semiconductor Index rose 5.7% with all 30 components higher, CoreWeave jumped 24.7% on 168% revenue growth, and Micron added 11.9%. If AI demand were being repriced, AMD and Broadcom would not be bid. This is a governance discount on one name, and 204.54 — the 200-day average — is the level that settles it.
Author  Irene Q.
Nov 12, Thu
Nvidia closed Wednesday at 173.73, up 2.87%, then fell as much as 8.1% to 159.44 after reports that its board was preparing for a possible leadership change. The same session, the Philadelphia Semiconductor Index rose 5.7% with all 30 components higher, CoreWeave jumped 24.7% on 168% revenue growth, and Micron added 11.9%. If AI demand were being repriced, AMD and Broadcom would not be bid. This is a governance discount on one name, and 204.54 — the 200-day average — is the level that settles it.
placeholder
Gold hit a one-year low while central banks bought 321 tonnes — the sellers were never the ones you thinkSpot gold closed at 3,876 on Thursday, down 2.8% and its lowest close in more than a year, with an intraday low near 3,852. The dollar is at a 19-month high of 103.21 and the 10-year yield is at 5.10%, so the price move is easy to explain. What is harder to explain is who sold: central banks bought 321 tonnes in Q3, the PBoC added for a 24th straight month, ETF holdings are near a record 4,256 tonnes, and roughly 95% of the futures selling came from non-reportable and sovereign-type accounts rather than hedge funds. This piece separates the two books that have to balance.
Author  Irene Q.
Yesterday 02: 40
Spot gold closed at 3,876 on Thursday, down 2.8% and its lowest close in more than a year, with an intraday low near 3,852. The dollar is at a 19-month high of 103.21 and the 10-year yield is at 5.10%, so the price move is easy to explain. What is harder to explain is who sold: central banks bought 321 tonnes in Q3, the PBoC added for a 24th straight month, ETF holdings are near a record 4,256 tonnes, and roughly 95% of the futures selling came from non-reportable and sovereign-type accounts rather than hedge funds. This piece separates the two books that have to balance.
placeholder
Brent rose 3.3% and US crude stocks built 4.66 million barrels in the same weekBrent January settled at 95.82, up 3.3%, and WTI at 88.74, up 2.55%, after the US signalled it would not pursue a deal with Iran and attacks on Gulf shipping continued. In the same week, EIA data showed US crude inventories rising 4.657 million barrels against expectations of a 1.1 million draw, with gasoline up another 1.799 million. OPEC output also rebounded 1.96 million barrels a day to 27.16 million in October, led by Saudi Arabia at 10.56 million. This piece separates the geopolitical premium from the physical balance and lays out where each side of the trade is anchored.
Author  Irene Q.
Yesterday 03: 06
Brent January settled at 95.82, up 3.3%, and WTI at 88.74, up 2.55%, after the US signalled it would not pursue a deal with Iran and attacks on Gulf shipping continued. In the same week, EIA data showed US crude inventories rising 4.657 million barrels against expectations of a 1.1 million draw, with gasoline up another 1.799 million. OPEC output also rebounded 1.96 million barrels a day to 27.16 million in October, led by Saudi Arabia at 10.56 million. This piece separates the geopolitical premium from the physical balance and lays out where each side of the trade is anchored.
goTop
quote