


Palo Alto Networks Stock Forecast: PANW Jumps 7% Toward $387.09 as the Growth Math Gets Harder
TradingKey - Palo Alto Networks (NASDAQ: PANW) traded with a bullish bias on Friday, gaining about 7.22% to $380.55 on October 23. It's premarket trading sits slightly down at around $378.61. Shares had slid from the low $420s earlier this month to about $347 before last week's rebound, and they remain about 12% below the 52-week high of $432.33.
The solid buying trend has momentum behind it. But Palo Alto's own guidance shows the growth rate is slowing down sharply over the next year as acquisition boosts are fading. The fiscal 1st-quarter report, which the company has not yet scheduled, is likely to be the next test of whether organic growth can carry the story.
What Is Behind the Rebound
Palo Alto is a founding partner in Anthropic's Critical Infrastructure Defense Program. This program focuses on AI-powered security for operational technology and government systems.
That said, analysts have also become more positive.
Wells Fargo raised its target to $525 from $475 with an Overweight rating. Citi also raised its target to $440 from $410 and maintained a Buy rating. But not everyone agrees: Phillip Securities cut the stock to Reduce, indicating a stretched valuation after the software surge.
Fiscal Q4 Beat, but the Stock Fell 9%
Fiscal Q4 revenue rose 34% to $3.41 billion, as compared to $3.35 billion expected. Adjusted EPS came in at $1.02 versus $0.98. On the platform front, Next-Generation Security ARR rose 63% to $9.10 billion, and nearly $1 billion of it was added in the quarter alone. In simple words, NGS ARR is the annual recurring revenue coming from its newer platform products. Remaining performance obligations also rose 34% to $21.2 billion. This is contracted revenue that hasn't been recognized yet.
XSIAM grew ARR 70% to more than $700 million. It's the company's AI-driven security operations platform. In addition to this, Chronosphere ARR passed $500 million, while Idira, the rebranded CyberArk business, posted pro forma fiscal 2026 revenue of $1.26 billion. Overall, Palo Alto added about 220 net new platformizations, a company record.
Even so, the stock fell about 9% the next day. BofA blamed "an unusually high bar for the quarter." On top of that, adjusted gross margin narrowed by about a point to 74.8%. The CFO also stated that cloud hosting costs will grow faster than revenue in fiscal 2027. On a GAAP basis, the company posted a net loss of $282 million.
Guidance Points to Slower Growth
For fiscal Q1, Palo Alto guided revenue in the range of $3.30 billion to $3.31 billion. That's above the $3.22 billion consensus. Adjusted EPS guidance stands at $0.96 to $0.98, against $0.93 expected. NGS ARR should reach $9.54 billion to $9.56 billion, which is still up 63%.
For the full fiscal 2027, revenue is guided at $14.10 billion to $14.20 billion, up 23% to 24%, with adjusted EPS of $4.16 to $4.19. However, NGS ARR growth is set to slow down to 22% to 23%, reaching $11.075 billion to $11.175 billion. RPO growth also eases to 19% to 20%. This slowdown comes as the boost from buying CyberArk and Chronosphere drops out of the year-over-year comparison.
Organic Growth Is the Real Test
Jefferies estimated that organic net new ARR growth accelerated to about 45% in Q4, from 17% in the quarter before. That's excluding about $270 million of acquired net new ARR. If that pace holds, the fiscal 2027 guide could prove conservative. Management also reaffirmed its 40% adjusted free cash flow margin target for fiscal 2028, along with a $20 billion NGS ARR goal for fiscal 2030.
Valuation Leaves Little Room for Error
According to Cantor Fitzgerald, Palo Alto trades at about 60 times fiscal 2027 estimated enterprise value to free cash flow. The peer average is just around 21 times. For context, enterprise value adds debt and subtracts cash from market value. Meanwhile, the average analyst target is about $400, which is roughly 5% above Friday's close.
Palo Alto Networks Technical Analysis: Daily Close Above $387.09 Could Open $408.20
Even with that premium, buyers have kept the uptrend alive on the daily chart. Last week, they defended the rising trendline along with the moving average near $339.48. The trendline is simply a line drawn under the stock's higher lows. That rebound has now lifted PANW back above $357.99 and the second moving average at $367.07. So the bigger uptrend is still intact. Moving averages track the average price over a set period.
On the momentum side, RSI has climbed to about 52 and moved above its signal line. RSI is a momentum gauge that runs from 0 to 100. So momentum is turning positive, and there's plenty of room left before overbought levels above 70.
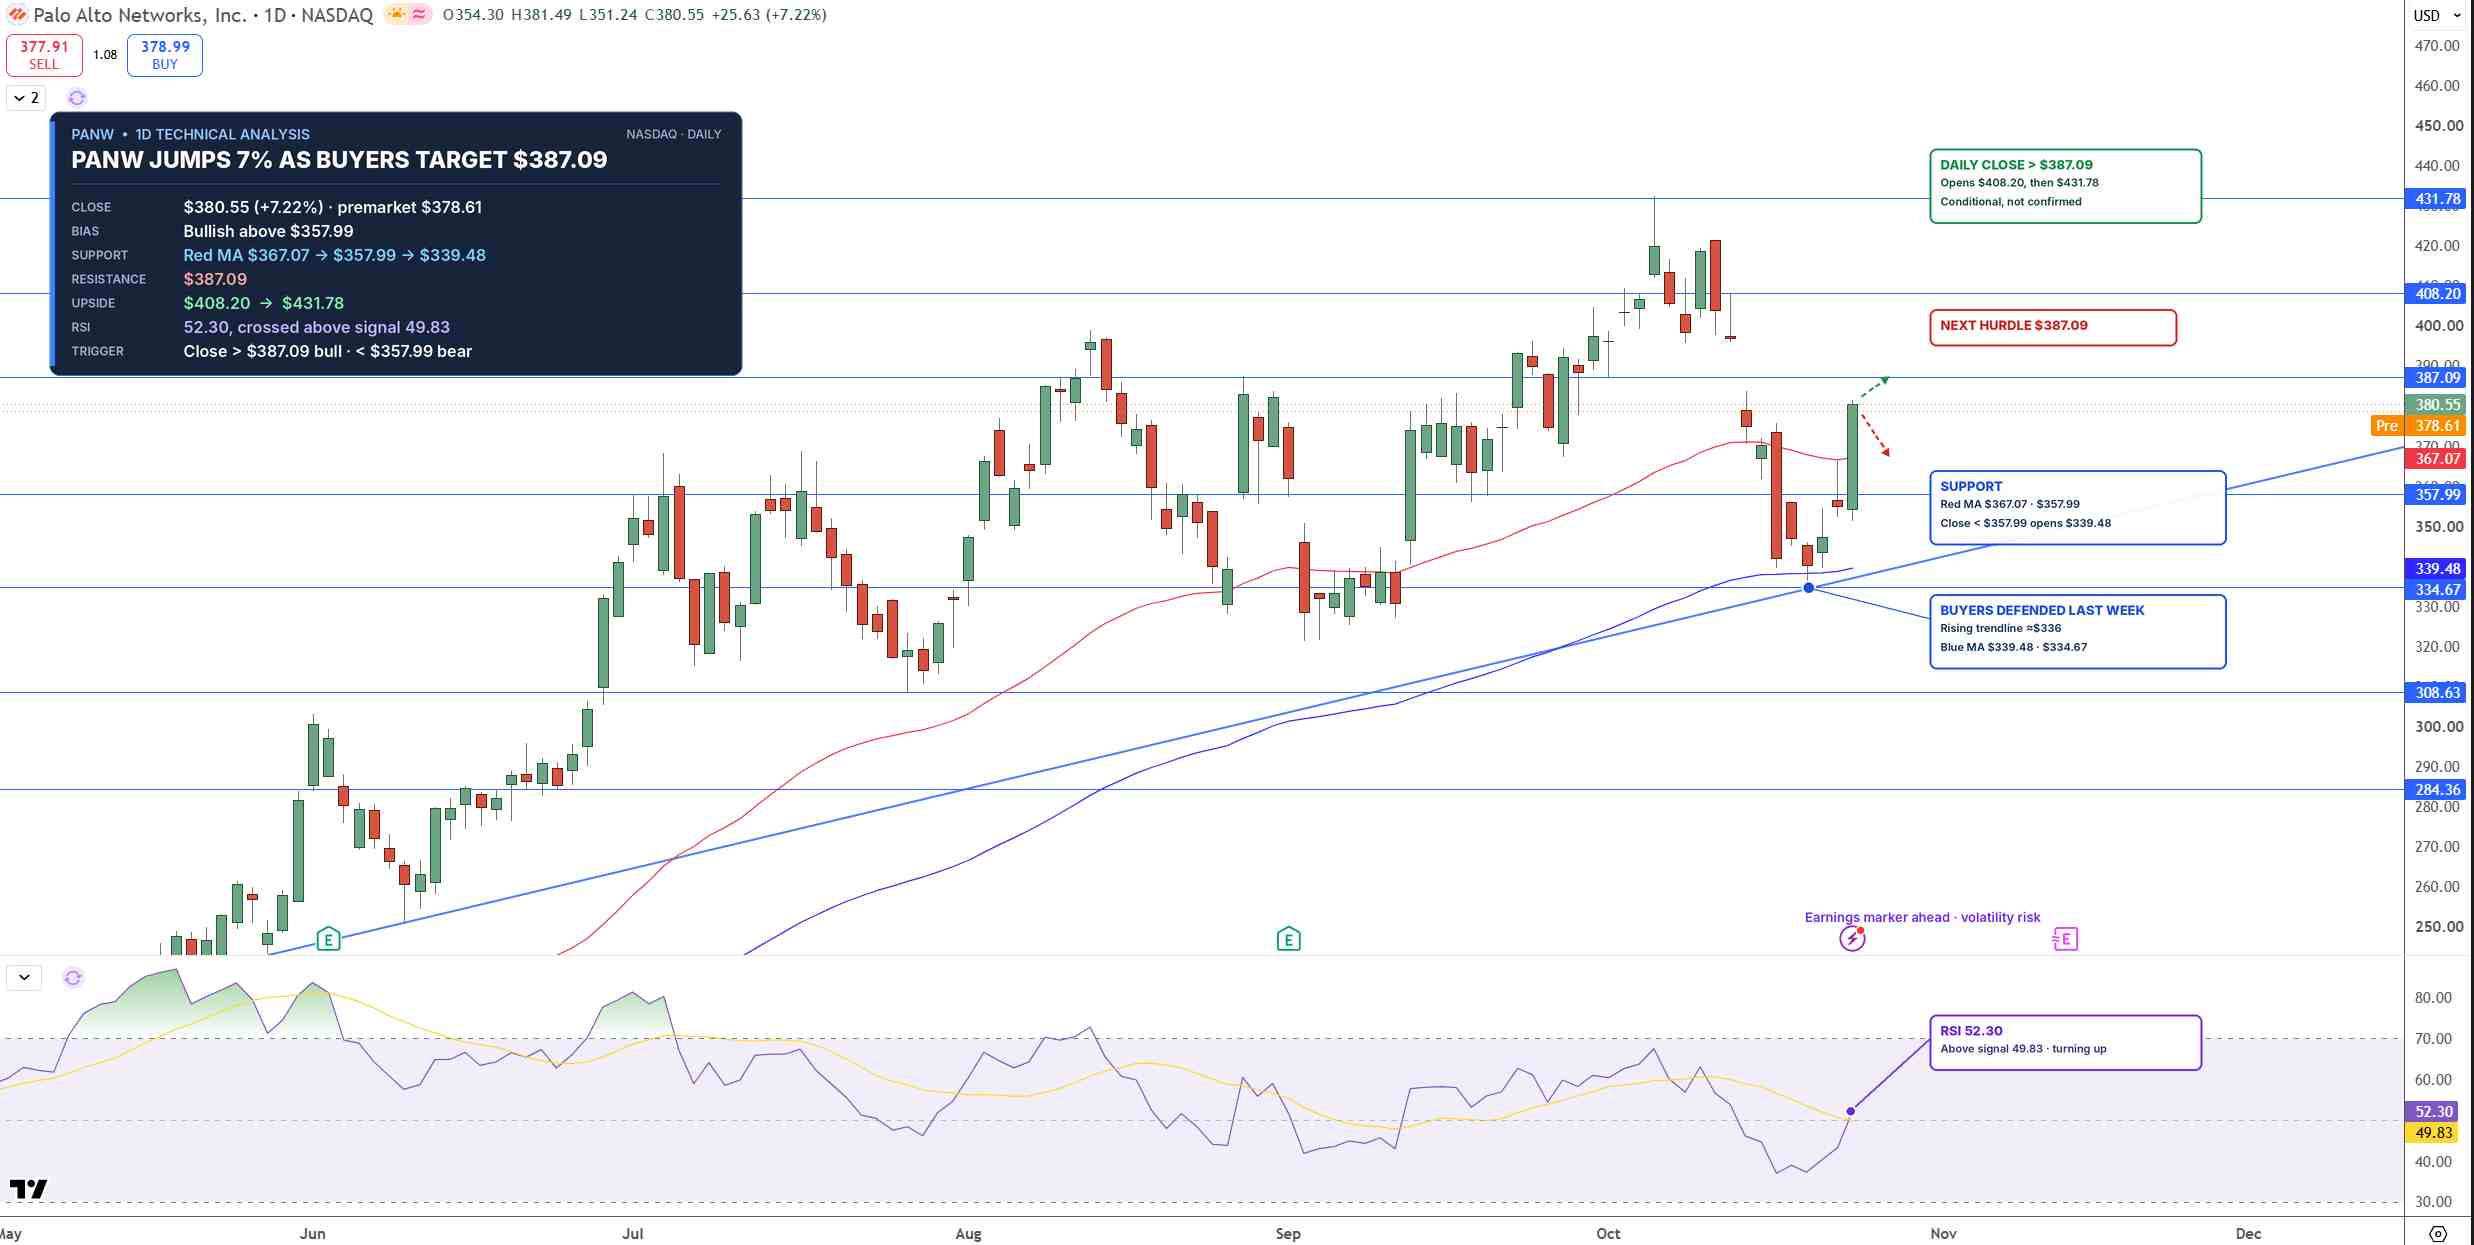
PANW Price Chart - Source: Tradingview
The next hurdle stands at $387.09. It's a resistance level where selling has capped rallies before. A daily close above it would open the way for $408.20, then $431.78, which sits just below the 52-week high. On the downside, $367.07 is the first support, where buyers would be expected to step in. After that comes $357.99. A close below $357.99 would send PANW back toward $339.48.
I lean bullish as long as PANW holds above $357.99.
Key Levels
- Last close: $380.55, up 7.22% on October 23
- Support: $367.07, $357.99, $339.48
- Resistance: $387.09, $408.20, $431.78
- RSI: 52.30, above its signal line
- Bullish trigger: Daily close above $387.09
- Bearish trigger: Daily close below $357.99
FAQs
Why did Palo Alto Networks stock rise 7% on October 23?
Palo Alto rose 7.22% to $380.55 after the recent target raises from Wells Fargo and Citi. Its role as a founding partner in Anthropic's Critical Infrastructure Defense Program also helped. Overall, the gain recovered much of its slide from earlier in the month.
What is the Palo Alto Networks stock forecast?
The bias stays bullish above $357.99. A daily close above $387.09 targets $408.20 and $431.78. On the other hand, a close below $357.99 opens $339.48.
Bottom Line
Palo Alto's rebound has the chart on its side. But its guidance shows NGS ARR growth falling from 63% to about 22% next year, and the stock still trades at a steep premium as compared to peers. The level that matters is $387.09. In my view, a daily close above it opens $408.20. On the flip side, a close below $357.99 would put the uptrend in doubt.
Recommended Articles


