


Cleveland-Cliffs Stock Forecast: $4 Billion 2027 EBITDA Target Sparks 16% Triangle Breakout
TradingKey - Cleveland-Cliffs (NYSE: CLF) soared 16.34% to close at $14.10 on Monday, October 19, after reporting its third quarter financial results. The results were released prior to market open. Trading volume was more than four times its average volume in the past three months.
The last quarter's results were indeed good, but they were not the only reason the stock gained momentum. The outlook was more impressive. The management changed the goal posts and raised their expectations of 2027 adjusted EBITDA to above $4 billion, which was also far ahead of the $2.54 billion analysts expected. The management also expects to make notable progress on the debt reduction in the fourth quarter.
Q3: Strongest Quarter in Three Years
Cleveland-Cliffs reported its best quarter in the past three years, with Q3 adjusted EBITDA of $612 million, which was double the second quarter's adjusted EBITDA of $286 million. The company also beat Q3 estimates with adjusted EPS of $0.28 and reported revenue of $5.6 billion, which was a slight miss from estimates.
The company returned to profitability with a GAAP net income of $165 million, after reporting a $134 million loss in Q2. The average steel selling price was $1,177 per ton, a $53 increase from Q2 and $145 increase from the prior year. The company also reported total shipments of 4.2 million tons.
Guidance Is What Moved the Stock
Cliffs guided Q4 adjusted EBITDA to roughly $715 million, above the $684 million consensus, despite typical seasonal slowdowns and planned maintenance.
It expects its 2027 adjusted EBITDA to be above $4 billion, based on expected changes to its contracts and ongoing steel price forecasts. The target, which is above the roughly $2.54 billion consensus, is more than 55% higher, but the number is dependent on steel prices holding steady.
Trade Protection Is the Tailwind
CEO Lourenco Goncalves said imports remain well below historical averages and lead times are extended, making the trade outlook more favorable to the U.S. steel producers. Wells Fargo, which upgraded Cliffs to Overweight on October 6 and raised its price target to $14 from $12, said that this year steel prices increased from about $900 to about $1,300 per ton.
Cliffs is a high-cost, high-leverage producer. Large swings in steel prices directly impact the bottom line, making the stock price volatile.
Debt Reduction Is the Next Test
Balance sheets are more important to me. Long-term debt was $7.65 billion at the end of Q3, up from $7.25 billion at the end of 2025. Operating cash flow was $224 million and capex was $152 million, resulting in free cash flow of approximately $72 million. Liquidity was $3.2 billion.
Management believes there will be significant debt reduction in Q4 as a result of improved cash flow and the sale of properties, and maintains its guidance to achieve net leverage of below 2.5 times EBITDA by mid-2027. If the debt reduction in Q4 does not meet expectations, the stock could decline significantly.
Stelco and Automotive Exposure
Stelco, the Canadian steelmaker that Cliffs acquired two years ago, reported its best quarterly results since the acquisition and achieved EBITDA positivity. However, Cliffs idled Stelco’s galvanizing lines due to an oversupplied Canadian market, while maintaining production of hot rolled steel.
Automotive accounted for 28% of steelmaking revenues in Q3, which means Cliffs is exposed to the level of automotive production and consumer affordability.
Cleveland-Cliffs Technical Analysis: CLF Soars 16% in Triangle Breakout Above $13.23
On my daily chart, CLF closed at $14.10, a gain of 16.34% from its previous close. CLF jumped out of the gate on Monday and cleared the upper bounds of a symmetrical triangle that had contained price since the June high at $15.04. The move also broke above horizontal resistance at $13.23. A long lower shadow on the daily candlestick pattern suggests price was briefly pushed down to $12.94, which was near the broken upper boundary of the triangle. It was also a retest of the $13.23 resistance. Traders are aware of the retest and considered it valid. The stock is trading well above both its 50 and 200-day EMAs and is turning higher.
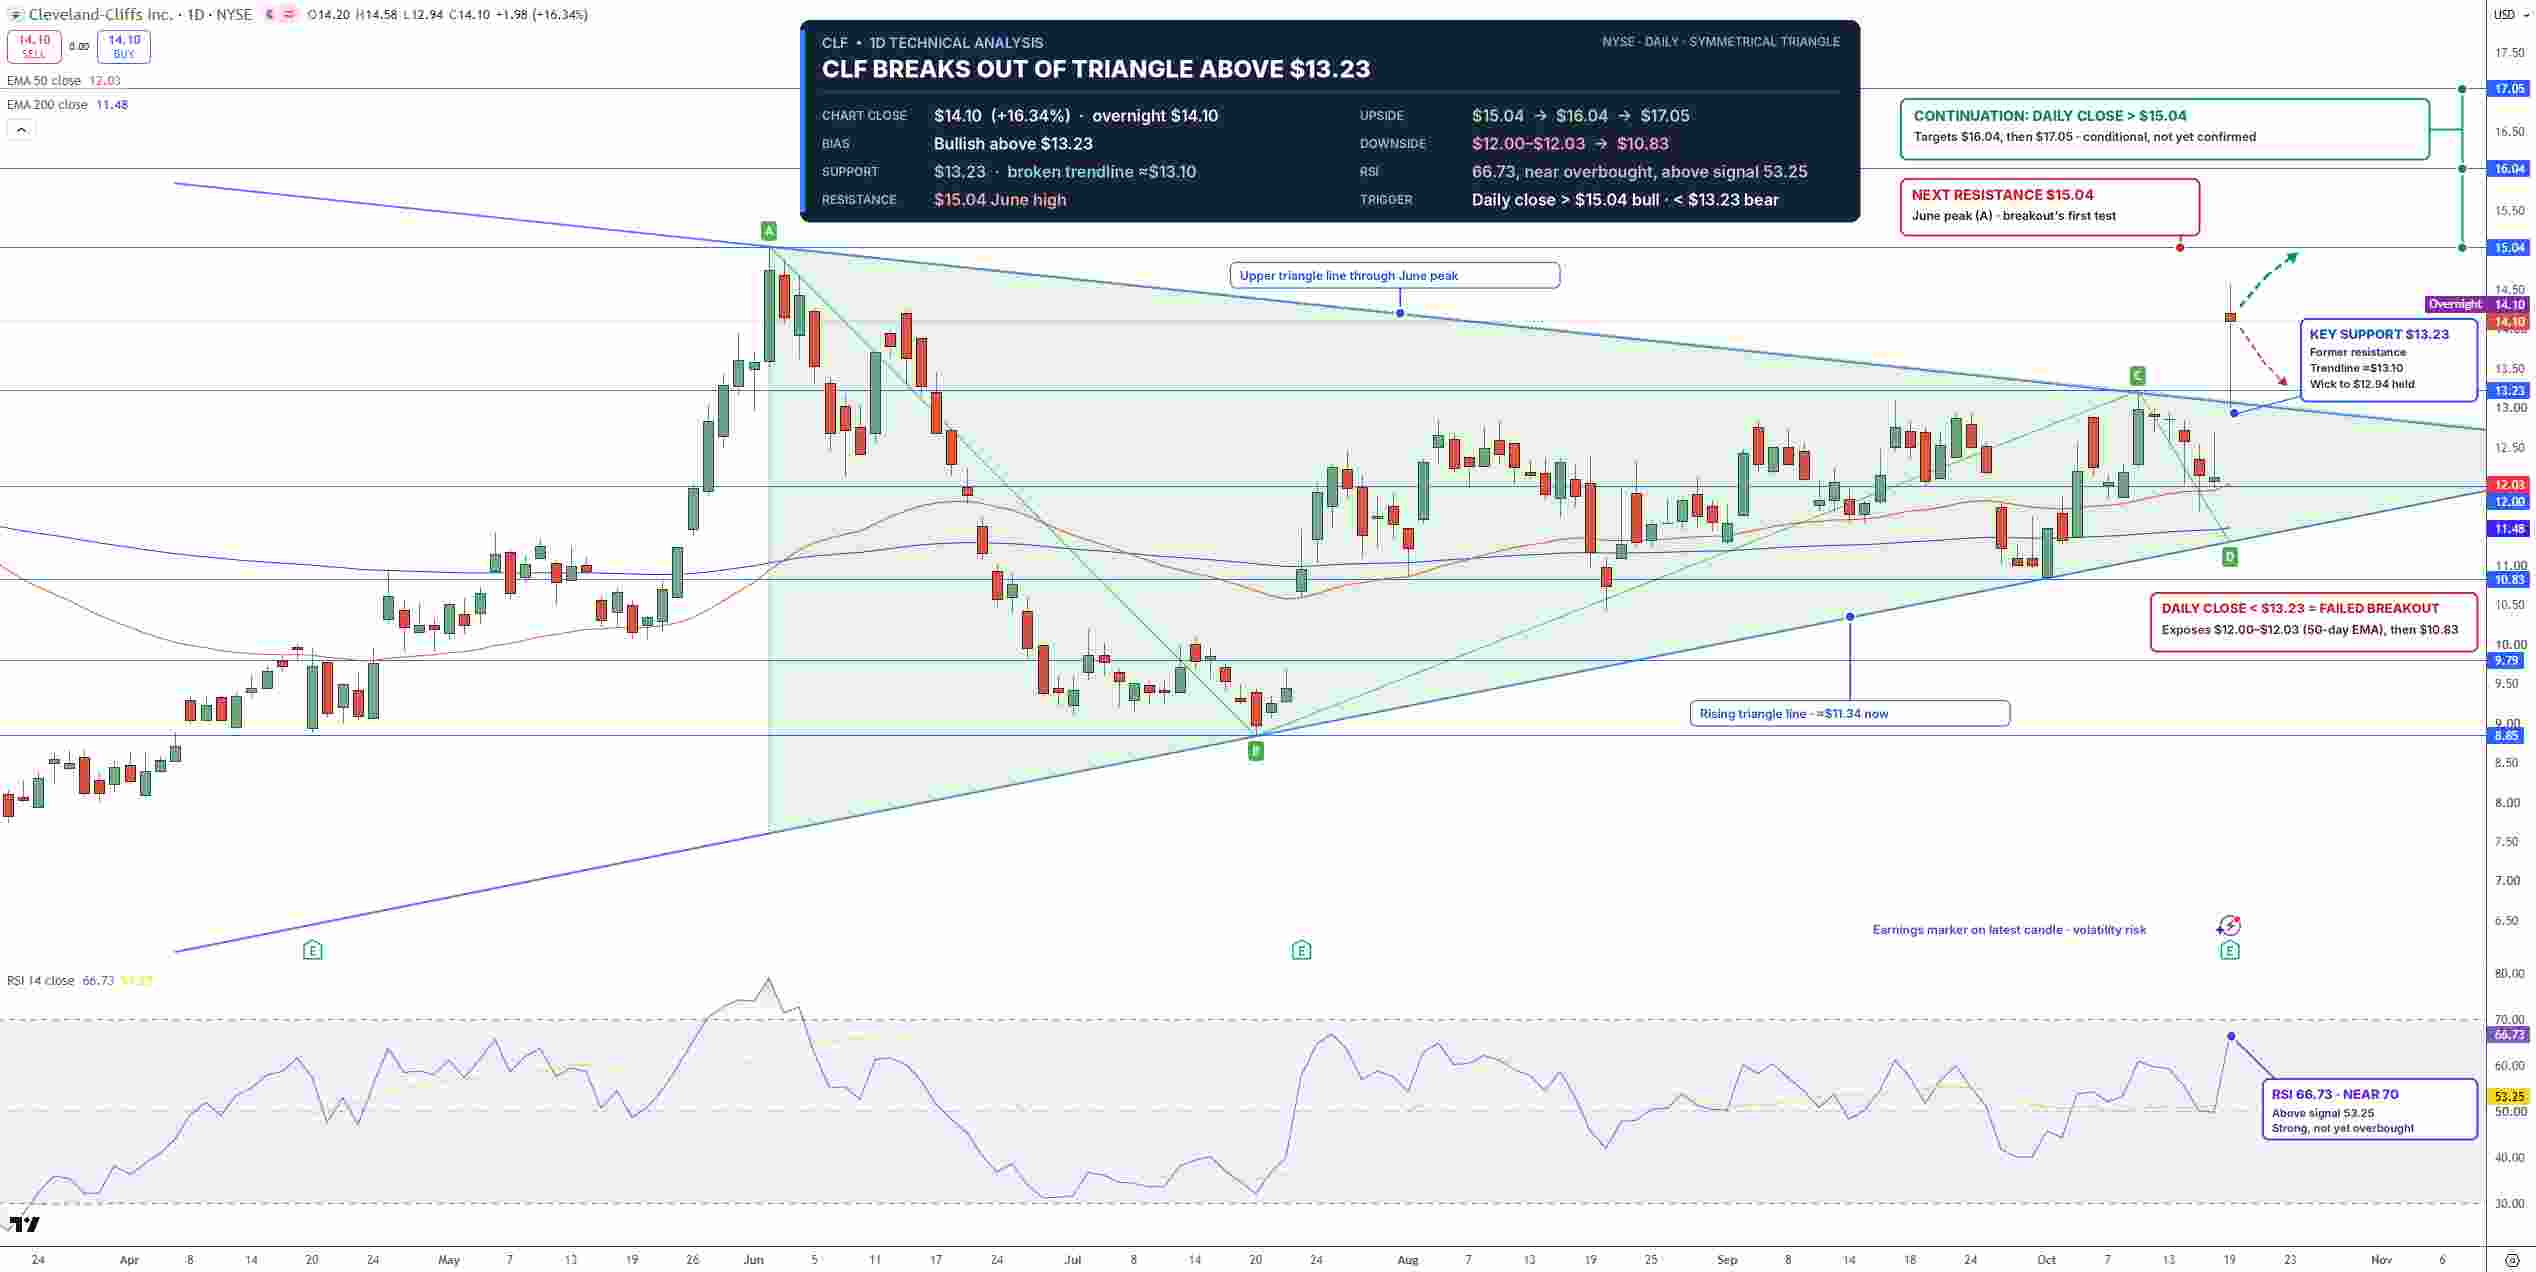
Cleveland-Cliffs Stock Price Chart - Source: Tradingview
The RSI is at 66.73, above its 53.25 signal line, and could easily rise further to the overbought territory. A move above the June high at $15.04 would extend the upside to $16.04 and $17.05. A close back below $13.23 would invalidate the breakout, and bring $12.00 and $12.03 into play, with additional support possible at $10.83. I am bullish as long as CLF trades above $13.23.
Key Levels
Last Close: $14.10, up 16.34% on October 19
Support: $13.23, $12.00 to $12.03, $10.83
Resistance: $15.04, $16.04, $17.05
RSI: 66.73, above its 53.25 signal line
Bullish trigger: Close above $15.04
Bearish trigger: Close below $13.23
FAQs
Why did Cleveland-Cliffs stock jump 16%?
Cleveland-Cliffs beat the estimates for Q3 earnings and guided its Q4 adjusted EBITDA to around $715 million. The company also predicted its 2027 adjusted EBITDA would be over $4 billion, far greater than the estimated $2.54 billion.
What is the Cleveland-Cliffs stock forecast after earnings?
The bias is bullish above $13.23. A close above $15.04 sets the next target at $16.04 and then $17.05. A close below $13.23 sets the next target at $12.03 and then $10.83.
Bottom Line
Even though Cleveland-Cliffs has reset its earnings outlook, the core of the story remains steel prices and debt reduction. The potential is a breakout move to the upside toward $16.04, if Cleveland-Cliffs accomplishes its debt reduction goal for Q4. Risks to this outlook include a pullback in steel prices, weaker global auto demand and slower debt reduction. A close above $15.04 strengthens my view, while a close below $13.23 invalidates my view.
Recommended Articles


