


Dollar Index drops on Iran deal report, steadies on denial
- DXY falls to its lowest since October 1, then recovers to near 101.70.
- Crude Oil drops on a Qatar-Pakistan plan, and cheaper energy lifts the Euro.
- Jobless claims Thursday and flash PMIs Friday come with Fed officials quiet.
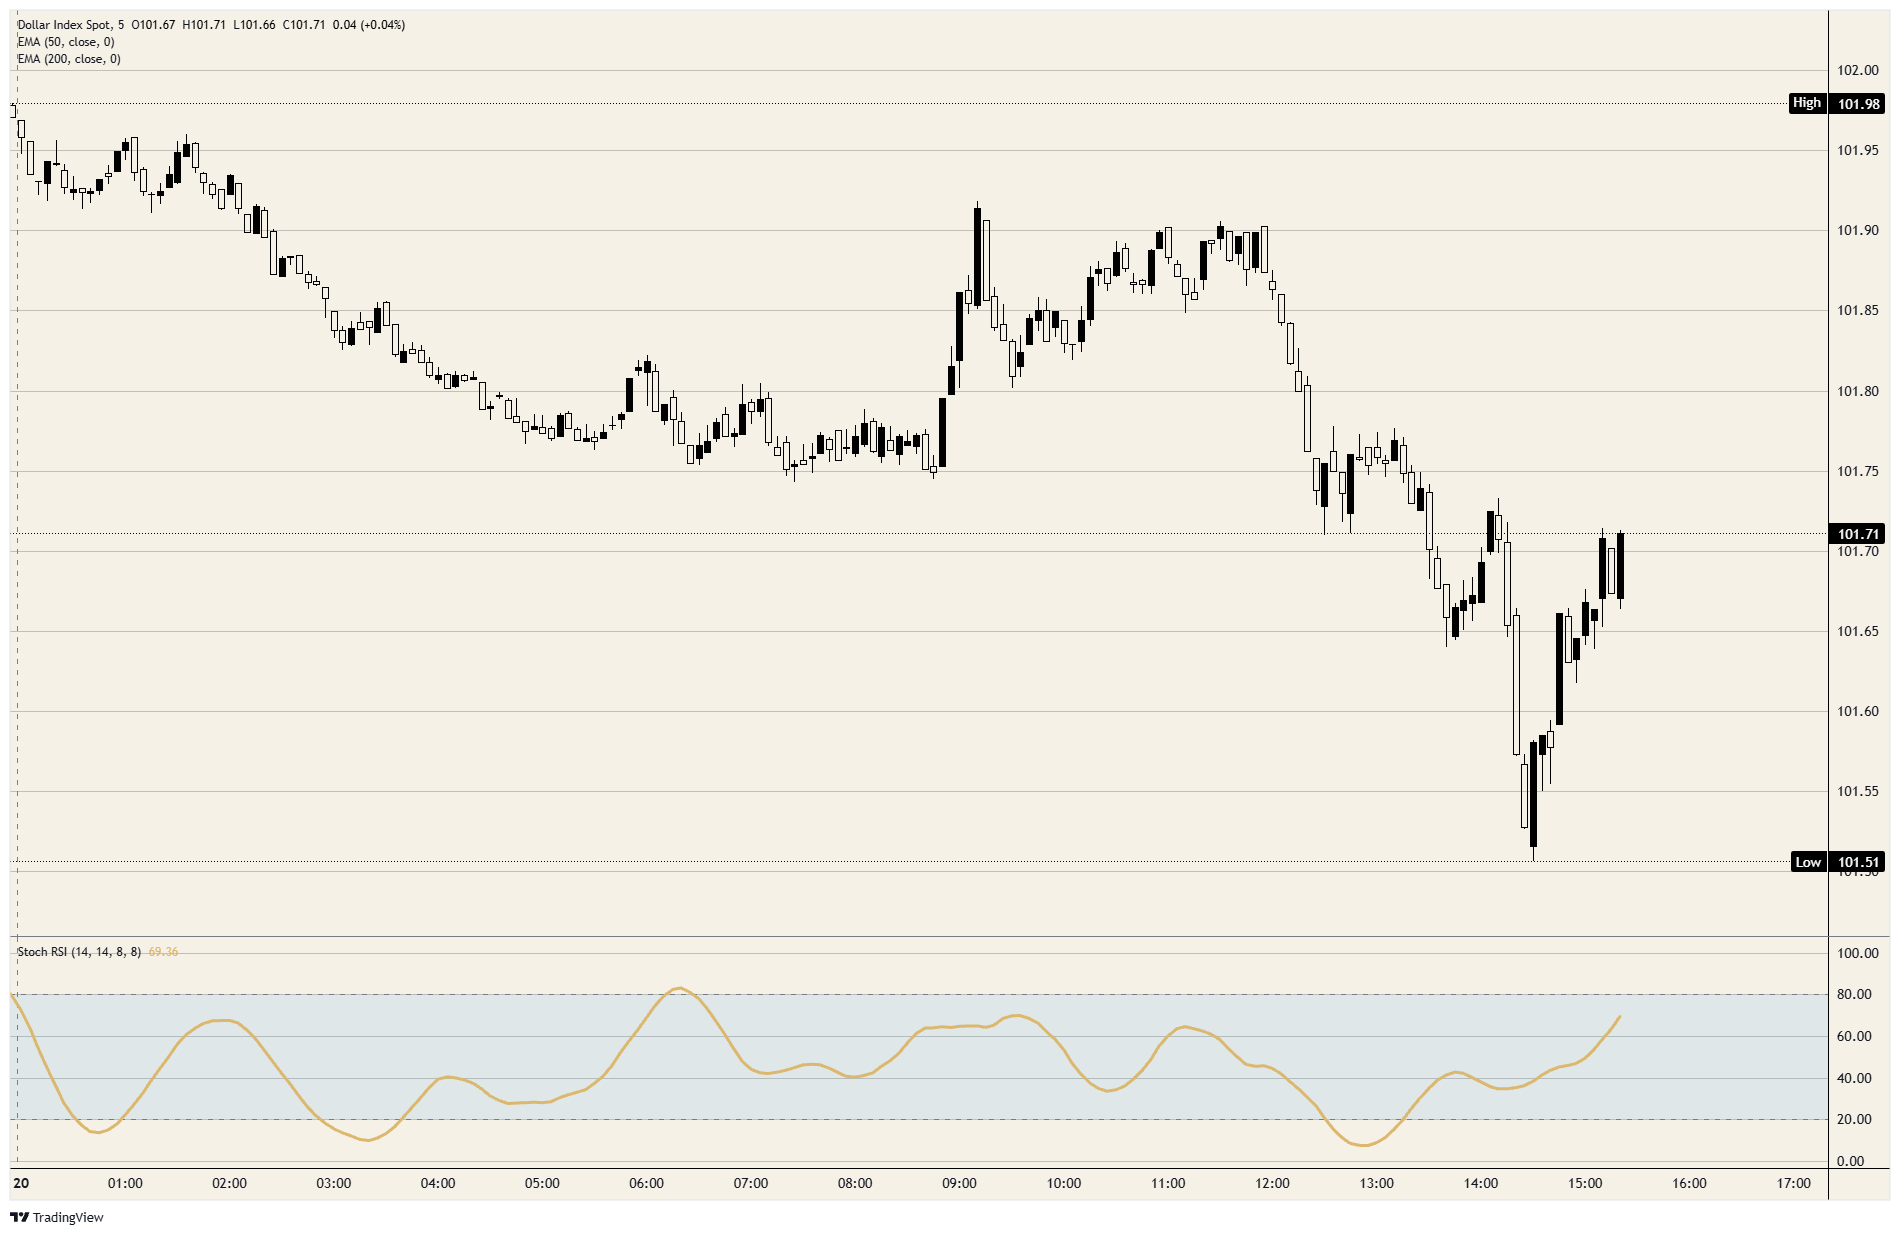
Reports that Washington and Tehran have both given preliminary approval to a Qatar and Pakistan compromise have pushed the Dollar Index to its lowest since October 1. It fell from near 101.75 to about 101.65 on the first report and to just above 101.50 once Israel's Channel 12 added the terms. It's back near 101.70 after a diplomat in the talks said reports that a deal is close are wrong.
Crude Oil fell on the reports, and the Euro, more than half the index by weight, rose as energy got cheaper. Treasury Secretary Bessent blamed higher US rates on the energy shock, so a deal that ends it could mean lower US rates and a weaker Dollar.
Housing starts fell to 1.221 million in September against a 1.3 million forecast, and pending home sales dropped 7.3% to a record low against a forecast fall of 0.5%. Weak housing is an argument against more Fed hikes, and the index rose on both release bars.
On the calendar
Fed officials are in their quiet period ahead of the October 27-28 Federal Open Market Committee (FOMC) meeting, so there's no Fed commentary before the decision on October 28. In a poll of 100 economists, 94 expect a hold at 3.75%-4.00% in October and all 100 expect a December hike.
Initial jobless claims follow at 12:30 GMT on Thursday, and S&P Global's flash Purchasing Managers Index (PMI) readings for October at 13:45 GMT on Friday. Both feed the case for a hike on October 28 instead of December, which 6 of the 100 economists expect.
On the charts
At the low, the index had given back about a third of its climb from the September 9 low near 98.60 to the October 14 high just under 103.00. The session low is also under Friday's dip near 101.60, and the 50-day Exponential Moving Average (EMA) is just under 101.00, about three-quarters of a point below.
DXY 5-minute chart
US Dollar FAQs
The US Dollar (USD) is the official currency of the United States of America, and the ‘de facto’ currency of a significant number of other countries where it is found in circulation alongside local notes. It is the most heavily traded currency in the world, accounting for over 88% of all global foreign exchange turnover, or an average of $6.6 trillion in transactions per day, according to data from 2022. Following the second world war, the USD took over from the British Pound as the world’s reserve currency. For most of its history, the US Dollar was backed by Gold, until the Bretton Woods Agreement in 1971 when the Gold Standard went away.
The most important single factor impacting on the value of the US Dollar is monetary policy, which is shaped by the Federal Reserve (Fed). The Fed has two mandates: to achieve price stability (control inflation) and foster full employment. Its primary tool to achieve these two goals is by adjusting interest rates. When prices are rising too quickly and inflation is above the Fed’s 2% target, the Fed will raise rates, which helps the USD value. When inflation falls below 2% or the Unemployment Rate is too high, the Fed may lower interest rates, which weighs on the Greenback.
In extreme situations, the Federal Reserve can also print more Dollars and enact quantitative easing (QE). QE is the process by which the Fed substantially increases the flow of credit in a stuck financial system. It is a non-standard policy measure used when credit has dried up because banks will not lend to each other (out of the fear of counterparty default). It is a last resort when simply lowering interest rates is unlikely to achieve the necessary result. It was the Fed’s weapon of choice to combat the credit crunch that occurred during the Great Financial Crisis in 2008. It involves the Fed printing more Dollars and using them to buy US government bonds predominantly from financial institutions. QE usually leads to a weaker US Dollar.
Quantitative tightening (QT) is the reverse process whereby the Federal Reserve stops buying bonds from financial institutions and does not reinvest the principal from the bonds it holds maturing in new purchases. It is usually positive for the US Dollar.
Recommended Articles


