


General Motors Stock Forecast: GM Coils Below $85.23 as Q3 Earnings Test a Third Guidance Raise
TradingKey - General Motors (NYSE: GM) dropped 1.44% to close at $82.75 on Monday, October 19, after hitting the top of its trading range. GM will release its Q3 results on Tuesday, October 20, before the market opens. The result is expected around 6:30 a.m. ET, and this report has been written prior to the release.
My assumption is that in 2026, trucks will continue to drive earnings while EVs will shrink even faster. The stock is up less than 2% for the year despite two positive guidance revisions. The main thing to watch today is if the company raises guidance again, and sets the tone for 2027.
What the Street Expects
The Street expects GM to report EPS of roughly $3.57 to $3.63 for the third quarter of 2026. Revenues are expected to be around $48.5 billion. EBIT-adjusted for the quarter is expected to be around $4.02 billion.
GM beat consensus estimates for the second quarter of 2026, reporting EPS of $3.57. North American EBIT-adjusted margin also returned to its 8% to 10% target range. In the second quarter of 2026, it increased to 8.6% from 6.1% in the same quarter of 2025.
The Bar Set by Current Guidance
In July, GM bumped its 2026 expectations for the second time. The new range is EBIT-adjusted between $14-$16 billion, EPS between $12-$14, and automotive free cash flow between $9.5-$11.5 billion.
As an investor, I've become accustomed to beat expectations. So, I treat simple reaffirmations as low-ball expectations. And I expect GM to raise expectations by at least $2.0 billion on the top line and $3.5 billion on the bottom line again.
Q3 Sales: EVs Collapsed, Trucks Held Up
GM's Q3 sales in the U.S. fell 5.5% to 670,974 units. EV sales fell 62% to about 25,500 units, dropping EVs to under 4% of total sales. The Equinox EV alone fell 92.4%.
But focusing on the non-EV numbers shows sales rose by about 0.3%. Sales of light-duty pickups rose 9.3%. The Silverado light-duty rose 13.3% to 100,221 units, while sales of the heavy-duty Silverado fell 10.1%. The margins of pickups, which are also profitable, likely rose with fewer EVs, as each Equinox EV lost about $20,000.
Tariffs and EV Charges
Tariff relief has been a major tailwind. The Supreme Court's decision to remove the tariffs under the International Emergency Economic Powers Act allowed GM to lower its 2026 tariff estimate to $2.5-$3.5 billion. It has also changed its supply chain to limit its exposure.
The Q2 realignment charges for EVs totaled $2.3 billion. Any new charges this morning would be a negative surprise for investors.
The Real Risk: 2027 Tone and the Consumer
J.P. Morgan Lowered Its Price Target to $110 From $120 on October 12, Leaving an Overweight Rating. Ally Financial Also Reports Earnings This Morning. Its results Will Provide a Look at How the U.S. Consumer is Coping With Higher Prices and Financing Costs.
Mary Barra, GM CEO said on October 12, that the stock is undervalued. Dan Ives at Yorkville says the Street has been too pessimistic on GM and has a $100 target price, and believes the core business of GM will be the cash flow machine and fund the software and autonomy initiatives.
General Motors Technical Analysis: GM Rejected at $85.23 Triangle Resistance, Slips Below 50-Day EMA
GM closed yesterday at $82.75, a 1.44% loss from the previous close, and is currently trading at $82.71. GM is locked in a symmetrical triangle since July. The lower trendline of the triangle is supported by the lows of May. Resistance is at $85.23. Price was recently rejected by the $85.23 supply zone. A break below the 50-day EMA at $83.03 is bearish. The 200-day EMA at $78.73 is still trending up and is supportive of the longer-term trend.
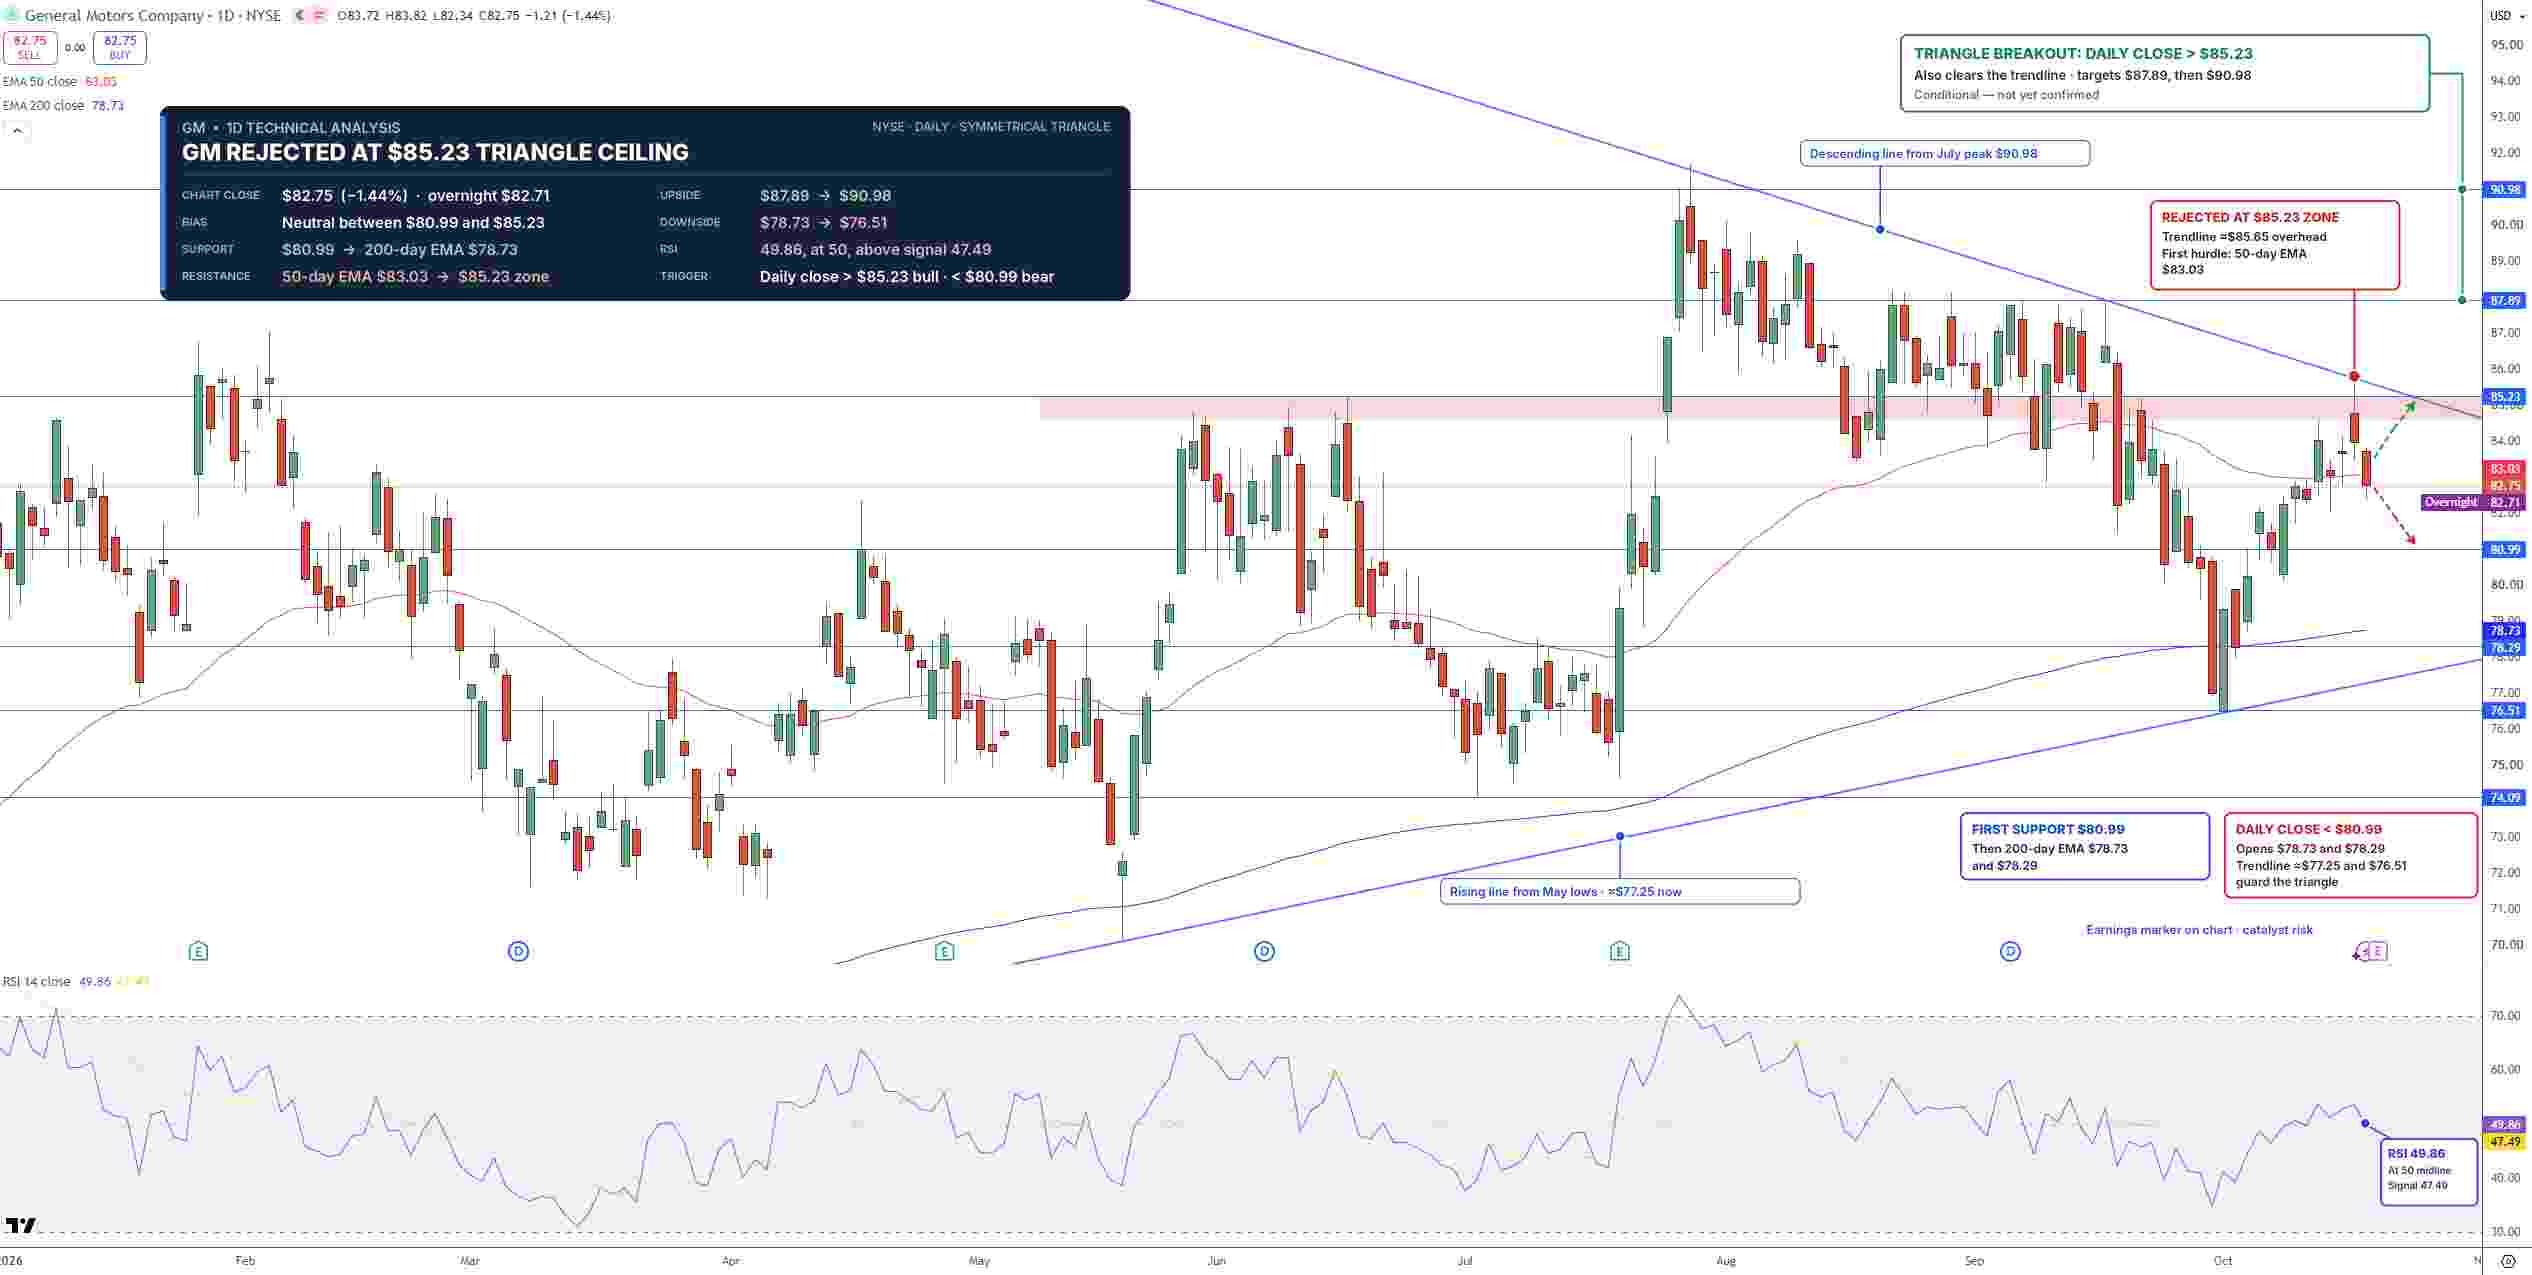
General Motors Price Chart - Source: Tradingview
The relative strength index (RSI) is currently at 49.86 and is above its 47.49 signal line and the 50 midline. Neutral momentum could mean that the market is consolidating prior to a significant move.
A daily close above 85.23 would confirm a break of the symmetrical triangle and target 87.89 and 90.98. First support is at 80.99. A daily close below 80.99 would open 78.73 and 78.29, with 77.80 and 76.51 capping the triangle. I am cautiously neutral between 80.99 and 85.23, with the outcome of today’s trading likely deciding the break.
Key Levels
Last close: 82.75, down 1.44% on October 19
Support: 80.99, 78.73, 78.29, 76.51
Resistance: 83.03, 85.23, 87.89, 90.98
RSI: 49, above its 47.49 signal line
Bullish trigger: Close above 85.23
Bearish trigger: Close below 80.99
FAQs
What does Wall Street expect from GM's Q3 2026 earnings?
Generally speaking, analysts are looking for GM to report adjusted EPS in the ballpark of $3.57 to $3.63 on revenue around $48.5 billion. That said, the real focus will be on whether the company raises its existing $12 to $14 EPS guidance for the year.
What is the GM stock forecast after earnings?
Between $80.99 and $85.23, the bias is neutral. Above $85.23, the target becomes $87.89, with the next resistance level at $90.98. Below $80.99, the target becomes $78.73, with the next support level at $76.51.
Bottom Line
GM will report earnings with strong quarterly profits from its truck division, reduced effects from tariffs, and a stock price that has barely moved this year. The opportunity is a potential breakout towards $87.89 if management provides positive guidance. The potential risks are an unchanged outlook, cautious 2027 guidance and further announcement of EV plans. I would become bullish if the stock closed above $85.23 and bearish if the stock closed below $80.99.
Recommended Articles


