


Warren Buffett Is Issuing a Stark Warning About the Stock Market. Here's What History Says Comes Next.
Key Points
The market has been shaky this week after a record-breaking year.
Volatility within the tech sector has some investors worried about the future of AI stocks.
History has both a warning and a silver lining for investors.
- 10 stocks we like better than S&P 500 Index ›
This year has been one for the record books, with the S&P 500 (SNPINDEX: ^GSPC), Nasdaq Composite (NASDAQINDEX: ^IXIC), and Dow Jones Industrial Average (DJINDICES: ^DJI) all reaching multiple all-time highs.
But what goes up must come down eventually. Bond yields are at their highest levels in decades, raising borrowing costs for consumers and making debt more expensive for companies spending billions of dollars on the AI build-out. Concerns about AI debt have shaken the market recently, with the tech-heavy Nasdaq experiencing its worst week in months.
Missed Nvidia in 2009? This Rare Signal Is Flashing Again. In 2009, a "Double Down" signal flashed for a little-known chipmaker called Nvidia. For the first time in years, that same "Total Conviction" signal is flashing for a company 1/100th the size of Nvidia. Continue »
While nobody can say for certain what will happen in the near term, Warren Buffett issued a warning earlier this year about this historically expensive market -- and history suggests he's right.
Image source: Getty Images.
Buffett warns investors may be gambling right now
In a CNBC interview earlier this year, Buffett was asked how investors should navigate these historically high stock prices. He warned that some investors are getting too comfortable with unsafe investments and risk overpaying for stocks.
"I've compared the markets to a church with a casino attached, [and] the casino has gotten very attractive to people," he warned. "So we've never had people in a more gambling mood than now."
He went on to add, however, that "that doesn't mean that investing is terrible. It does mean that prices for an awful lot of things will look very silly."
Many stocks are currently at record high prices. While that's not inherently a bad thing, some stocks are being fueled primarily by hype and speculation rather than fundamentals. These stocks can sometimes perform well in the short term, but they carry far more risk than companies built on solid foundations.
What history says is coming next
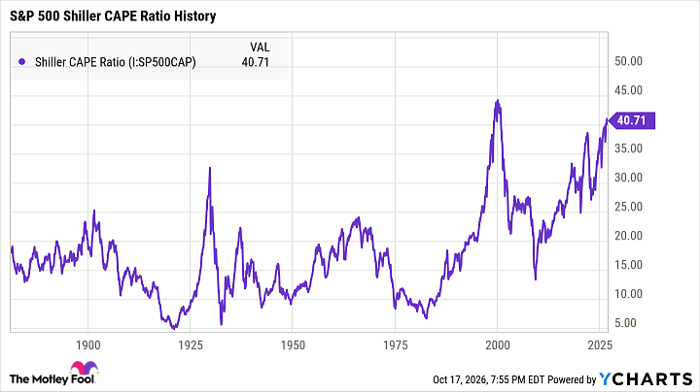
The stock market will always be unpredictable to a degree, but one market indicator with a strong track record of calling previous downturns is the S&P 500 Shiller Cyclically Adjusted Price-to-Earnings (CAPE) Ratio.
This metric tracks the S&P 500's long-term valuation using the index's 10-year inflation-adjusted earnings. The higher the ratio climbs, the more likely that the market is overvalued. The CAPE Ratio also has an inverse relationship with stock prices, as higher metrics tend to be followed by lower prices.
The last time this ratio surged was in late 2021, when it peaked at 38 just before stocks fell into a bear market that would last most of the following year. But it also spiked sharply in 1929 (ahead of the Great Depression) and 1999 (during the dot-com bubble).
Shiller CAPE Ratio data by YCharts
Currently, the ratio is above 40 and has held above that benchmark since May of this year. That's historically significant, because the only other time this metric has stayed above 40 for months at a time was during the dot-com bubble. It surpassed 40 in January 1999, peaked at around 44 in December, and the bear market officially began in March 2000.
To be clear, 40 isn't some magical threshold that automatically triggers bear markets. Also, no market metric can predict when a downturn will begin. But it's unusual for the market to be this richly valued, and it suggests that many stocks are trading at a premium right now.
What should investors do right now?
The single best move investors can make right now is to ensure they're buying quality stocks with solid fundamentals. Then, prepare to hold those stocks for at least a few years.
Some stocks are overvalued right now, and those investments have the most to lose during a bear market. When the dot-com bubble popped, for instance, many high-flying tech stocks that were breaking records in the 1990s crashed hard and never recovered.
As Buffett said, though, not all investing is terrible. The best investments aren't always the flashy stocks making headlines. Sometimes they're the hidden gems in overlooked industries. While even the healthiest stocks can take a hit during a market downturn, they're more likely to recover over time.
Should you buy stock in S&P 500 Index right now?
Before you buy stock in S&P 500 Index, consider this:
The Motley Fool Stock Advisor analyst team just identified what they believe are the 10 best stocks for investors to buy now… and S&P 500 Index wasn’t one of them. The 10 stocks that made the cut could produce monster returns in the coming years.
Consider when Netflix made this list on December 17, 2004... if you invested $1,000 at the time of our recommendation, you’d have $380,363!* Or when Nvidia made this list on April 15, 2005... if you invested $1,000 at the time of our recommendation, you’d have $1,315,732!*
Now, it’s worth noting Stock Advisor’s total average return is 919% — a market-crushing outperformance compared to 211% for the S&P 500. Don't miss the latest top 10 list, available with Stock Advisor, and join an investing community built by individual investors for individual investors.
See the 10 stocks »
*Stock Advisor returns as of October 20, 2026.
Recommended Articles


