


SpaceX Stock Price Forecast: Stages V-Shaped Reversal After IPO, Can It Rise to $1,000 by 2027?
SpaceX 2026 Performance Review
TradingKey - SpaceX (SPCX) wrote one of the most thrilling chapters in the history of global capital markets and commercial aerospace in 2026. Since officially listing on Nasdaq in June through the largest IPO in history, its stock price has gone through a complete swing cycle, featuring a frenzied surge to record highs, a deep shakeout, and an explosive V-shaped reversal.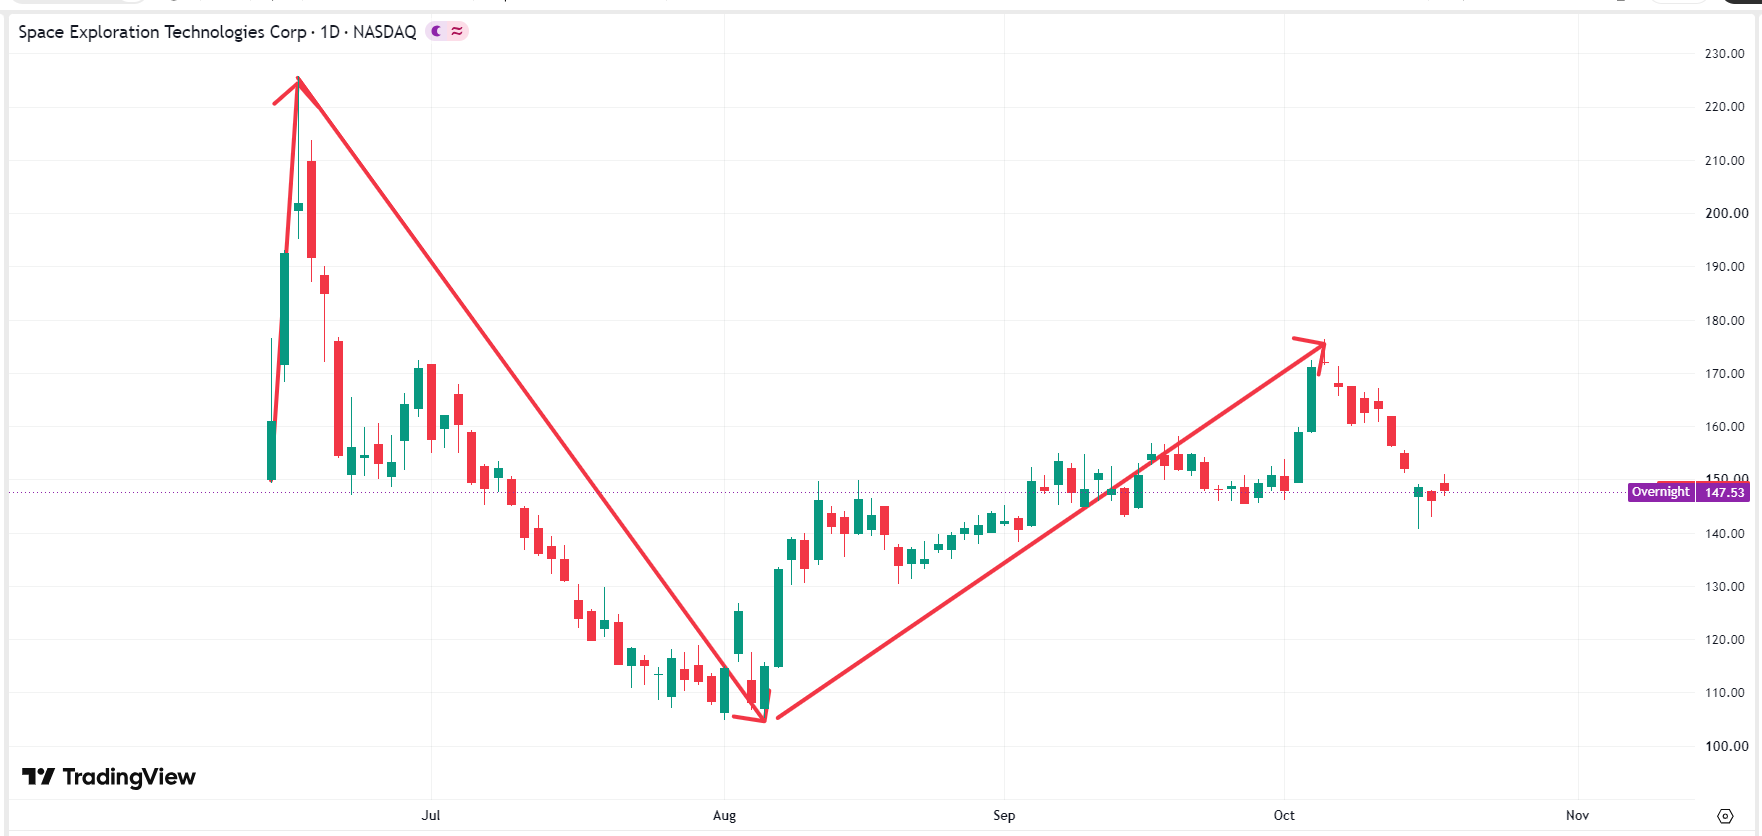 SpaceX stock price chart, Source: TradingView
On June 12, SpaceX officially listed on Nasdaq with an IPO price set at $135 per share, raising as much as $75 billion at a valuation of $1.75 trillion in one go, surpassing Saudi Aramco to become the largest IPO in global history. Following its listing, SpaceX's stock price surged over 67% in just a few days, touching an all-time high of $225.64 in late June, with its total market capitalization briefly breaching the $2.8 trillion mark.
From July to early August 2026, SpaceX's stock price continued to decline, bottoming out at an interim low of $104.83 on August 3, expanding its maximum drawdown to 53%. From mid-August to early October 2026, SpaceX's stock price rebounded strongly, staging a V-shaped rally and returning to a high of $171.92 on October 6.
What Factors Affect SpaceX Stock Price Volatility?
Shortly after its listing, driven by explosive buying from retail investors and global institutions, SPCX's price-to-sales (P/S) ratio once climbed above 60x–70x. When U.S. September inflation data surged past expectations and drove up U.S. Treasury yields, coupled with concerns over European low Earth orbit (LEO) satellite competition, capital rapidly deleveraged and pulled out of high-valuation/high-beta sectors, causing SPCX to undergo a deep de-rating.
Boosted by major catalysts—including favorable earnings, a license application for 456 Starship launches per year at the Boca Chica base, Musk touting a forward valuation of $100 trillion, cross-domain technology integration for Roadster 2.0, and the announcement to gift one share of SPCX to every child in the U.S. next year—the stock completed a strong V-shaped reversal.
Will SpaceX Stock Continue to Rise?
Regarding whether SpaceX's share price can continue to rise, the consensus among mainstream Wall Street institutions and capital markets is that while the short term will feature a highly volatile breakout process, the medium and long term still possess substantial upside potential, with the average 12-month target price ranging from $180 to $220, implying an upside potential of approximately 20% to 45% relative to current levels.
Currently, SpaceX's stock price is hovering near $150. The key to whether it can strengthen further in the short term hinges on whether cash flow beats expectations in the Q3 financial results to be released on November 5. The market is focused on whether Starlink's high-margin operating cash flow can fully offset the massive capital expenditures (CapEx) for xAI computing infrastructure and Starship. If free cash flow (FCF) comes in better than expected, it will serve as a major catalyst for the stock to break through its first resistance zone of $170 this year.
Can SpaceX Reach $1,000 by 2027?
From the perspectives of fundamentals, lock-up expiration pressures, and technicals, the probability of SpaceX's stock price reaching $1,000 next year is extremely slim. Based on the current fully diluted total share count of approximately 13.3 billion shares, a stock price of $1,000 corresponds to a total market capitalization of as high as $13.3 trillion, exceeding the current combined market capitalization of Apple, Microsoft, and Nvidia, which far surpasses the upper limit of a reasonable fundamental valuation.
According to the IPO lock-up agreement, a large-scale lock-up expiration for institutional and founder shares will occur from late 2026 through June 2027, including the unlock of approximately 6.4 billion shares held by Musk and the core team in June 2027. Under such massive release of market liquidity and share supply, without an extreme, unexpectedly explosive surge in free cash flow, public market capital can hardly support the stock price multiplying several times during the lock-up period.
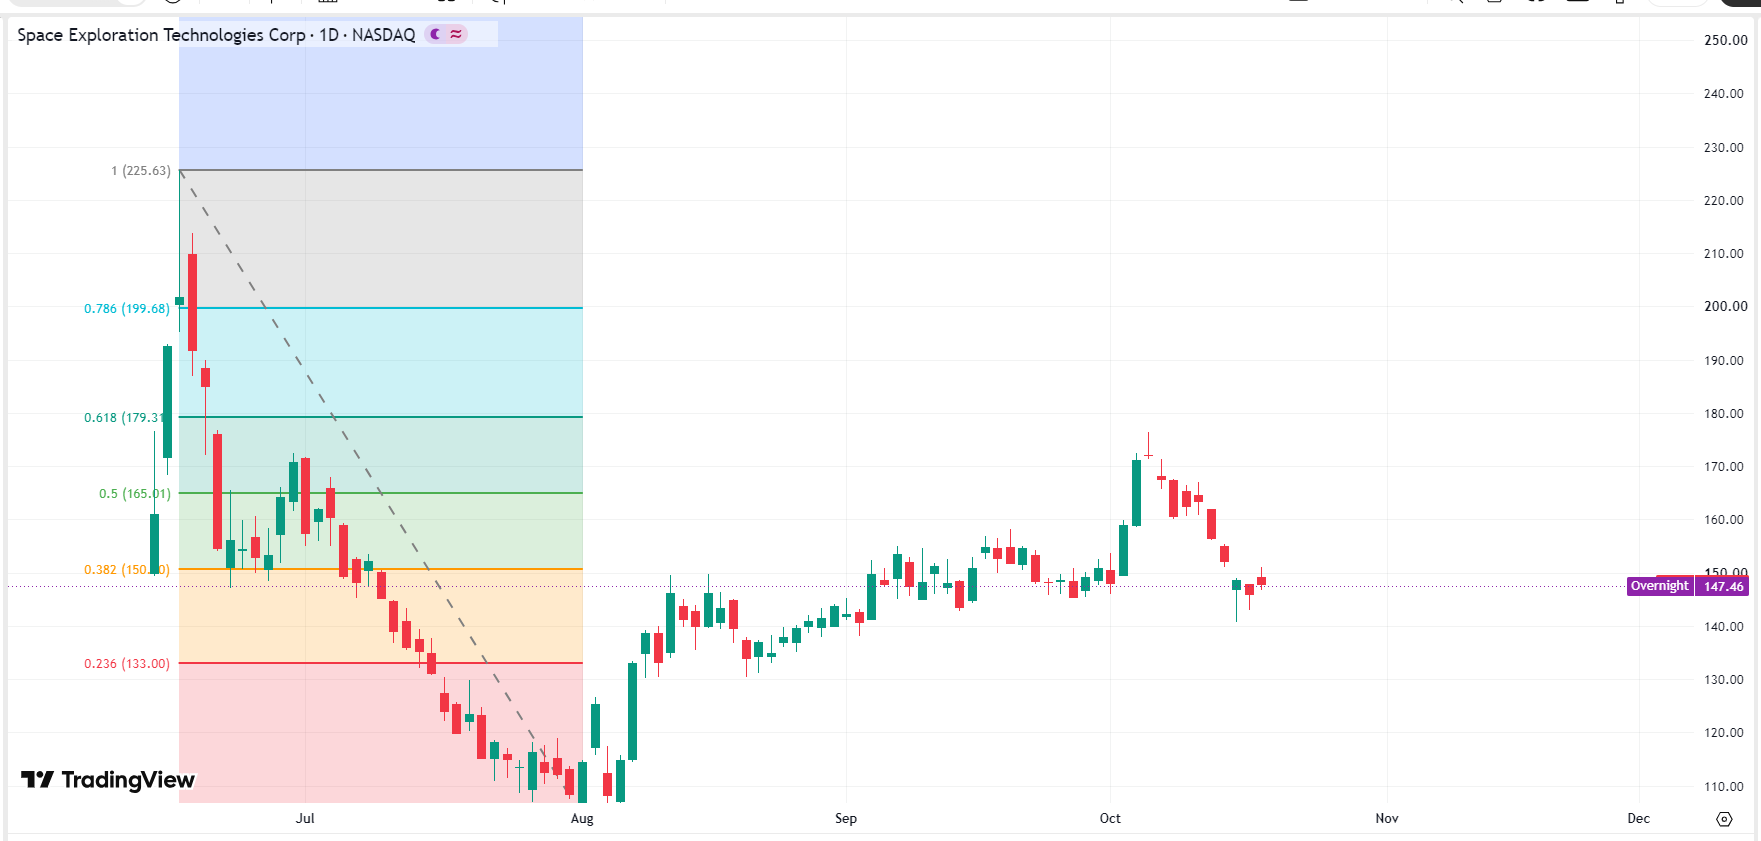
Plotting Fibonacci 1.618 and 2.618 extensions from the swing low of $104.83 to the previous high of $225.64 yields $300 and $420, respectively, with $300 aligning with the baseline target for the first quarter of 2027 predicted by mainstream Wall Street institutions and trading experts. From a technical chart perspective, $280–$350 represents the most attractive and strong resistance target zone technically in 2027, which remains a huge distance away from $1,000.
 SpaceX stock price chart, Source: TradingView
Recommended Articles


