


XRP Price Forecast: Momentum builds as bulls eye another breakout
- XRP remains in bullish hands, trading higher near $1.60 on Friday.
- US-listed spot XRP ETFs sustain inflows for three straight days, while futures Open Interest steadies, supporting a bullish outlook.
- XRP’s technical outlook remains constructive, with uptrending moving averages and momentum indicators.
Ripple (XRP) ticks up and trades near $1.60 on Friday, as bulls tighten their grip on the remittance token. This marks the second straight day of gains after XRP gave back some of the gains it accrued earlier this week. The short-term outlook is structurally solid, raising the odds of an extended breakout toward August highs of $1.70 and the key $2.00 hurdle.
XRP gains as ETF and derivatives demand steadies
Appetite for digital assets remains generally high, as reflected in the crypto Fear & Greed Index at 71 in Greed territory on Friday. This suggests investors are willing to take on more risk, expecting prices to keep rising.
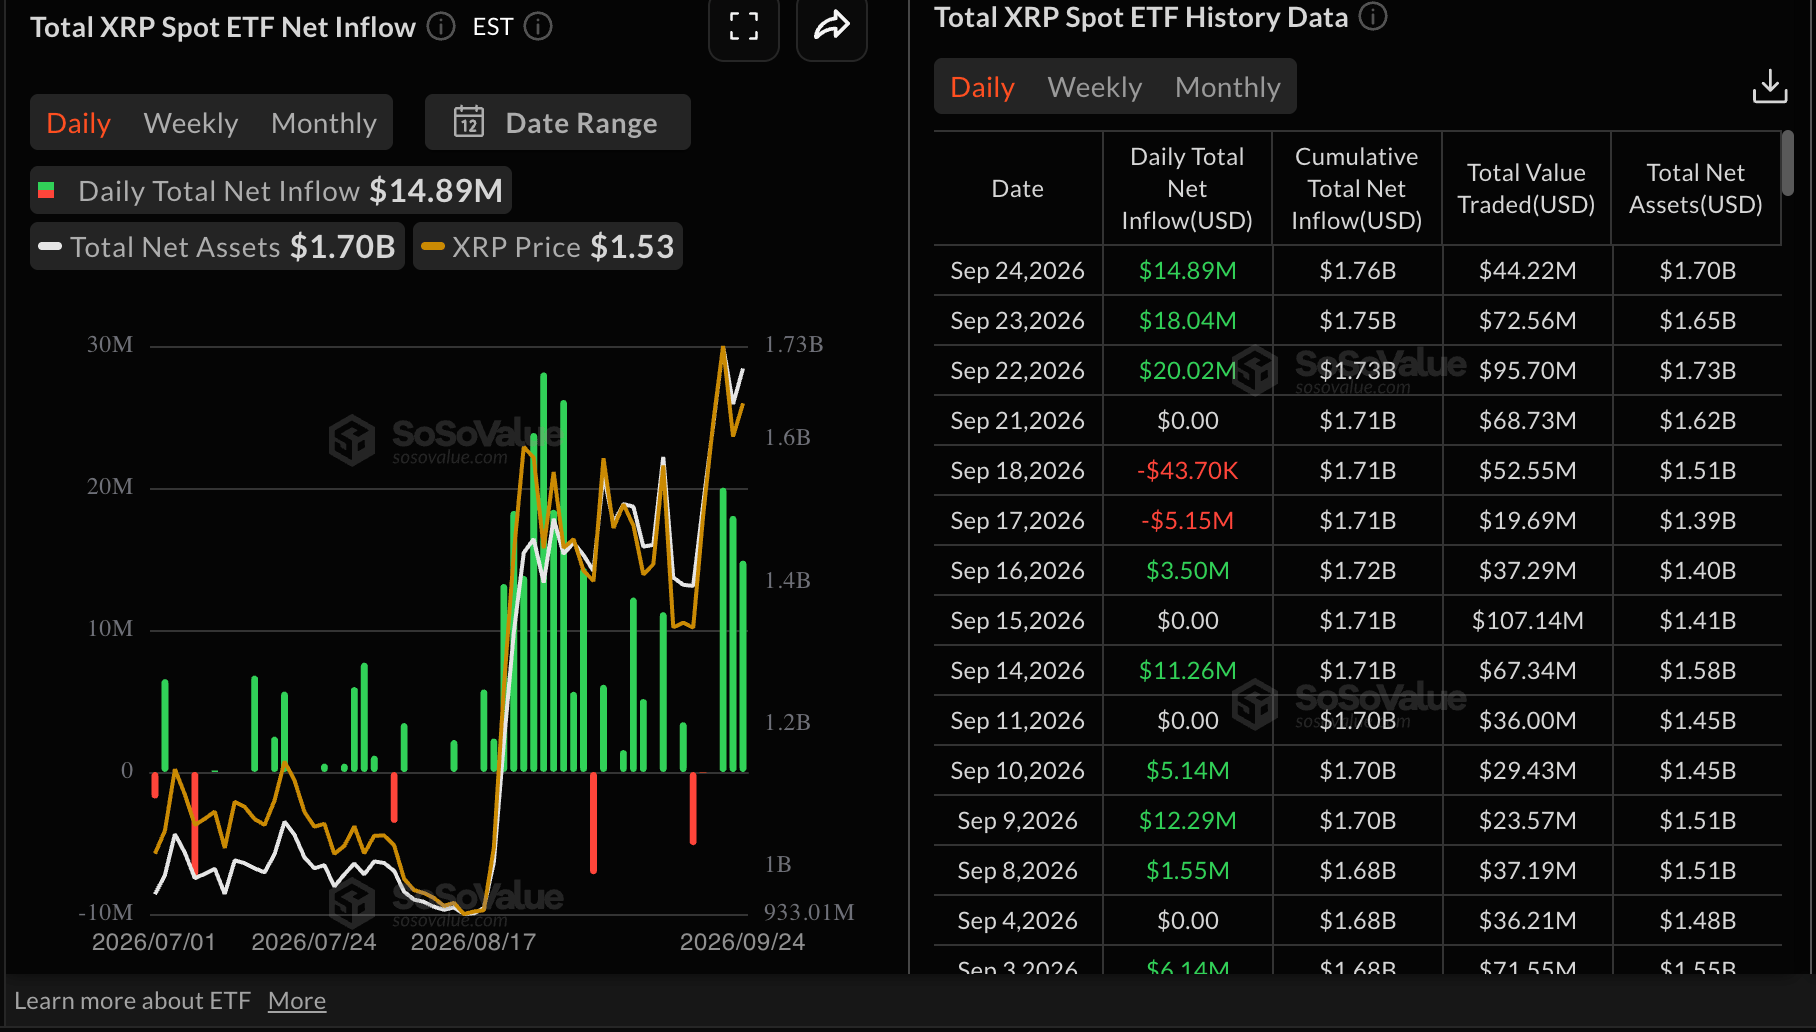
XRP spot Exchange-Traded Funds (ETFs) mirror the risk-on sentiment, with inflows of roughly $15 million on Thursday, down slightly from $18 million on Wednesday and $20 million on Tuesday.
Cumulatively, inflows stand at about $53 million through Thursday. If sustained, steady interest among institutional investors cushions against spot-market headwinds and increases the odds of an extended breakout.
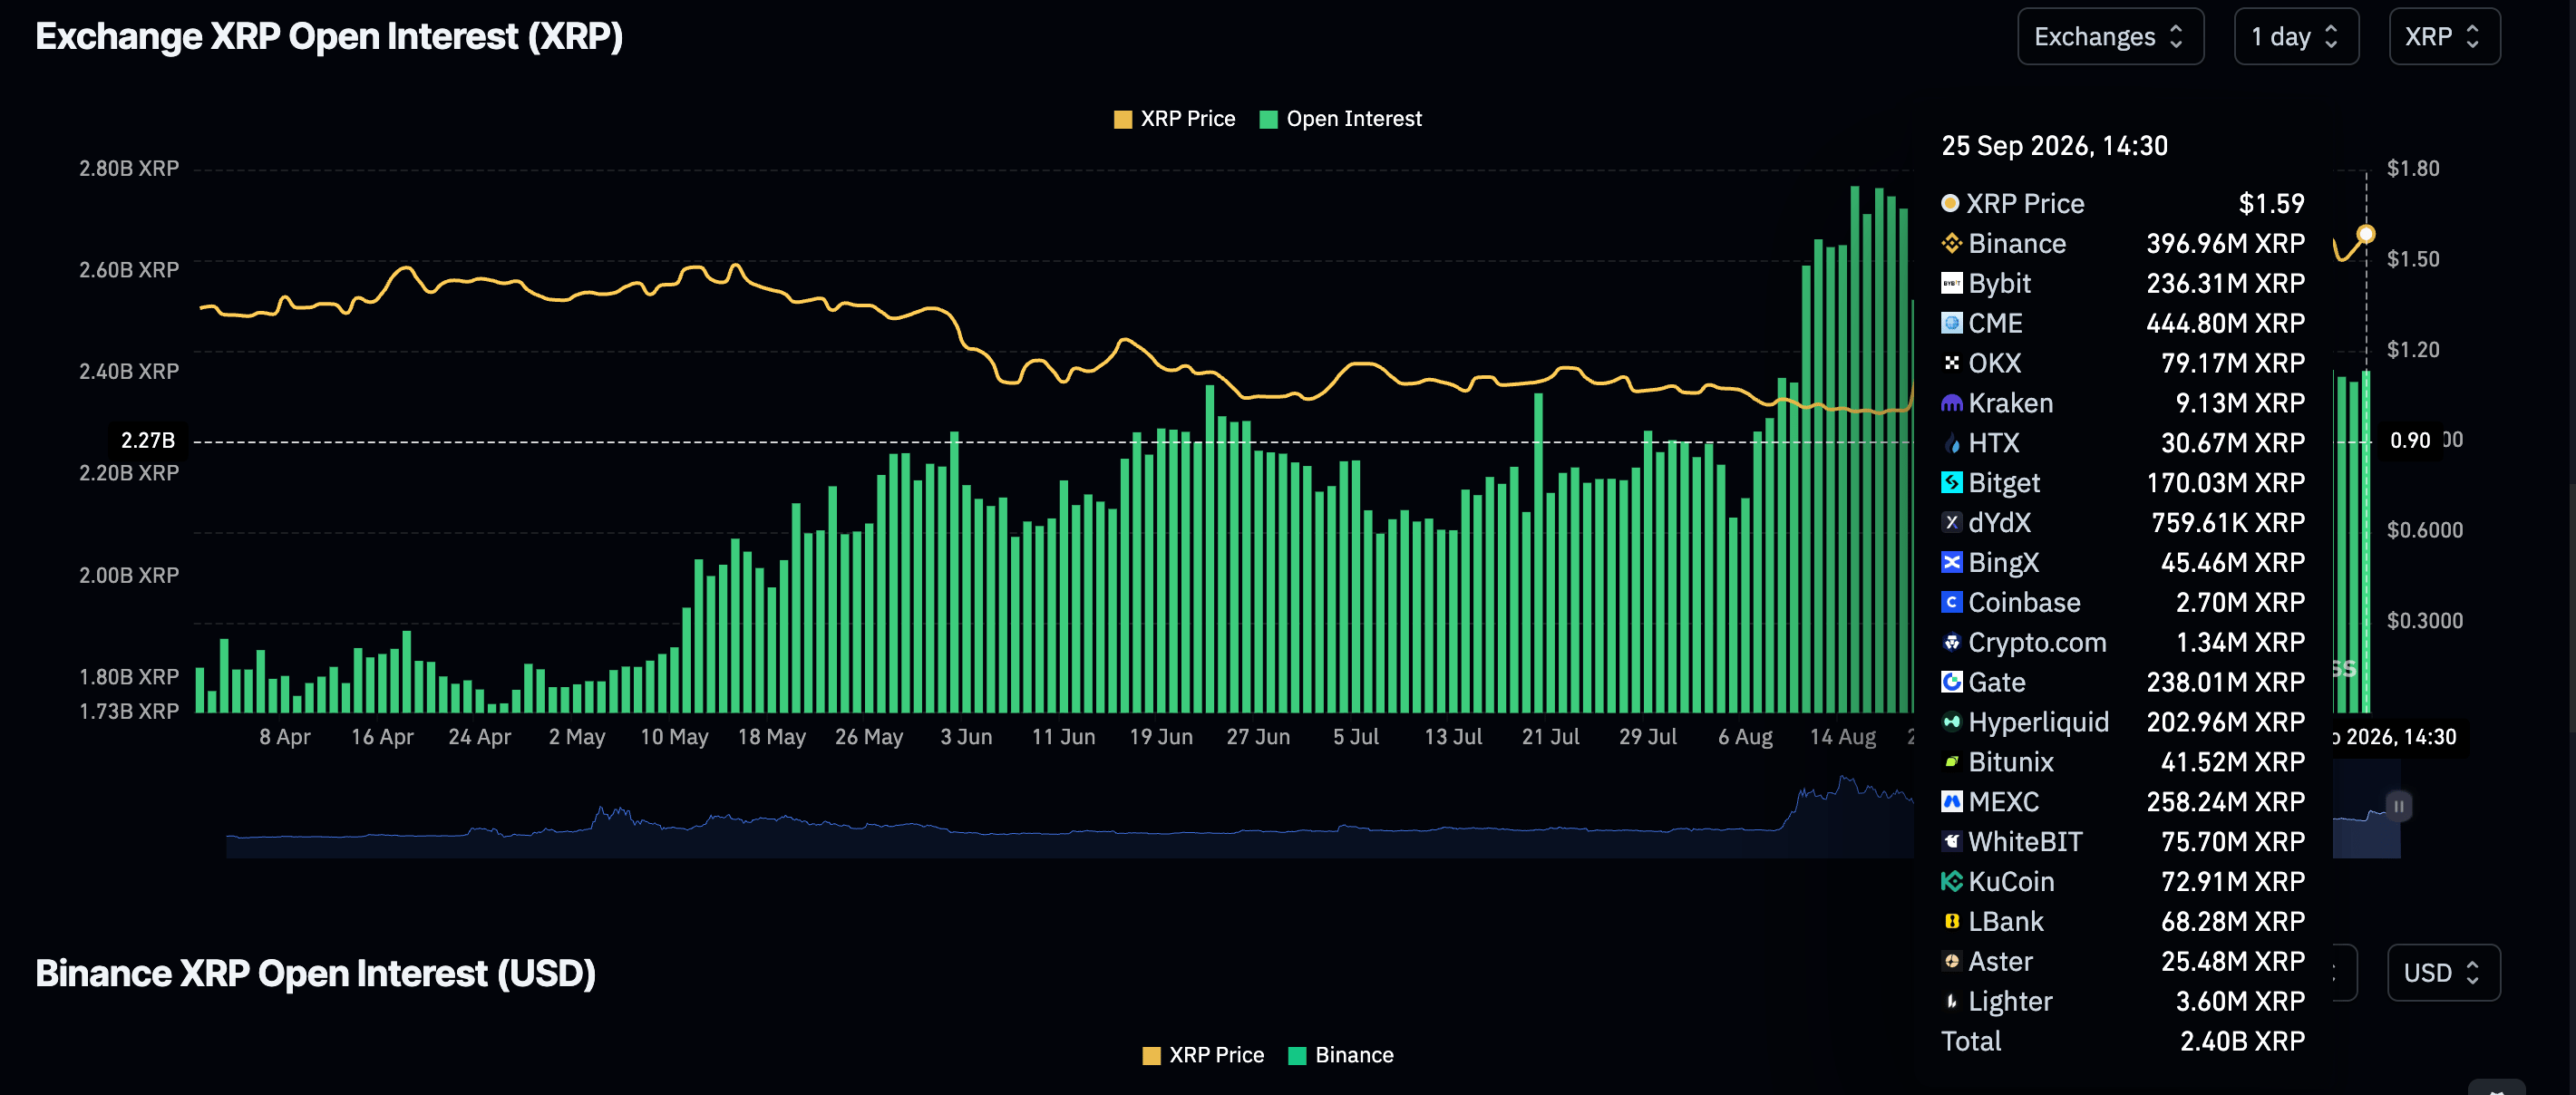
In the derivatives market, investors are holding perpetual futures Open Interest (OI) steady at 2.4 billion XRP on Friday, up only marginally from 2.38 billion XRP the day before. More broadly, risk-on sentiment has continued to improve, with OI averaging 2.08 billion in September, underpinning ongoing price increases.
Technical analysis: XRP bulls retain control
XRP trades at $1.58, holding a clear bullish bias as price extends well above the 50-day, 100-day and 200-day Exponential Moving Averages (EMAs) at $1.34, $1.29 and $1.37, respectively, reinforcing a firmly supported uptrend.
The SuperTrend line at $1.28 sits far below the market, underscoring a broad constructive structure, while the RSI near 65 suggests strong but not extreme positive momentum. The MACD remains positive, with the line above zero and recent values advancing, hinting at persistent bullish pressure.
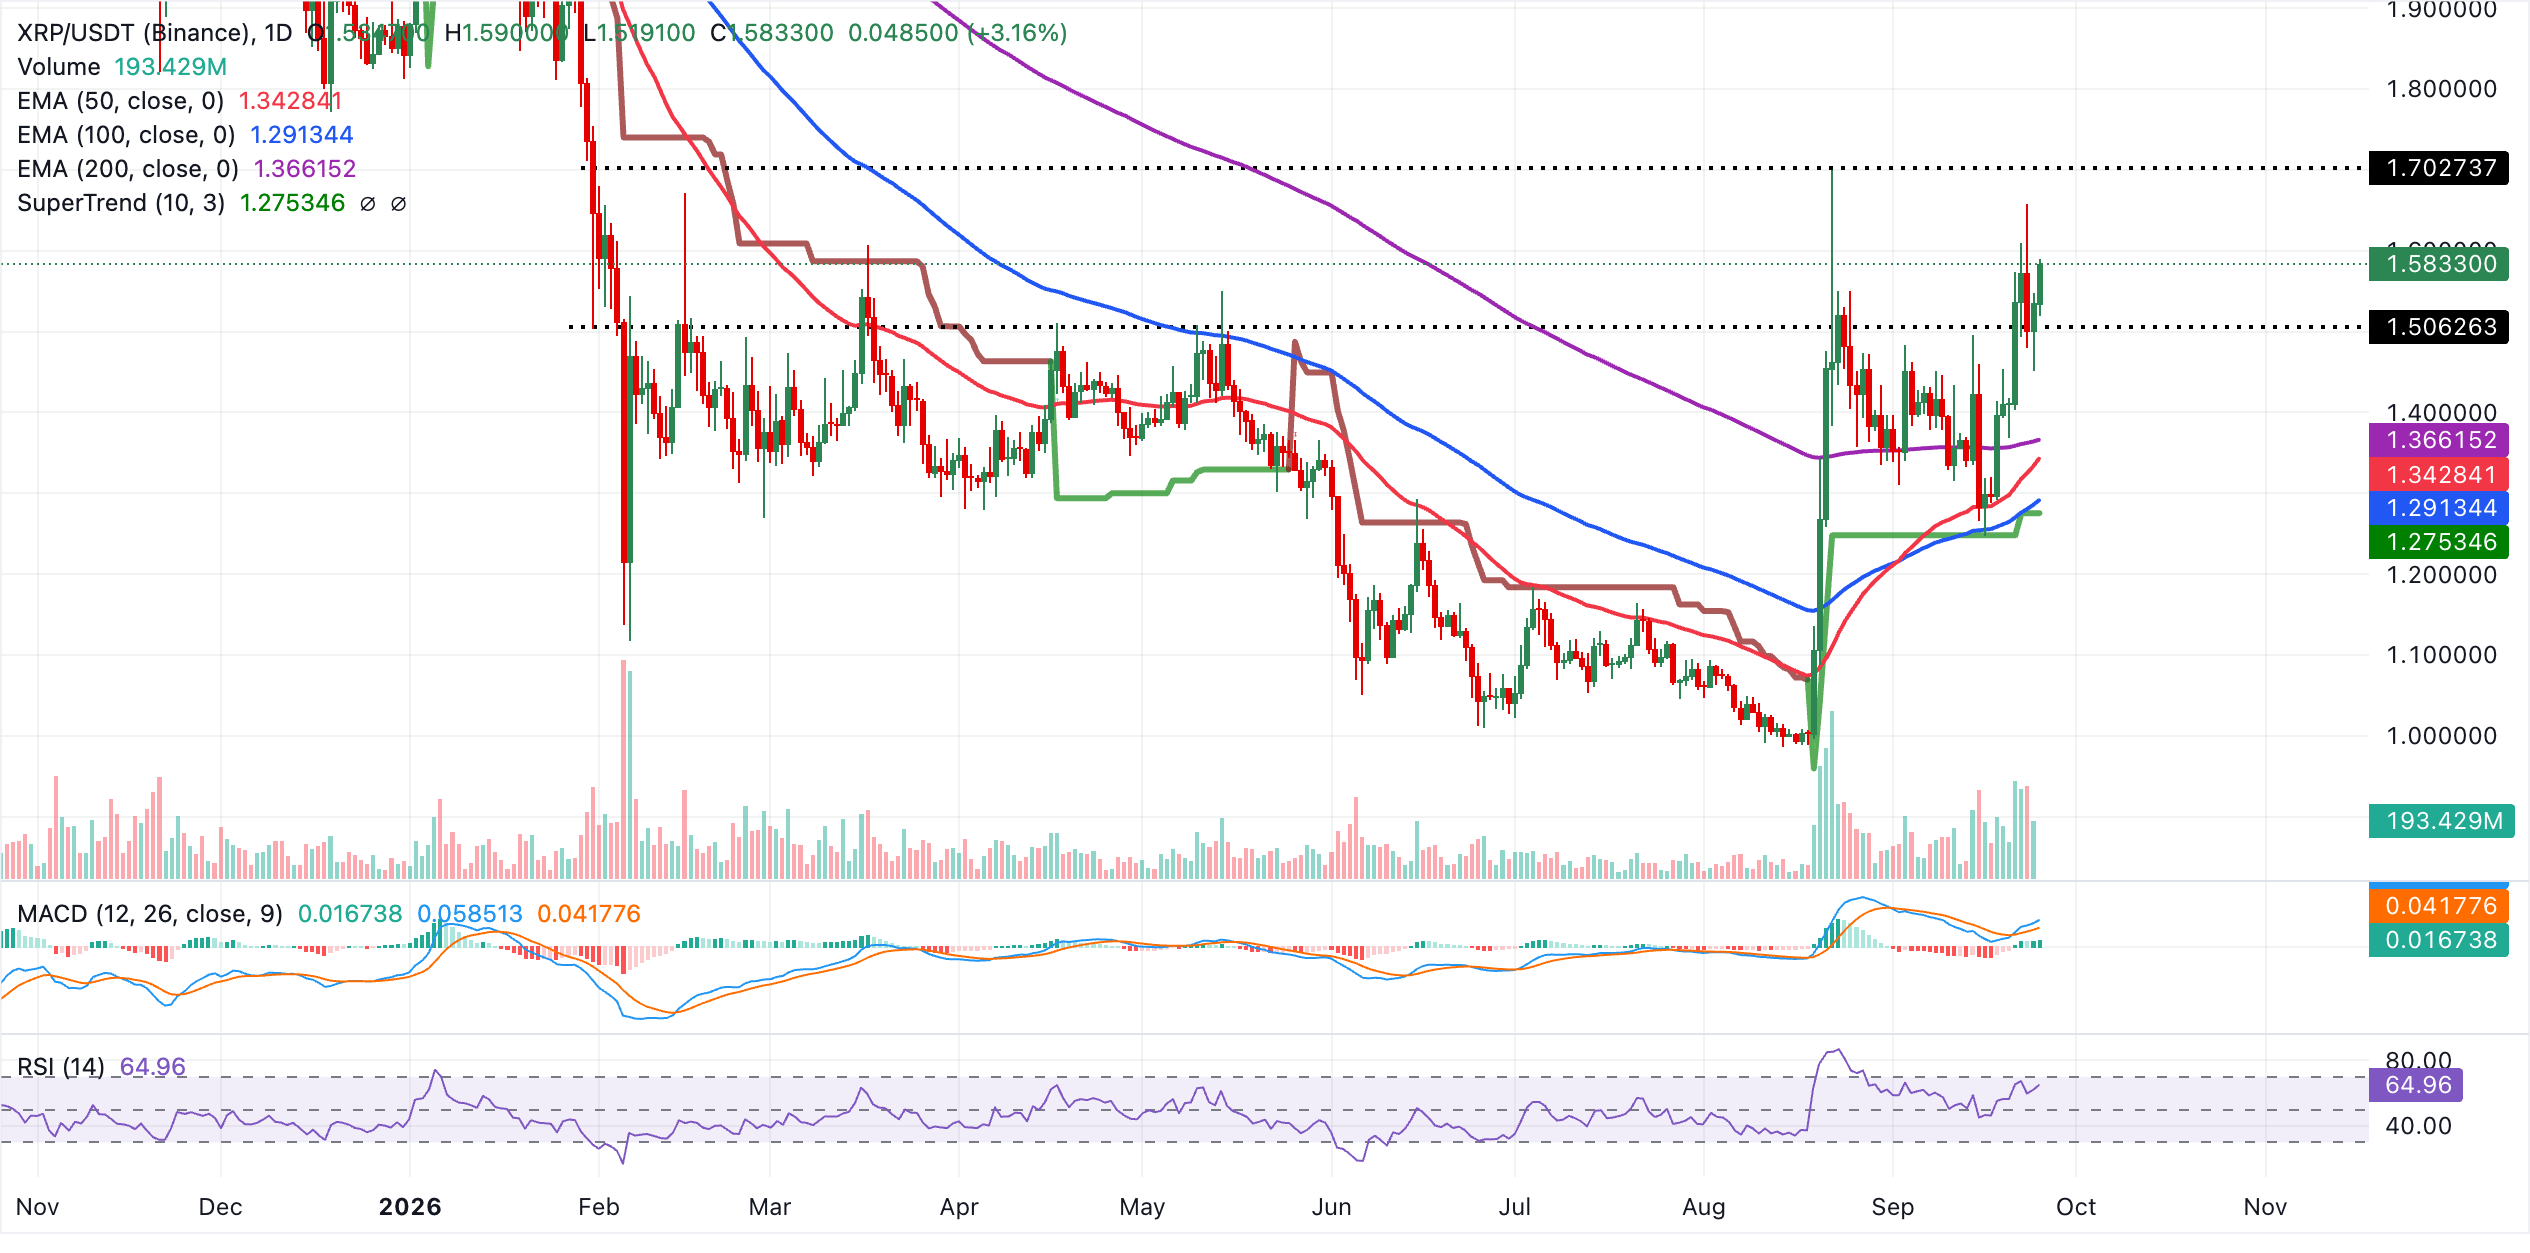
On the downside, immediate support is seen at the 200-day EMA at $1.37, followed by the 50-day EMA at $1.34, which together define a dense demand band underpinning the advance. Deeper pullbacks would likely find buyers near the 100-day EMA at $1.29 and the SuperTrend level at $1.28, where trend-following support strengthens. With price holding comfortably above these underlying levels, the near-term technical outlook remains skewed toward further gains as these supports hold.
Still, the remittance token maintains a bullish near-term bias on the weekly chart as price holds above the 50-week and 200-week EMAs at $1.52 and $1.37, respectively. The pair is now pressing just under the 100-week EMA at $1.59, which acts as immediate overhead resistance.
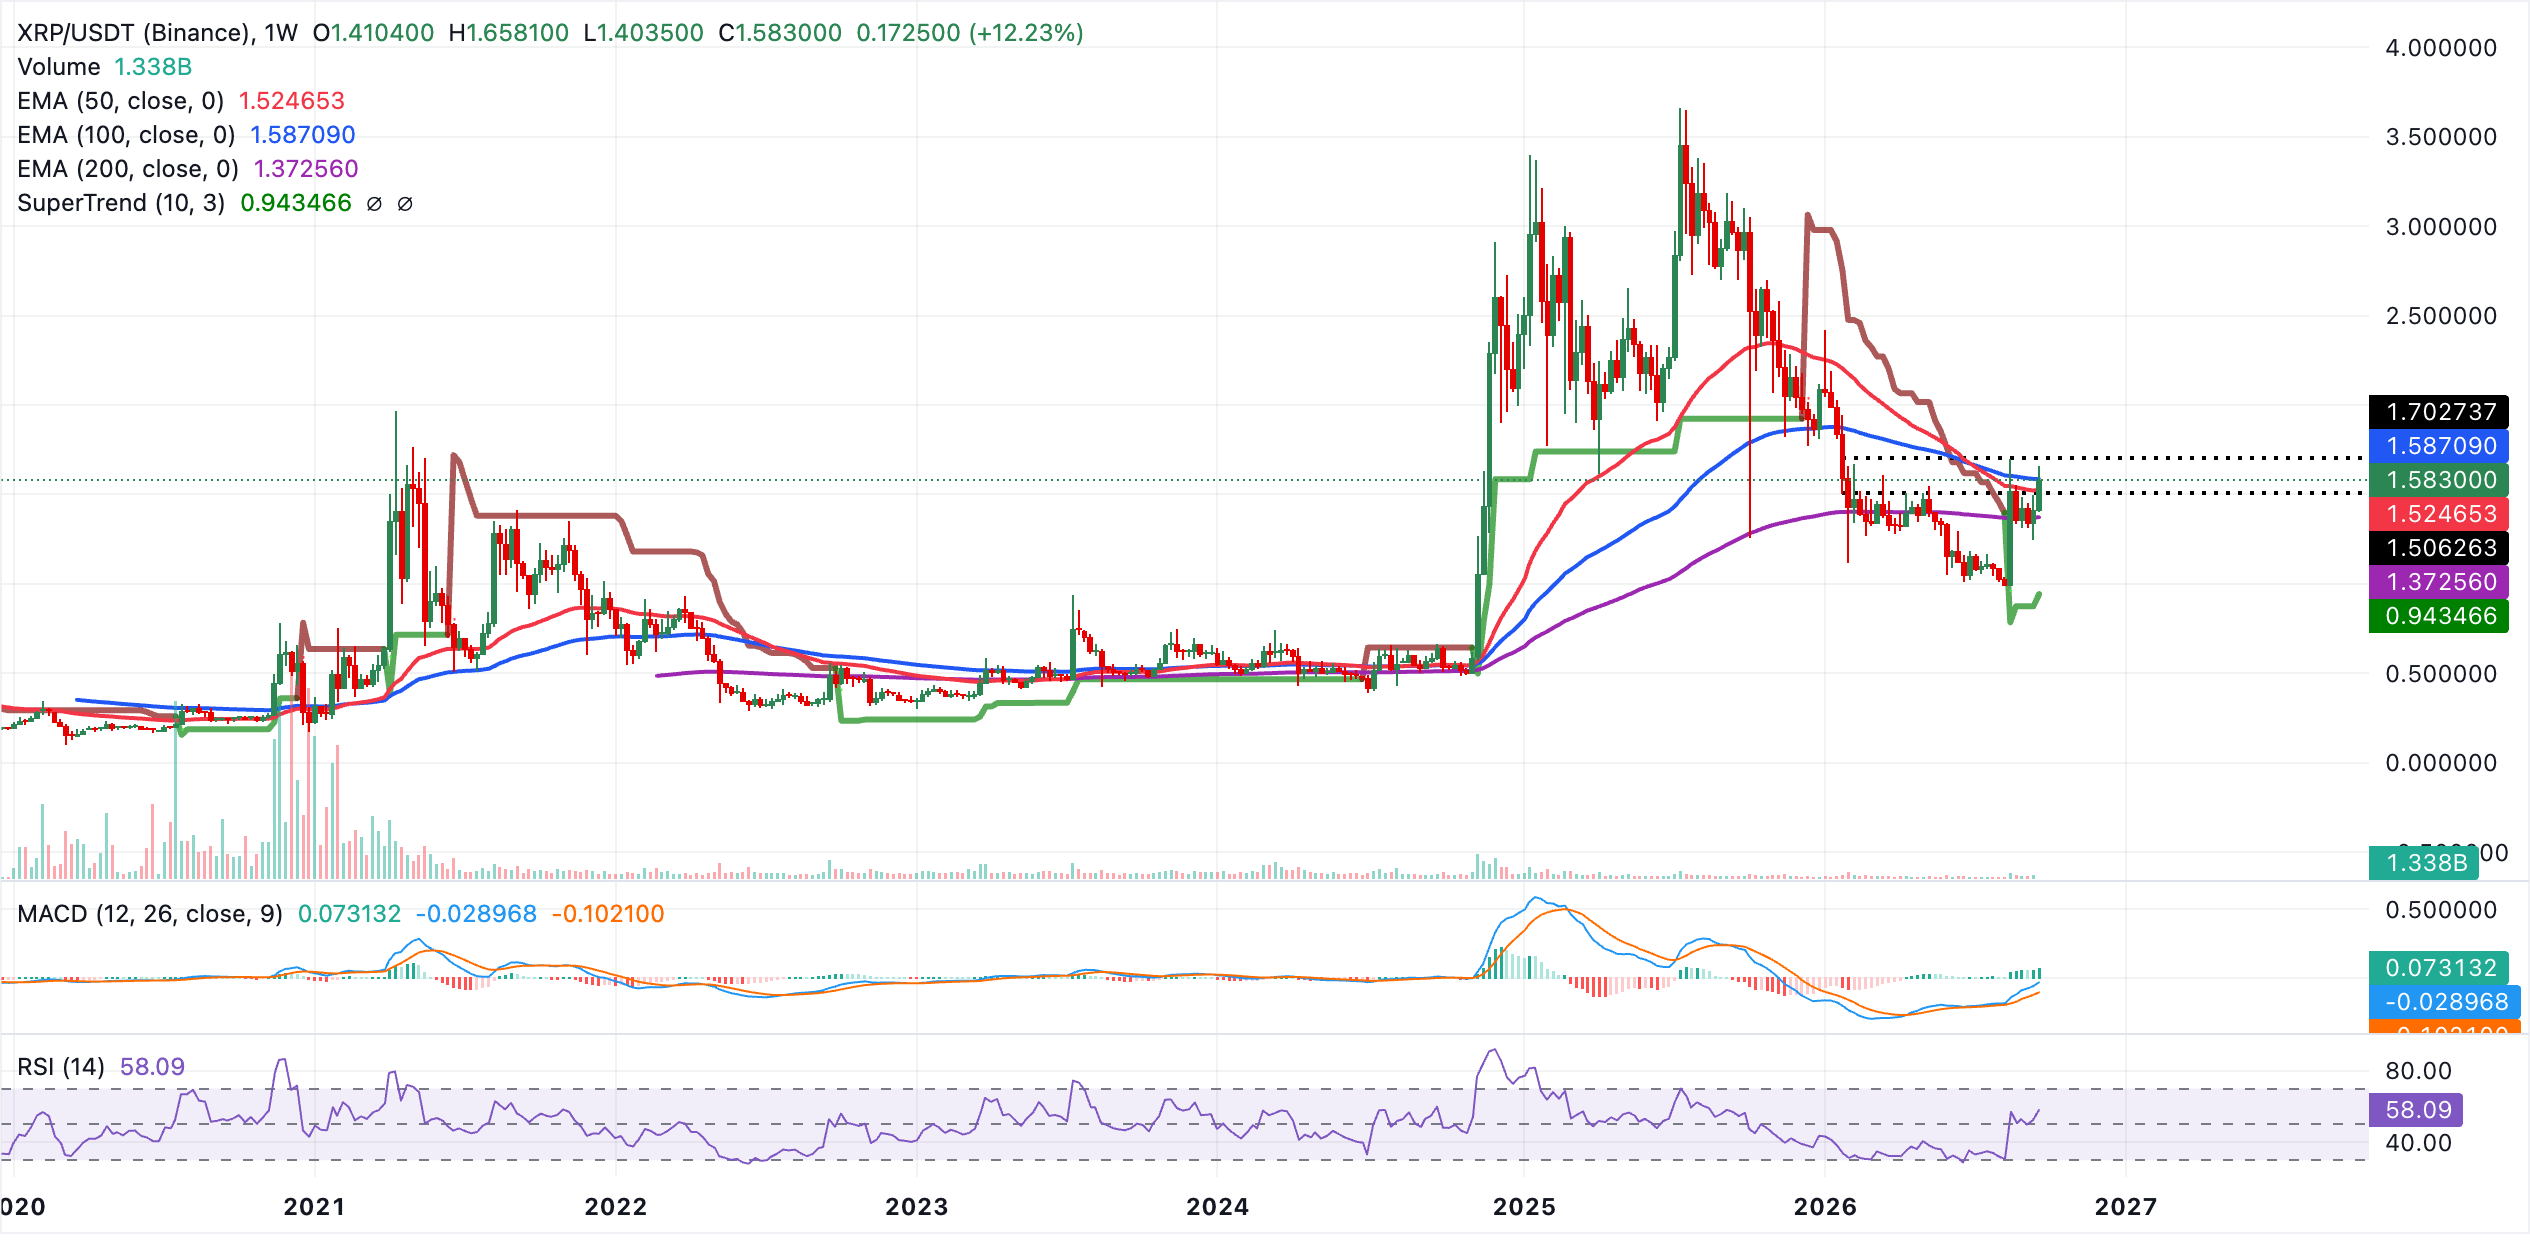
A clear weekly close above the 100-week EMA at$ 1.59 would open the door for further gains, reinforcing the bullish structure. On the downside, initial support is seen at the 50-week EMA at $1.52, with the 200-week EMA at $1.37 offering a deeper structural floor.
(The technical analysis of this story was written with the help of an AI tool. Know more.)
Ripple FAQs
Ripple is a payments company that specializes in cross-border remittance. The company does this by leveraging blockchain technology. RippleNet is a network used for payments transfer created by Ripple Labs Inc. and is open to financial institutions worldwide. The company also leverages the XRP token.
XRP is the native token of the decentralized blockchain XRPLedger. The token is used by Ripple Labs to facilitate transactions on the XRPLedger, helping financial institutions transfer value in a borderless manner. XRP therefore facilitates trustless and instant payments on the XRPLedger chain, helping financial firms save on the cost of transacting worldwide.
XRPLedger is based on a distributed ledger technology and the blockchain using XRP to power transactions. The ledger is different from other blockchains as it has a built-in inflammatory protocol that helps fight spam and distributed denial-of-service (DDOS) attacks. The XRPL is maintained by a peer-to-peer network known as the global XRP Ledger community.
XRP uses the interledger standard. This is a blockchain protocol that aids payments across different networks. For instance, XRP’s blockchain can connect the ledgers of two or more banks. This effectively removes intermediaries and the need for centralization in the system. XRP acts as the native token of the XRPLedger blockchain engineered by Jed McCaleb, Arthur Britto and David Schwartz.
Recommended Articles


