

US input costs rose at the fastest pace in four years — the September flash PMI beat is an inflation story, not a growth story


coverImg
Source: DepositPhotos

Mitrade Insights — The September flash PMIs were reported as a growth story. They are not. The composite reading of 58.4 was a 62-month high, but the line that repriced markets was input costs, which rose at the fastest pace since October 2022 — driven by fuel and transport costs, with manufacturing raw-material prices tied to supply shortages. Traders responded by pushing the 10-year Treasury yield to 5.11%, its highest since July 2007, and the odds of an October Fed hike to roughly 70%. This is a price story wearing a growth headline.

What the September flash PMIs actually showed

S&P Global US flash PMI, September 2026ReadingVersus
Composite58.4up from 56.0 in August — 62-month high
Services58.7strongest in almost five years
Manufacturing (output)56.7highest since 2022
Input costsfastest in four yearshighest since October 2022
Prices chargedpicked up, but mutedheld back by competition
Backlogs of worksharpest since mid-2022supply delays most widespread since July 2022
Employmentfastest in more than four years—

Chris Williamson of S&P Global Market Intelligence did not mince words, saying the jump in input costs "will add further to the upward pressure on selling prices and inflation in the coming months."

Note the asymmetry embedded in that table: input costs are accelerating faster than selling prices, because competition is absorbing part of the hit. That is a margin problem today and an inflation problem tomorrow — which is exactly why bond markets moved first.

How we got here: the chain from crude to the checkout

Input cost inflation does not appear from nowhere. The chain runs as follows:

  • Brent crude is back above $100. The November contract settled at $103.08 on September 23, up 3.86%, ending a five-day slide, after Iranian officials signalled the Strait of Hormuz would not reopen until conditions were met, keeping Middle East supply-route risk in the price. Brent is trading around $102.39 in Asia on Thursday.

  • US retail diesel is at a record, up more than 80% year to date. That shows up directly in every freight and haulage contract in the S&P survey.

  • Supply chains are re-tightening. September saw the most widespread supplier delays since July 2022, and manufacturers reported raw-material shortages rather than weak demand.

  • Wages are adding to it. Service-sector input cost inflation hit its highest since November 2022, with employment growth the fastest in over four years.
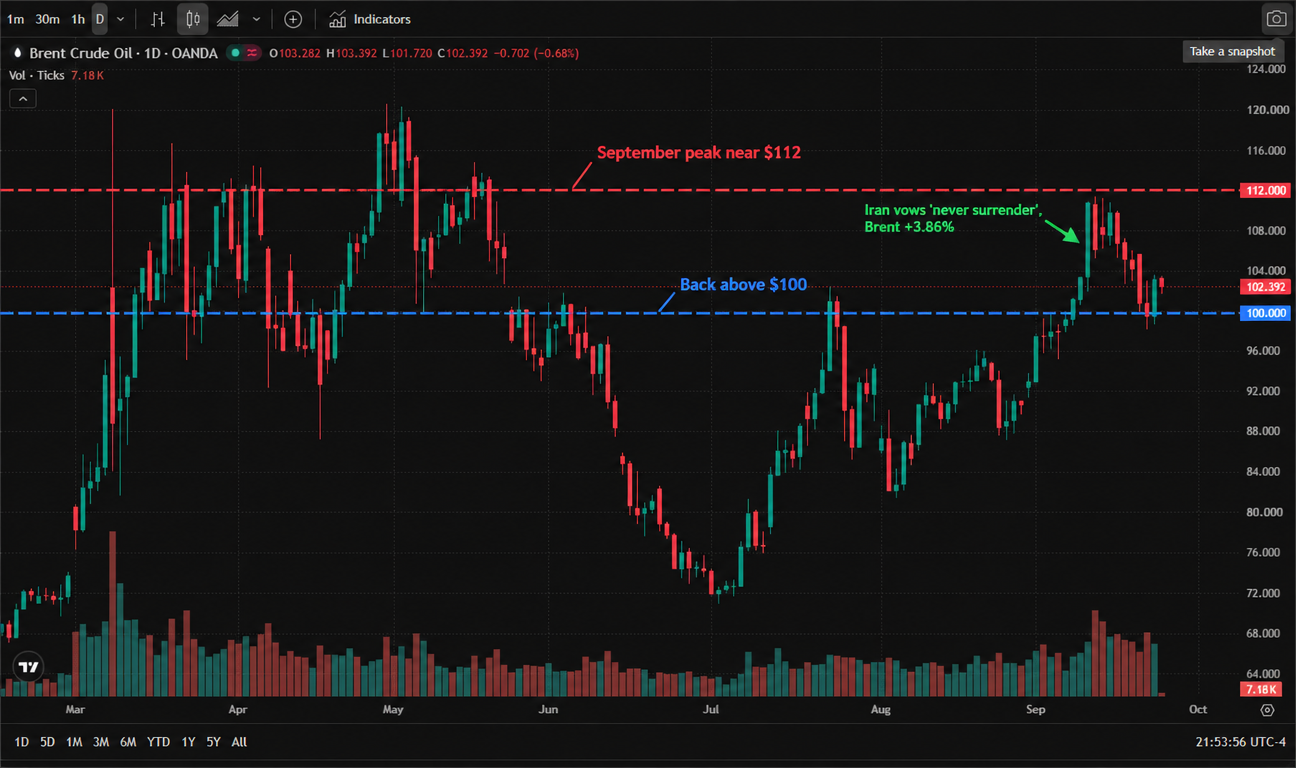
Brent crude (OANDA:BCOUSD) daily chart (official TradingView screenshot, OANDA data feed, real candlesticks and volume from March to October 2026, English interface, UTC-4) — crude rose from about 68 in February to a March spike near 121, chopped between 100 and 118 through April and May, slid from about 106 in June to a July low near 72, then staged a steady recovery through August and September, peaking near 112 in September before easing to about 104. As of the September 24, 2026 Asia session it trades at 102.392, with an open of 103.282, a high of 103.392 and a low of 101.720, down 0.702 (−0.68%) on 7.18K volume.

* Chart source: official TradingView screenshot (OANDA:BCOUSD).

What the bond market priced, and what the desks say

The repricing was violent and concentrated in the front end:

US Treasuries after the PMILevel
10-year yield5.113% close (intraday 5.12–5.13%) — highest since July 2007
5-year yieldbroke above 5% for the first time since 2007
2-year yieldabout 4.88–4.95%, highest since May 2024
30-year yieldabout 5.37–5.39%
October Fed hike oddsroughly 66–73%, up from about 53% a day earlier and under 10% a month ago

ING attributed roughly 80–85% of the move to real rates rather than inflation expectations — an important distinction, because it means the market is repricing the policy path, not panicking about prices. Fed Governor Michael Barr reinforced it the same day, saying further policy adjustments may be needed. And the paper itself is meeting resistance: a $70 billion five-year note auction drew weak demand, with dealers absorbing an unusually large share.
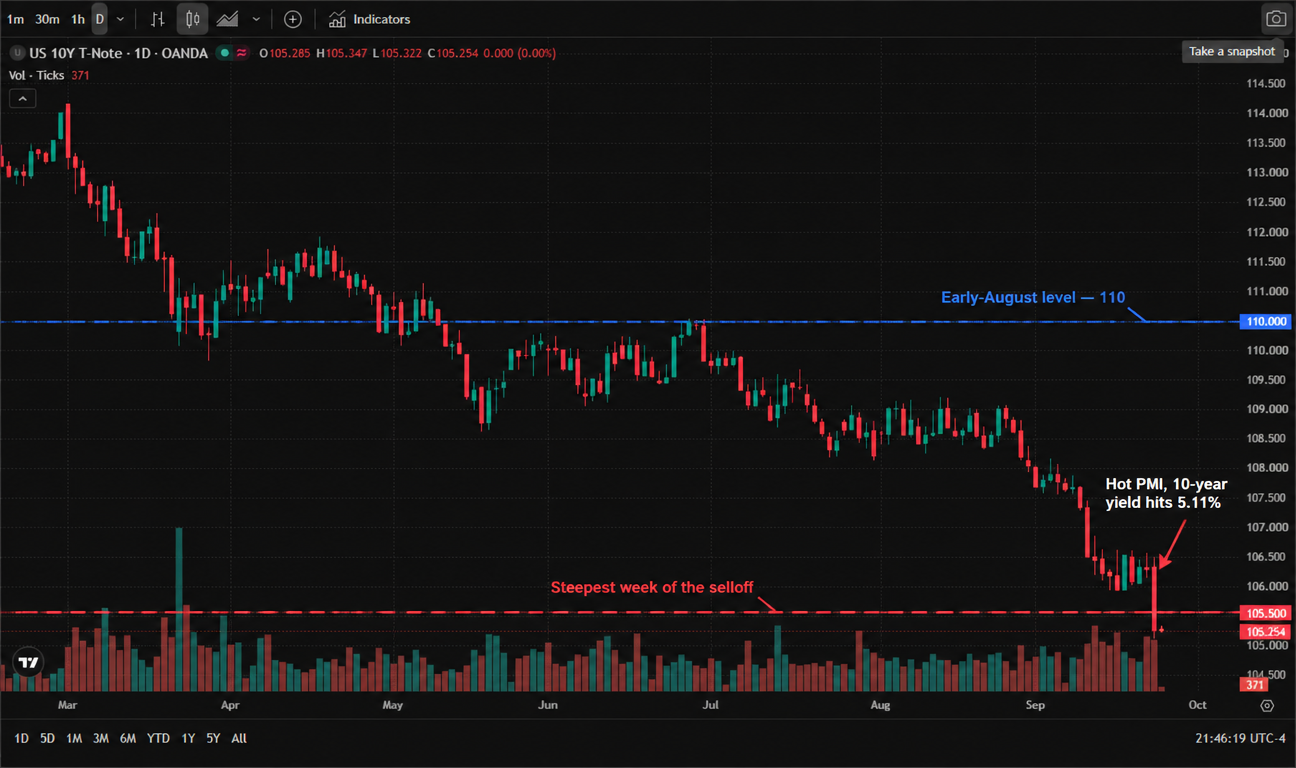
US 10-year T-note futures (OANDA:USB10YUSD) daily chart (official TradingView screenshot, OANDA data feed, real candlesticks and volume from March to October 2026, English interface, UTC-4) — note that this series shows the futures PRICE, which falls as yields rise. Prices slid from about 114 in March to 108 by July, recovered to 110 in early August, then fell steadily through September to about 105, with the steepest single-day drop in the final week. As of the September 24, 2026 Asia session it trades at 105.254, with an open of 105.285, a high of 105.347 and a low of 105.222.

* Chart source: official TradingView screenshot (OANDA:USB10YUSD). Price and yield move inversely.

Two scenarios into month-end

Scenario A — the cost pass-through shows up in the data. Selling prices catch up to input costs, PCE comes in hot, and October hike odds push through 80%. The 10-year holds above 5%, the dollar index extends toward 101, and gold stays capped below its 200-day average. Risk assets take the brunt.

Scenario B — oil gives back the spike. Brent slips back below $100 on a Hormuz reopening, supply-chain delays ease, and the input-cost surge proves to be a fuel-driven blip rather than a broad price cycle. Ten-year yields retreat toward 4.90%, the dollar index fades back under 100, and October hike pricing falls back to a coin flip.

What to watch

Tonight: US initial jobless claims (consensus around 201K, prior 196K), final Q2 GDP revisions and more Fed speakers. Then ADP employment and final Q2 GDP on September 30, and non-farm payrolls on October 2, consensus 100K against 162K prior — a soft print would cut against the inflation narrative. The FOMC meets October 27–28.
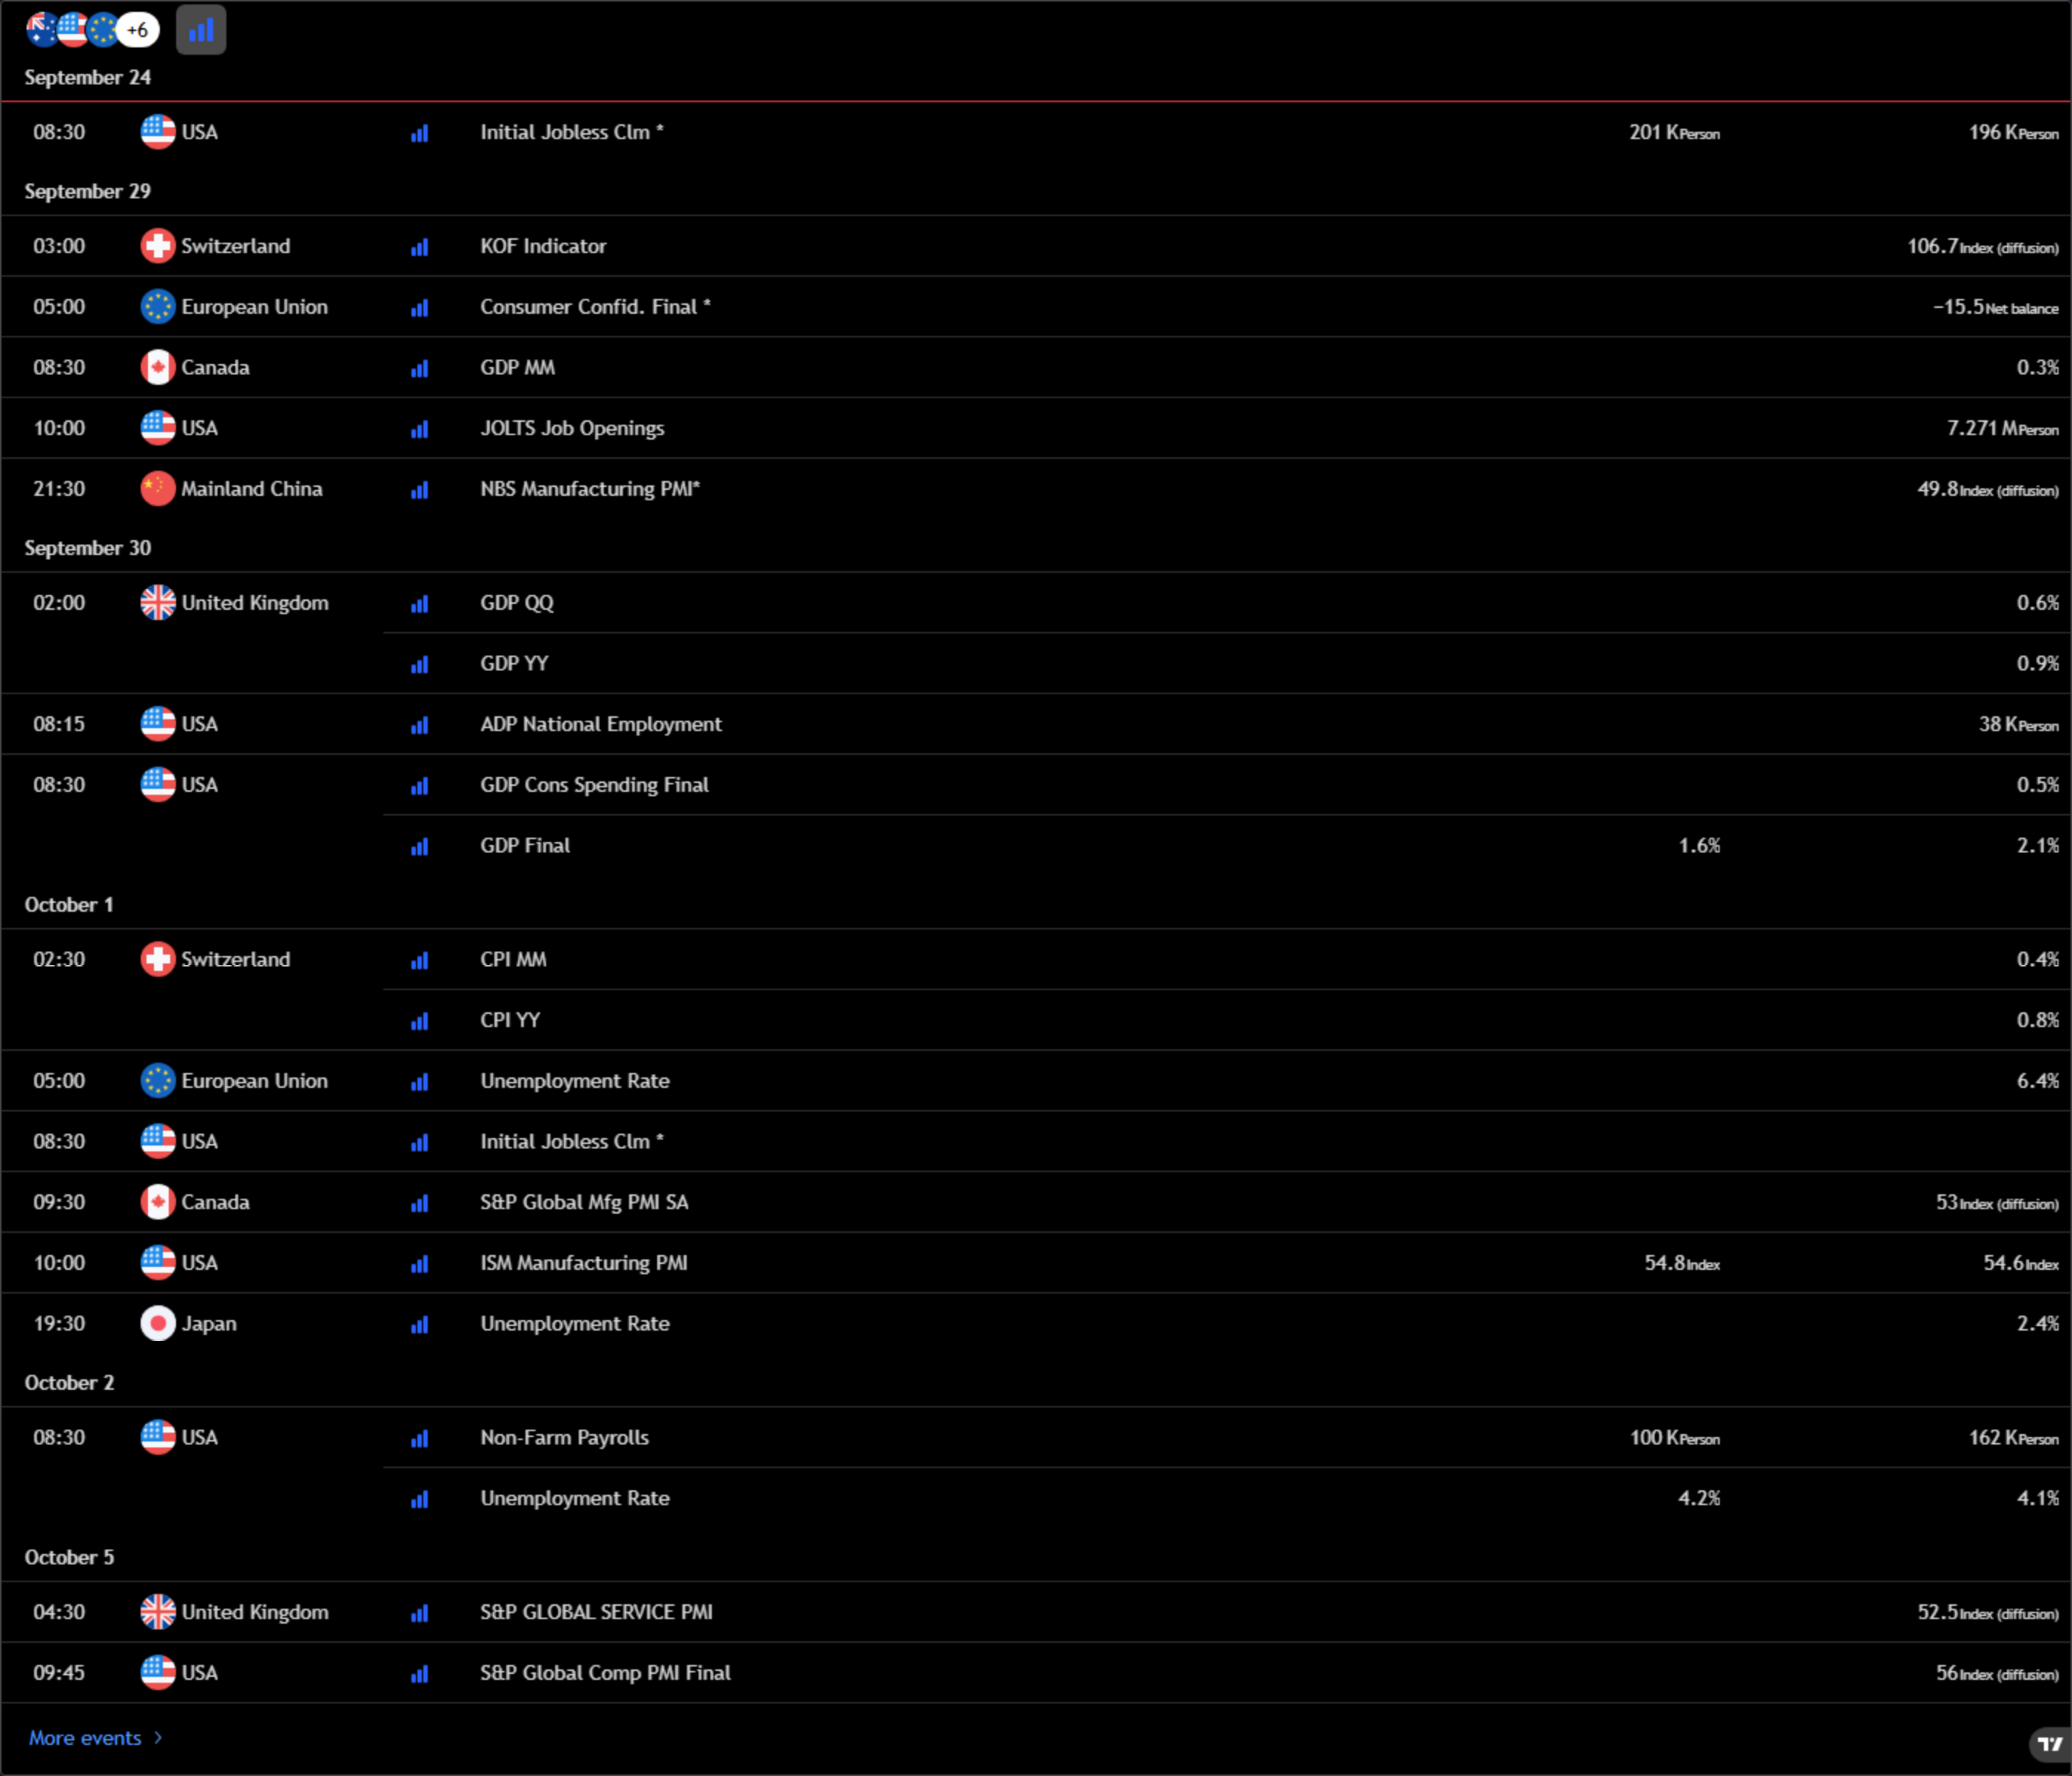
TradingView economic calendar (English interface, America/New_York time zone) covering September 24 to October 5, 2026 — US initial jobless claims expected at 201K versus 196K prior, JOLTS job openings, ADP employment at 38K, final Q2 GDP at 1.6%, ISM manufacturing at 54.8, and US non-farm payrolls on October 2 expected at 100K against 162K prior, with unemployment at 4.2%.

* Chart source: official TradingView economic calendar widget.

The risk in both directions is the same one: this is a fuel-led cost shock landing on an economy whose services sector is accelerating. That combination is harder for a central bank to look through than either half on its own.

Read more

  • Gold Price Forecast: XAU/USD drifts toward $4.300 with bears gaining traction
  • Note: If you want to share the article 《US input costs rose at the fastest pace in four years — the September flash PMI beat is an inflation story, not a growth story》, make sure you retain the original link. For more information, please visit Insights or browse www.mitrade.com.

    * The content presented above, whether from a third party or not, is considered as general advice only.  This article should not be construed as containing investment advice, investment recommendations, an offer of or solicitation for any transactions in financial instruments.

    goTop
    quote
    Related Articles
    placeholder
    US Special Envoy Witkoff says mediators completed round of US-Iran talksUnited States (US) Special Envoy to the Middle East, Steve Witkoff, said the US held "lengthy" indirect talks with the Iranian delegation via mediators on the sidelines of the United Nations General Assembly (UNGA), Reuters reported on Tuesday.
    Author  FXStreet
    Yesterday 01: 45
    United States (US) Special Envoy to the Middle East, Steve Witkoff, said the US held "lengthy" indirect talks with the Iranian delegation via mediators on the sidelines of the United Nations General Assembly (UNGA), Reuters reported on Tuesday.
    placeholder
    WTI (USOIL) Is down 2.13% on Sep 22: What Is Driving the Move?WTI (USOIL) is down 2.13% at Sep 22 05:55(ET), now at $89.999, with a 7-day down of 12.84%.What is driving WTI (USOIL)’s stock price down today?The retreat in US crude oil benchmark prices was primari
    Author  TradingKey
    Sep 22, Tue
    WTI (USOIL) is down 2.13% at Sep 22 05:55(ET), now at $89.999, with a 7-day down of 12.84%.What is driving WTI (USOIL)’s stock price down today?The retreat in US crude oil benchmark prices was primari
    placeholder
    Crude Oil Price Forecast: Can Brent Hold $100 as Saudi Export Recovery Weighs on Risk Premium?International oil prices fell for a fourth consecutive trading day on Monday, marking their longest losing streak since June. Although Iranian-backed Houthi militants launched fresh attac
    Author  TradingKey
    Sep 21, Mon
    International oil prices fell for a fourth consecutive trading day on Monday, marking their longest losing streak since June. Although Iranian-backed Houthi militants launched fresh attac
    placeholder
    Brent slides below $102 after Houthis' first strike on Riyadh — why oil can't hold $100Houthi forces struck Riyadh for the first time on September 19 and hit Yanbu facilities — yet Brent opened at $104.71, peaked at $104.90 and settled at $101.68 (-1.63% on the day). Here is the four-way data tug-of-war between strike escalation and supply recovery, and the two switches that decide where oil goes next.
    Author  Irene Q.
    Sep 21, Mon
    Houthi forces struck Riyadh for the first time on September 19 and hit Yanbu facilities — yet Brent opened at $104.71, peaked at $104.90 and settled at $101.68 (-1.63% on the day). Here is the four-way data tug-of-war between strike escalation and supply recovery, and the two switches that decide where oil goes next.
    placeholder
    Today’s Market Recap: AI Chip Stocks Gain, SanDisk Surges Nearly 11%, Micron Rises Nearly 4%, Bitcoin Reclaims $80,000Tracking Market TrendsTradingKey - On September 18, Eastern Time, U.S. stocks capped off a volatile week with the three major benchmarks closing mixed. Tech and semiconductor stocks extended their reb
    Author  TradingKey
    Sep 21, Mon
    Tracking Market TrendsTradingKey - On September 18, Eastern Time, U.S. stocks capped off a volatile week with the three major benchmarks closing mixed. Tech and semiconductor stocks extended their reb
    Live Quotes
    Name / SymbolChart% Change / Price
    XAUUSD
    XAUUSD
    0.00%0.00
    USDOLLAR-F
    USDOLLAR-F
    0.00%0.00

    Oil Related Articles

    • Best Oil Trading Platforms in 2026: A Complete Guide for Retail Traders
    • Should I Invest in Oil Right Now? The 2026 Oil Price Forecast
    • Crude Oil Trading: How To Invest In WTI/Brent Oil?
    • WTI Moves Upward Near $75.50 on Dovish Fed Outlook, Maersk, CMA CGM Return to Red Sea

    Click to view more