


CVS Health Corp Stock (CVS) Moved Up by 3.65% on Sep 25: What Signal Does It Send?
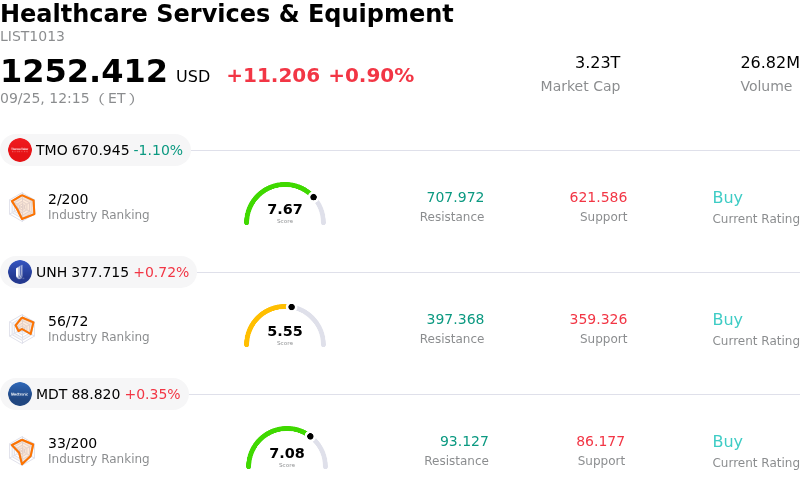
CVS Health Corp (CVS) moved up by 3.65%. The Healthcare Services & Equipment sector is up by 0.90%. The company outperformed the industry. Top 3 stocks by turnover in the sector: Thermo Fisher Scientific Inc (TMO) down 1.10%; Unitedhealth Group Inc (UNH) up 0.73%; Medtronic PLC (MDT) up 0.38%.
What is driving CVS Health Corp (CVS)’s stock price up today?
CVS Health experienced a robust upward move accompanied by elevated intraday volatility, effectively snapping a multi-day losing streak that had weighed heavily on the shares. The sharp turnaround was primarily driven by technical oversold conditions following persistent downside pressure related to broader healthcare sector sentiment and policy concerns. As technical indicators signaled oversold territory, institutional buyers and value-seeking investors stepped in to capitalise on the discounted valuation, triggering a strong relief rally.
Fundamental factors also supported the positive shift in market sentiment. Wall Street analysts recently reiterated constructive ratings, pointing out that end-of-quarter management commentary contained no incremental negative surprises regarding third-quarter medical benefit ratios. Market participants drew encouragement from the ongoing operational recovery at the Aetna health insurance unit, alongside the full-year earnings guidance raise delivered during the prior quarterly results. The alignment of steady consensus forecasts for long-term profit growth helped reassure investors that near-term operational challenges remain manageable.
While market participants continue to monitor regulatory developments in pharmacy benefit management, potential headwind variables for future contract pharmacy programs, and general medical cost trends, today's price action highlights strong institutional support at lower price levels. The combination of technical oversold bounce, solid multi-year earnings guidance, and favorable valuation multiples provided a firm catalyst for the equity's upward momentum.
Technical Analysis of CVS Health Corp (CVS)
Technically, CVS Health Corp (CVS) shows a MACD (12,26,9) value of -1.230, indicating a sell signal. The RSI at 36.860 suggests neutral condition and the Williams %R at 72.700 suggests sell condition. Please monitor closely.
Media Coverage of CVS Health Corp (CVS)
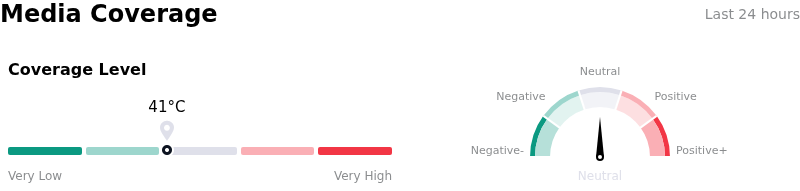
In terms of media coverage, CVS Health Corp (CVS) shows a coverage score of 41, indicating a moderate level of media attention. The overall market sentiment index is currently in neutral zone.
Fundamental Analysis of CVS Health Corp (CVS)
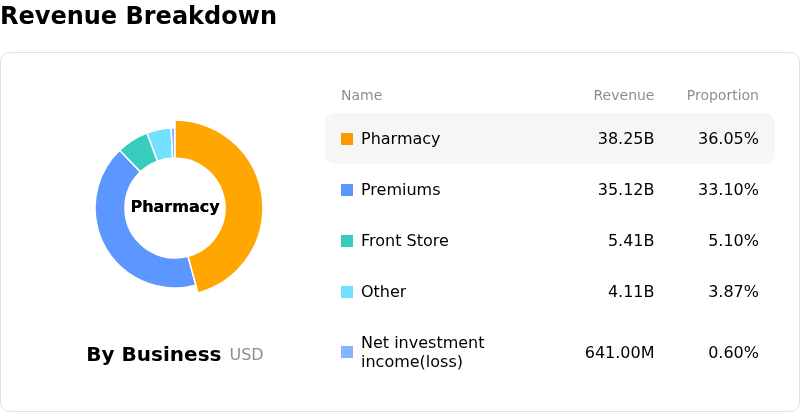
CVS Health Corp (CVS) is in the Healthcare Services & Equipment industry. Its latest annual revenue is $402.07B, ranking 2 in the industry. The net profit is $1.77B, ranking 5 in the industry. Company Profile
Over the past month, multiple analysts have rated the company as Buy, with an average price target of $112.93, a high of $125.00, and a low of $79.00.
More details about CVS Health Corp (CVS)
Company Specific Risks:
- Eight-Day Downward Trend and Market Underperformance: CVS Health shares completed an eight-consecutive-session decline, dropping over 9% in recent weeks as institutional investors reduce exposure due to near-term margin headwinds and mounting sector-wide uncertainty.
- Elevated Medical Costs and Insurance Reimbursement Squeeze: Persistent healthcare utilization trends in the Aetna insurance segment and ongoing reimbursement price cuts across PBM and government channels threaten operating margins, with concerns that upcoming Medicare Advantage payment updates will fail to offset underlying medical expense inflation.
- Omnicare Legal Settlement and Bankruptcy Liquidation: A Texas bankruptcy court recently approved a wind-down plan for CVS subsidiary Omnicare, finalizing a $440 million settlement with the Department of Justice over improper billing allegations and adding legal compliance overhangs to the broader enterprise.
- Front-Store Sales Slowdown and Consumer Discretionary Softness: Retail same-store front-store growth has decelerated to just 1% year-over-year, exposing the Pharmacy & Consumer Wellness business to reduced foot traffic, persistent inflation, and rising competition from discount grocers and online platforms.
Recommended Articles


