


Bitcoin Price Forecast: BTC under pressure as MSCI removes Strategy from global indexes, puts billions in fund flows at risk
- Bitcoin remains under pressure, trading below $73,800 on Thursday, extending losses of over 1.5% so far this week.
- Index provider MSCI announced on Wednesday that it will drop Strategy from global indexes.
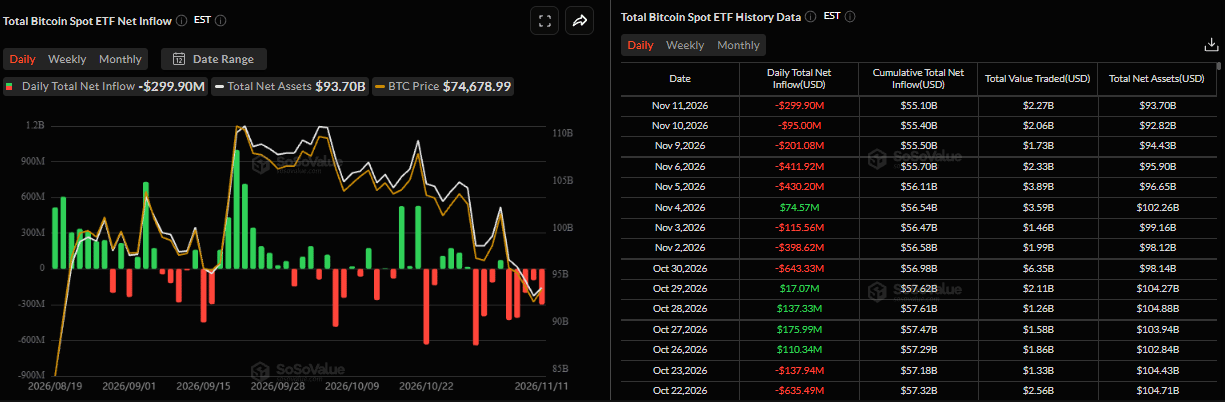
- US-listed BTC spot ETFs recorded an outflow of $299.90 million on Wednesday, marking the fifth straight day of withdrawals.
Bitcoin (BTC) remains under pressure, trading below $73,800 on Thursday after correcting over 1.5% so far this week. Bearish sentiment grew after news on Wednesday that MSCI, the global index provider, announced it will drop Strategy (MSTR) and other BTC-holding companies from global indexes, putting billions in fund flows at risk. Meanwhile, institutional demand has continued to weaken this week, with spot Exchange Traded Funds (ETFs) recording nearly $300 million in outflows on Wednesday, marking the fifth straight day of withdrawals and capping the Crypto King’s recovery.
Strategy’s deletion risks billions in outflows
On Wednesday, MSCI, the global index provider, announced its decision to remove Strategy from its global indexes. Strategy, the largest corporate holder of Bitcoin, currently holds 850,364 BTC.
The decision means that index funds tracking the affected benchmarks may need to sell their Strategy shares by November 30 to reflect the changes in their portfolios. Although MSCI’s decision directly affects Strategy’s stock rather than its Bitcoin holdings, the consequences could extend to the cryptocurrency given the company’s position as the largest Bitcoin treasury.
Tokyo-listed Metaplanet, which also accumulates and holds Bitcoin, and UK-based uranium investment company Yellow Cake were also included in the exclusion list. The companies will be removed from the MSCI USA and MSCI World indexes effective December 1.
These potential forced share sales could weigh on these BTC-holding companies’ stock and indirectly affect BTC sentiment. As these companies serve as an institutional gateway to BTC exposure, sustained selling pressure on their shares could undermine investor confidence in corporate Bitcoin treasury strategies and add another headwind to BTC’s recovery.
Institutional demand weakens
Institutional demand for Bitcoin has continued to weaken so far this week. SoSoValue data shows BTC spot ETFs recorded net outflows of $299.90 million on Wednesday, marking the fifth straight day of withdrawals since last week. If this outflow trend continues and intensifies throughout this week, it could put additional pressure on BTC, pushing its price into a deeper correction.
Nasdaq recovery holds the key to Bitcoin’s next move
Bitcoin continues to underperform the Nasdaq, highlighting a notable divergence between the two risk-sensitive assets so far this week. On Monday, the Nasdaq rallied 3.55%, while BTC gained just 0.69%. The divergence persisted on Wednesday, with the technology-heavy index rising nearly 2%, compared with Bitcoin’s modest 0.30% advance.
According to a report by K33, Bitcoin’s subsequent 20-day performance followed the Nasdaq’s direction in all five observed instances. Expanding the sample to 16 strong Nasdaq rebounds following market corrections, BTC recorded gains in eight of nine instances where the Nasdaq continued higher (Figure 15), with a median return of 2.9%. However, when the Nasdaq’s rebound failed, Bitcoin declined in all seven instances (Figure 16), recording a median loss of 21%. Bitcoin’s near-term outlook therefore appears heavily dependent on whether the Nasdaq can sustain its recovery.
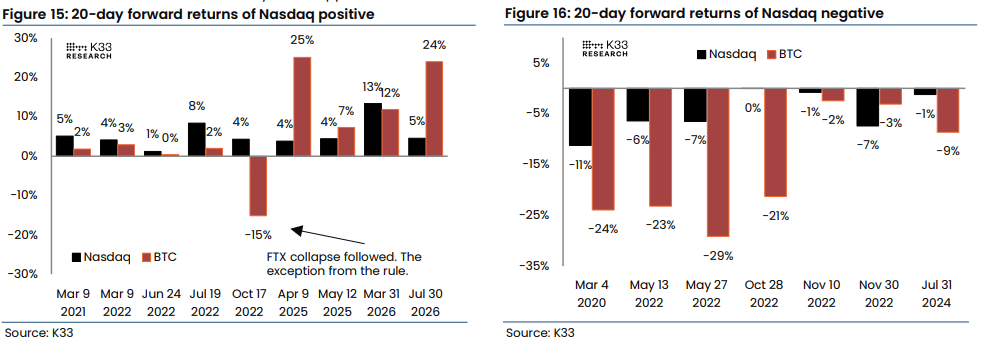
So far this week, the technology-heavy index has recovered nearly all its losses from last week, while Bitcoin has declined 1.5% over the same period. This divergence highlights Bitcoin’s relative weakness despite improving risk appetite in equities. If the Nasdaq’s recovery fails, historical observations suggest that BTC could face considerably deeper losses than the technology index.
Conversely, a sustained rebound in equities could support Bitcoin, although its recent underperformance suggests that a recovery in risk appetite may not immediately translate into a stronger BTC rebound.
Bitcoin technical outlook: Bears remain strong
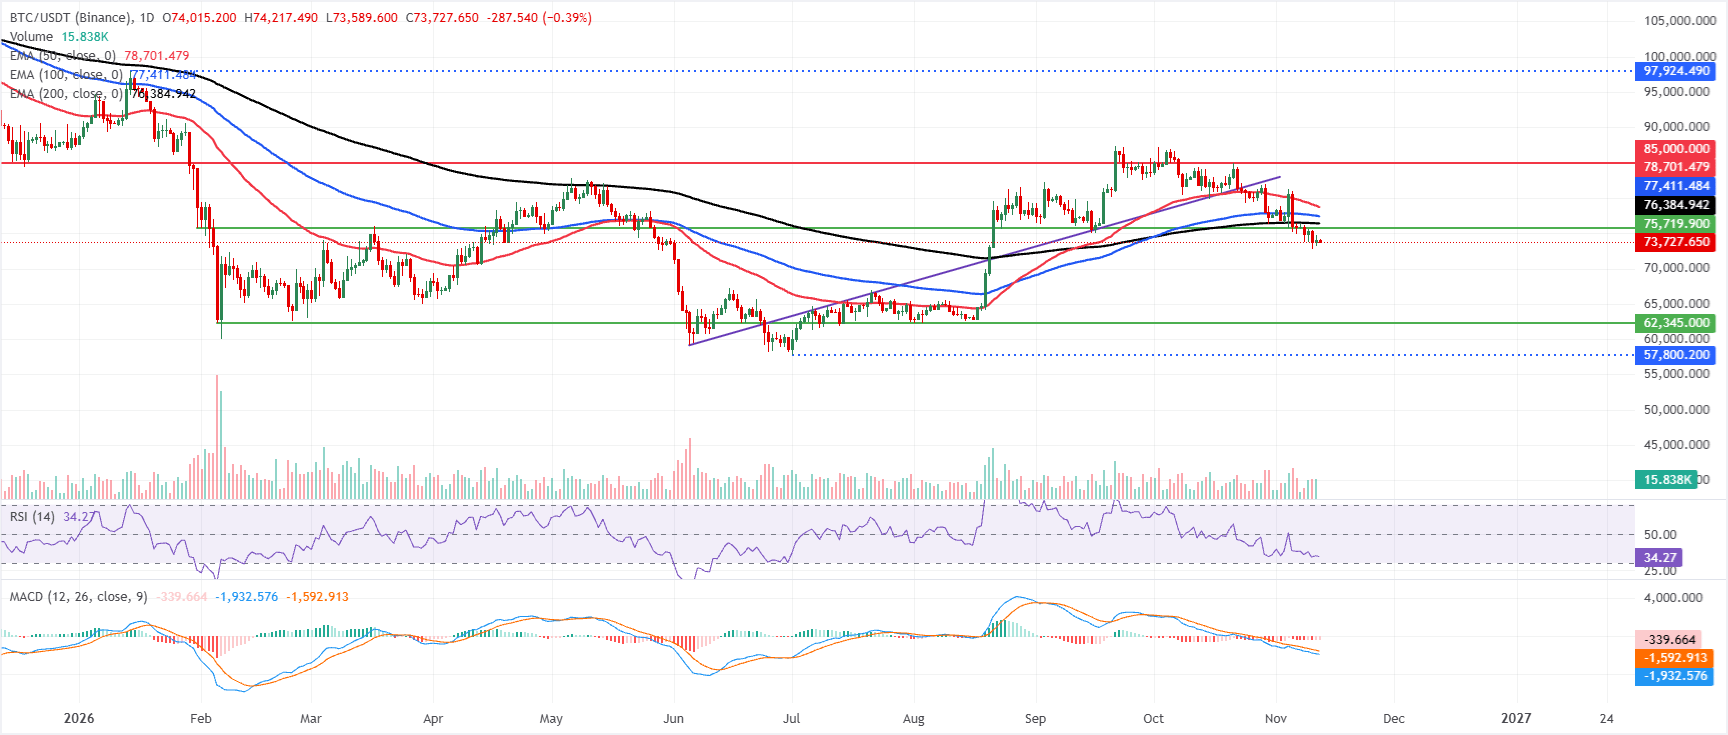
Bitcoin trades at $73,727 on Thursday, maintaining a bearish near-term bias as it holds below key Exponential Moving Averages. The 200-day EMA at $76,384, the 100-day EMA at $77,411 and the 50-day EMA at $78,701 all sit overhead, suggesting that the recent rebound remains capped within a broader corrective phase.
Momentum reinforces this tone, with the Relative Strength Index (RSI) hovering near 34 and the Moving Average Convergence Divergence (MACD) indicator still negative, hinting that sellers retain the upper hand despite intermittent bounces.
On the topside, immediate resistance sits at the 200-day EMA around $76,384, followed by the 100-day EMA near $77,411 and the 50-day EMA at about $78,701, which together form a dense barrier bulls would need to reclaim to ease downside pressure. A more substantial hurdle emerges at the horizontal resistance level of $85,000, where prior supply could reassert itself.
On the downside, the lack of nearby mapped support suggests that any break below current levels would send BTC toward the psychological support zone around $70,000 before stabilizing.
(The technical analysis of this story was written with the help of an AI tool. Know more.)
Bitcoin, altcoins, stablecoins FAQs
Bitcoin is the largest cryptocurrency by market capitalization, a virtual currency designed to serve as money. This form of payment cannot be controlled by any one person, group, or entity, which eliminates the need for third-party participation during financial transactions.
Altcoins are any cryptocurrency apart from Bitcoin, but some also regard Ethereum as a non-altcoin because it is from these two cryptocurrencies that forking happens. If this is true, then Litecoin is the first altcoin, forked from the Bitcoin protocol and, therefore, an “improved” version of it.
Stablecoins are cryptocurrencies designed to have a stable price, with their value backed by a reserve of the asset it represents. To achieve this, the value of any one stablecoin is pegged to a commodity or financial instrument, such as the US Dollar (USD), with its supply regulated by an algorithm or demand. The main goal of stablecoins is to provide an on/off-ramp for investors willing to trade and invest in cryptocurrencies. Stablecoins also allow investors to store value since cryptocurrencies, in general, are subject to volatility.
Bitcoin dominance is the ratio of Bitcoin's market capitalization to the total market capitalization of all cryptocurrencies combined. It provides a clear picture of Bitcoin’s interest among investors. A high BTC dominance typically happens before and during a bull run, in which investors resort to investing in relatively stable and high market capitalization cryptocurrency like Bitcoin. A drop in BTC dominance usually means that investors are moving their capital and/or profits to altcoins in a quest for higher returns, which usually triggers an explosion of altcoin rallies.
Recommended Articles


