


Bitcoin Bull Score falls to 20 as USDT supply shrinks – CryptoQuant
- Bitcoin’s Bull Score Index falls to 20 as multiple market indicators turn bearish, raising concerns about a deeper correction.
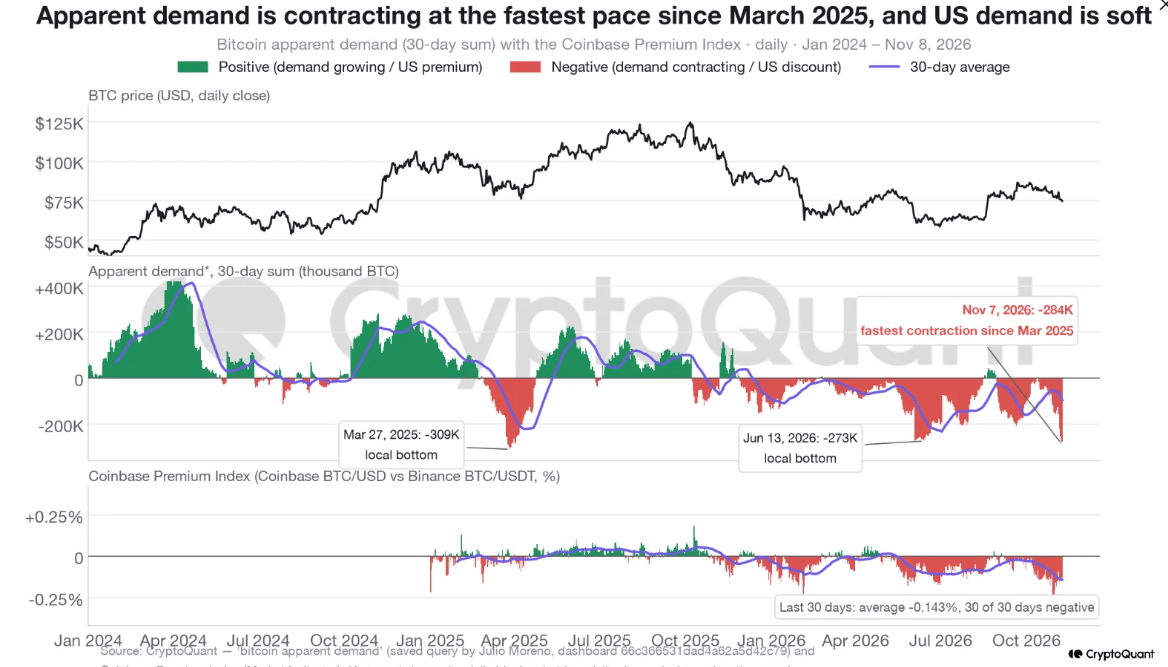
- The top crypto's apparent demand contracted by 284,000 BTC over 30 days, marking its fastest decline since March 2025.
- Tether's USDT market cap fell $6.6 billion over 60 days, recording its largest contraction since mid-2022.
Bitcoin's (BTC) market indicators have turned bearish at the same time, raising concerns that the top crypto could face a deeper correction despite historical similarities to previous market bottoms.
Bitcoin Bull Score Index drops to lowest level since April 2025
In a report published Wednesday, CryptoQuant noted that its Bull Score Index dropped from 90 on October 13 to 20 in less than four weeks, reflecting a sharp deterioration in market conditions.
The last comparable decline occurred in April 2025, following a tariff-related market sell-off. At the time, the index also fell to 20 before recovering to 80 within two months as Bitcoin established a local bottom.
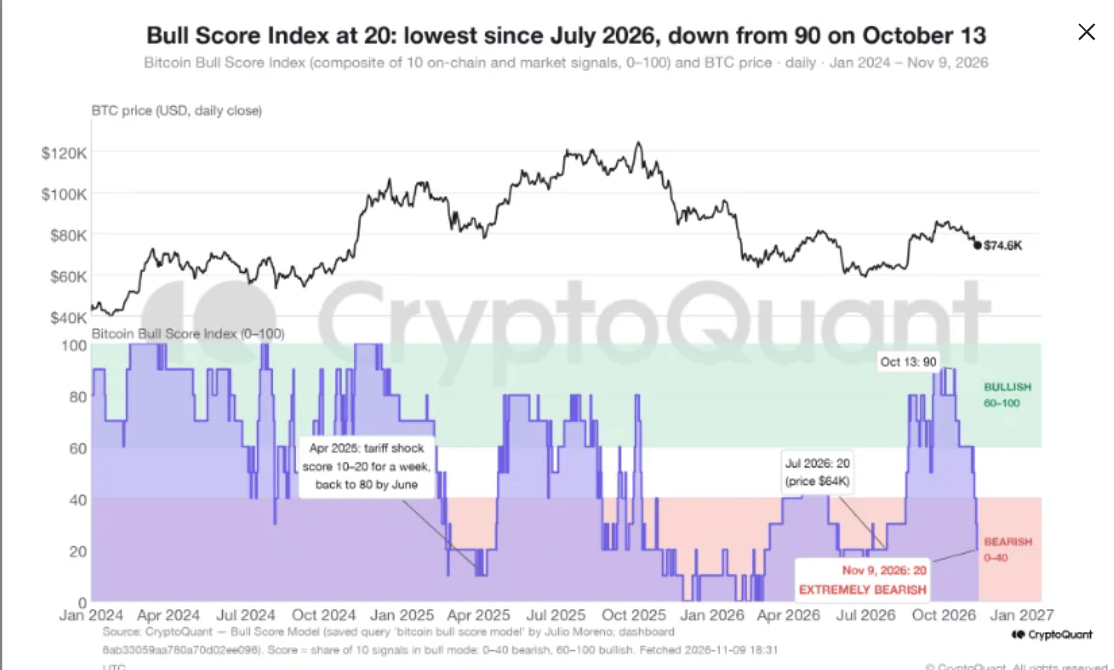
The firm warned that the current downturn has several contributing factors, including profit-taking following September's rally, a more hawkish Federal Reserve (Fed) outlook, the Binance hack and Republicans' midterm defeat.
"The April 2025 collapse had a single cause and reversed as soon as the tariff news faded. This one is broader, which argues for a slower repair," the report stated.
Bitcoin's apparent demand also contracted by 284,000 BTC over 30 days, marking its fastest decline since March 28, 2025. CryptoQuant noted that similar contractions in March 2025 and June-July 2026 coincided with local market bottoms. The March 2025 contraction reached 309,000 BTC, while the June 2026 drop reached 273,000 BTC.
The firm highlighted a lack of US buying pressure as a potential obstacle to recovery, with the Coinbase Premium Index remaining negative over the past 30 days and averaging -0.14%.
"In both earlier episodes the premium turned positive before or as demand recovered; US buyers led the bottom. That has not happened yet," CryptoQuant wrote.
Stablecoin liquidity is also deteriorating, with Tether's USDT market cap falling by $6.6 billion over 60 days. CryptoQuant said this is the largest contraction in its available data, which dates back to mid-2022.
The decline also exceeds the $3.2 billion contraction recorded in December 2022 following the FTX collapse.
"This is the first time in the current cycle that USDT supply, apparent demand and the Bull Score have all been at or near their lows at once," the firm noted.
CryptoQuant warned that the decline in stablecoin supply could weaken the possibility of Bitcoin's recovery, as rallies during the current cycle have relied on stablecoin growth for fresh liquidity.
“Stablecoin supply is the dry powder of the crypto market; when it shrinks, new demand for Bitcoin has to come from somewhere else,” CryptoQuant noted.
Bitcoin falls below key 365-day moving average
Bitcoin has also fallen below its 365-day moving average of $76,400, a move which CryptoQuant considers a bearish signal. The 200-day moving average at $73,200 is now the next important support level. The firm noted that reclaiming the 365-day average would help restore Bitcoin's bullish market structure.
“The 365-day average is itself declining, falling about $40 a day, so reclaiming it gets slightly easier each week the price holds,” CryptoQuant wrote.
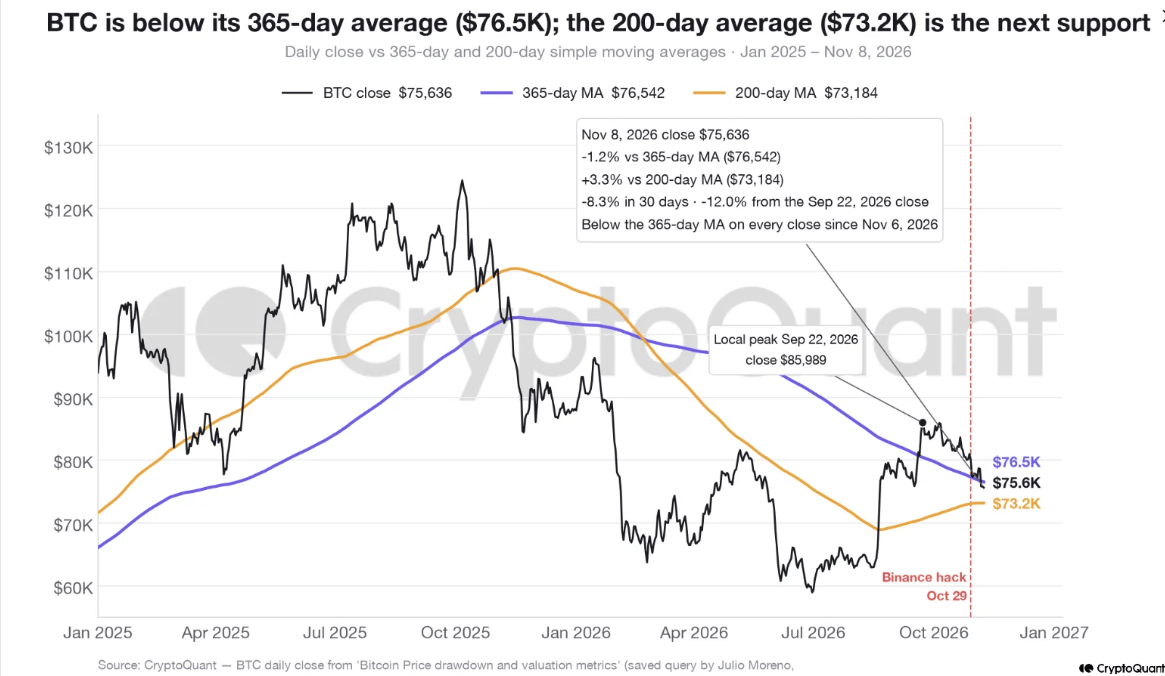
CryptoQuant warned that a sustained decline toward or below the 200-day average could strengthen the case for a deeper correction.
“The 200-day moving average at $73.2K is the level that separates a shallow correction from a deeper one,” the report added.
Bitcoin is trading at $74,400, up 1.3% in the past 24 hours at the time of writing.
Recommended Articles


