

Ripple and Stellar outlook: XRP and XLM extend losses as bears hold strong

Source Fxstreet
  • XRP extends losses, trading below $1.093 on Tuesday, with bears aiming for the $1.00 psychological level.
  • XLM trades around $0.146 after closing below key support last week, increasing downside risk.
  • Weakening on-chain activity, deteriorating derivatives metrics and bearish momentum indicators suggest further losses for XRP and XLM.

Ripple (XRP) and Stellar (XLM) remain under pressure, trading below $1.093 and around $0.146 respectively on Tuesday as bears maintain control of momentum. In addition, weakening on-chain and derivatives metrics suggest that both XRP and XLM are at risk of a deeper correction in the coming days.

Weakening on-chain metrics

CryptoQuant’s summary data shows a bearish outlook for both altcoins. XRP’s spot and futures markets show large whale orders and sell-side dominance. In addition, the spot market shows heating conditions, highlighting a bearish, cautious sentiment bias among Ripple traders.
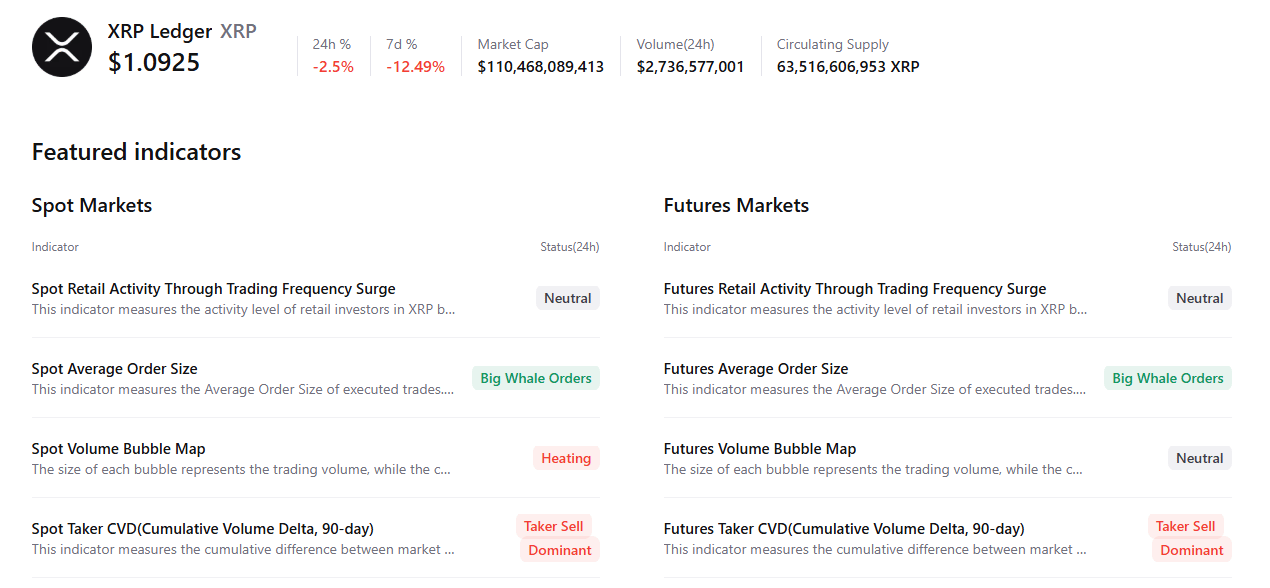
XRP summary chart. Source: CryptoQuant

For XLM, spot and futures markets show sell-side dominance, indicating a negative outlook among Stellar traders.
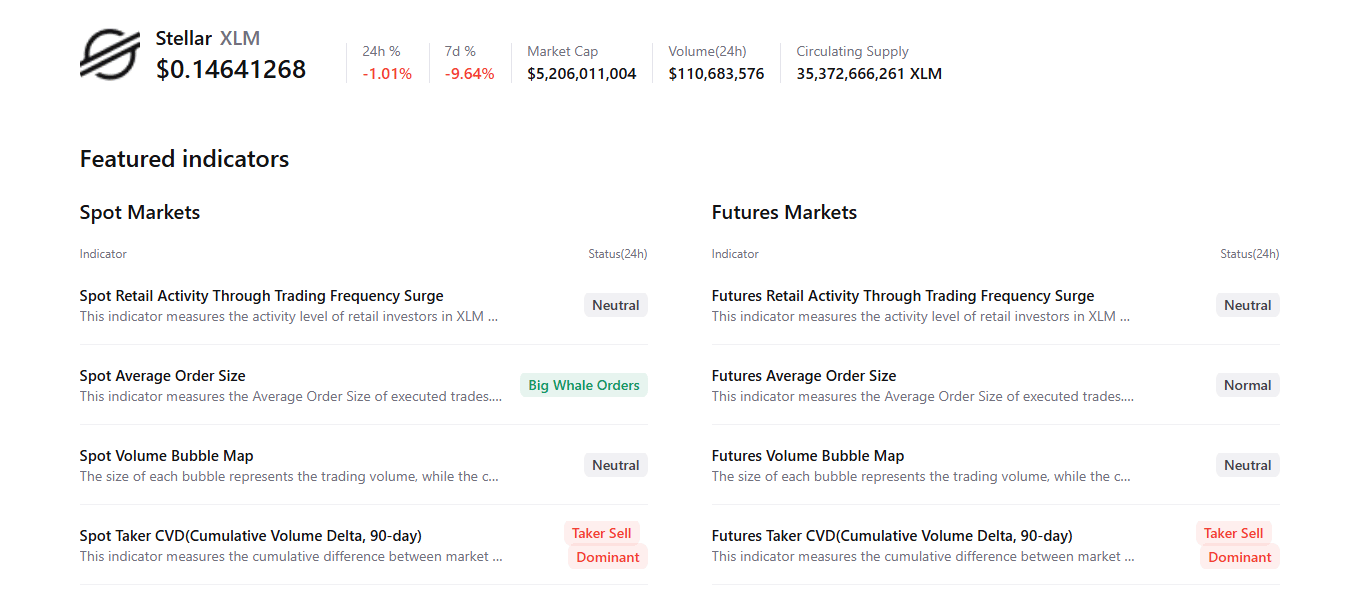
XLM summary chart. Source: CryptoQuant

Derivatives metrics also show a mixed outlook. CoinGlass’ long-to-short ratio for XRP flipped into positive territory, reading 1.02 on Tuesday, indicating a modest bullish outlook.

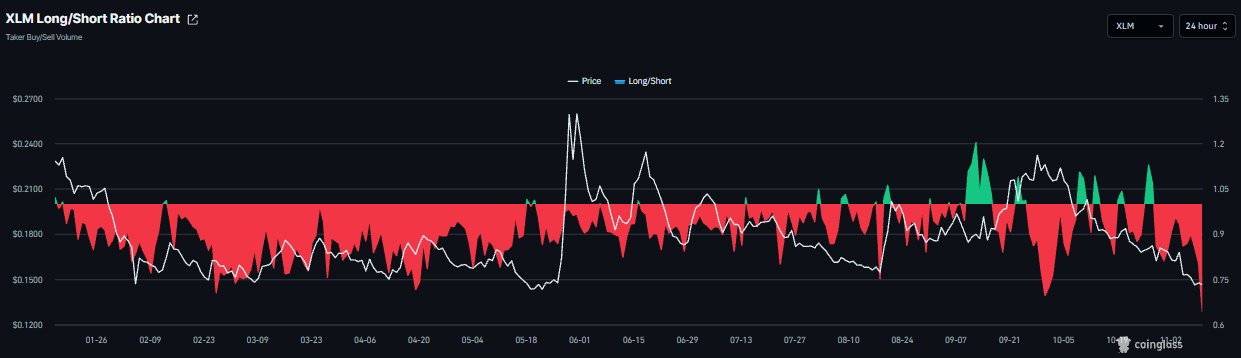
Meanwhile, XLM’s long-to-short ratio remained in negative territory, reading 0.64 on Tuesday, the lowest level over a month. A ratio below one indicates bearish sentiment, as traders bet that asset prices will fall.
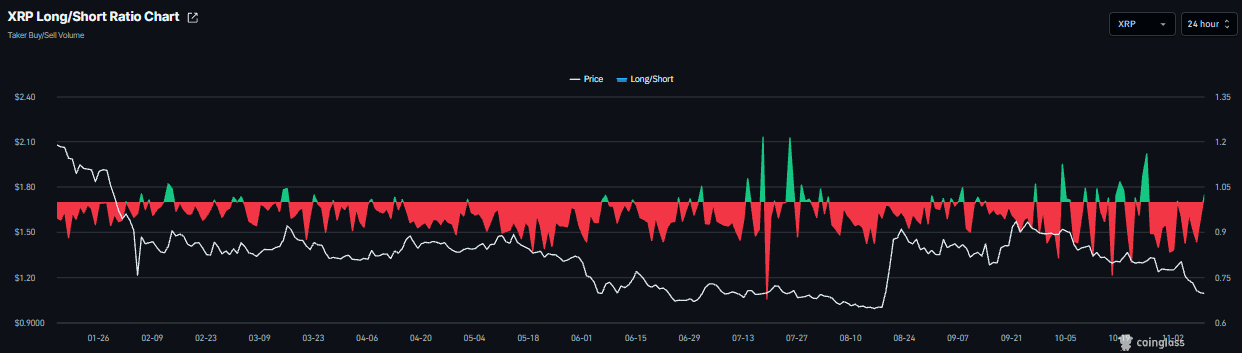
XRP long-to-short ratio chart. Source: Coinglass
XLM long-to-short ratio chart. Source: Coinglass

XRP technical outlook: XRP risks further losses as bears eye $1

XRP price trades at $1.093 on Tuesday, extending a bearish phase as it holds well below the 50-day, 100-day, and 200-day Exponential Moving Averages (EMAs) clustered between roughly $1.290 and $1.370.

The Relative Strength Index (RSI) sits deep in oversold territory near 26. At the same time, the Moving Average Convergence Divergence (MACD) remains negative, suggesting selling pressure dominates, even if short-term bounces cannot be ruled out from stretched conditions.

On the topside, initial resistance emerges at $1.160, ahead of a dense cap where the 50-day EMA at $1.294 converges with the horizontal barrier at $1.300 and the 100-day EMA at $1.303. At the same time, the longer-term 200-day EMA at $1.365 reinforces the broader bearish structure, with further hurdles at $1.540 and $1.900.

On the downside, the next notable support sits at the psychological $1.000 area, where buyers may attempt to slow the decline if the current downtrend extends.
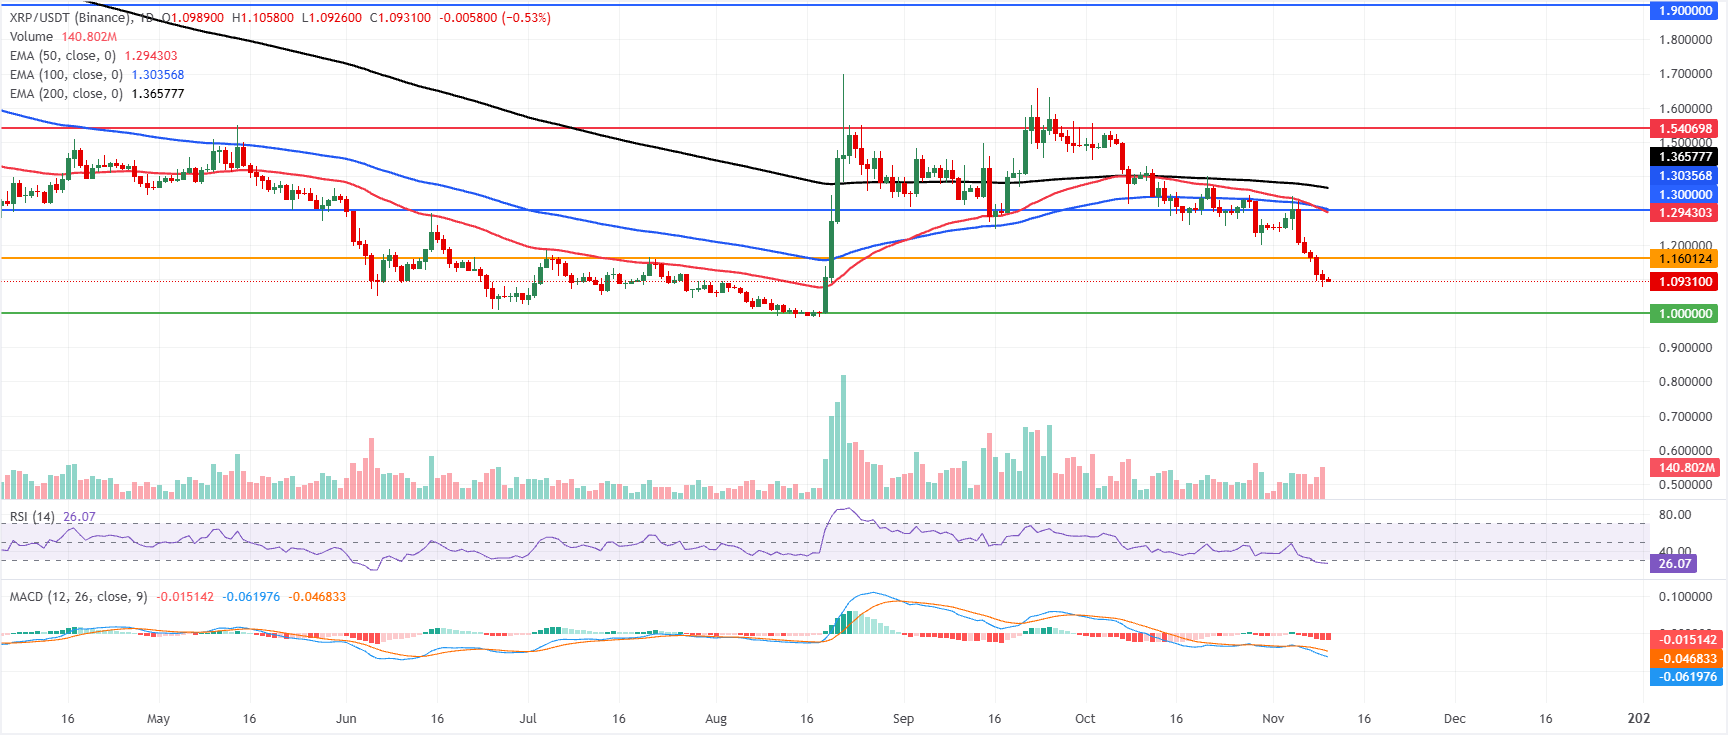
XRP/USDT daily chart

XLM technical outlook: Bears in control

XLM price trades at $0.146 on Tuesday, holding a bearish near-term bias, with price lodged beneath the 50-day, 100-day, and 200-day EMAs clustered between roughly $0.175 and $0.186, reinforcing a capped structure after a sustained slide from the $0.190 area.

The RSI near 30 hints at oversold conditions, while the MACD remains negative, suggesting downside momentum persists even as selling pressure may start to fatigue.

On the topside, initial resistance is at the prior horizontal barrier around $0.153, ahead of $0.173, where the 50-day EMA at $0.175 forms a nearby technical cap. Above that, the 100-day EMA at $0.180 and the 200-day EMA near $0.186 form a denser supply zone, with the next notable resistance only emerging at the higher horizontal level around $0.234.

On the downside, immediate support is located at the horizontal floor near $0.139, and a daily close below this level would expose the pair to a deeper retracement despite the already stretched momentum backdrop.
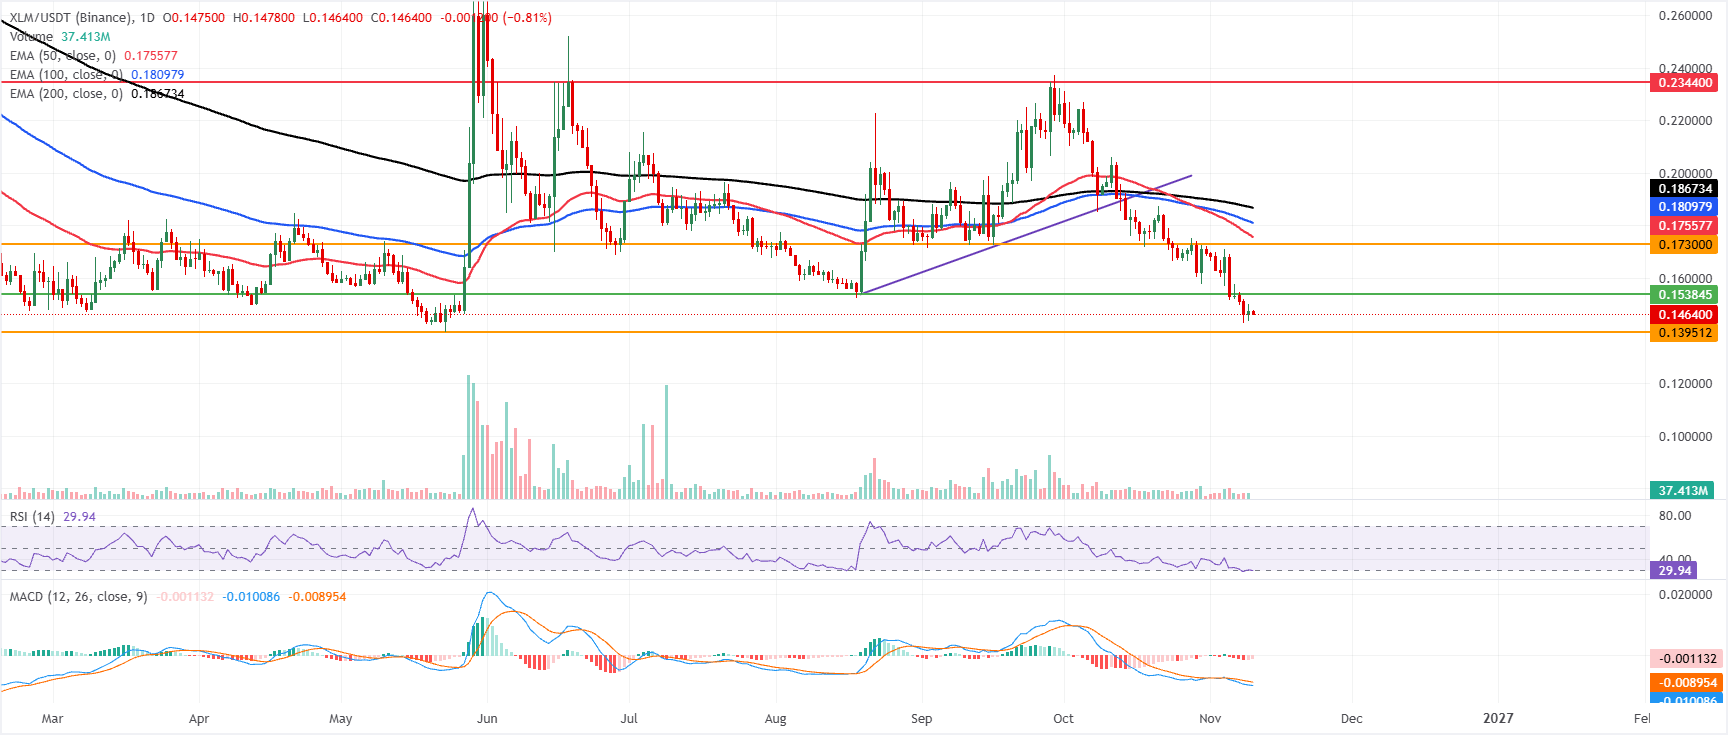
XLM/USDT daily chart

(The technical analysis of this story was written with the help of an AI tool. Know more.)

Disclaimer: For information purposes only. Past performance is not indicative of future results.
placeholder
Gold Price Analysis Today | Forex Gold Analysis | XAU/USD Analysis - November 11, 2026Get the latest gold price analysis, forex gold insights, and XAU/USD analysis for November 11, 2026. Read on for the details.
Author  Mitrade
Nov 11, Wed
Get the latest gold price analysis, forex gold insights, and XAU/USD analysis for November 11, 2026. Read on for the details.
placeholder
Bitcoin lost its 200-day average — but the exit started three sessions before the CPIBitcoin fell 2.5% to about $73,400 on 11 November, an 11-week low, breaking its 200-day moving average near $73,100. The 24-hour liquidation tally reached $632 to $705 million, roughly 82% of it longs. But spot ETF outflows began three sessions earlier and USDT's market cap has shrunk $6.6 billion in 60 days — the leveraged length left before the inflation print did. A double top at 81,890 and 81,080 leaves a measured target of 69,366.
Author  Suzie
Nov 11, Wed
Bitcoin fell 2.5% to about $73,400 on 11 November, an 11-week low, breaking its 200-day moving average near $73,100. The 24-hour liquidation tally reached $632 to $705 million, roughly 82% of it longs. But spot ETF outflows began three sessions earlier and USDT's market cap has shrunk $6.6 billion in 60 days — the leveraged length left before the inflation print did. A double top at 81,890 and 81,080 leaves a measured target of 69,366.
placeholder
Nvidia slid 7.7% after hours while AMD and Broadcom rose — the AI trade changed hands, it didn't breakNvidia closed Wednesday at 173.73, up 2.87%, then fell as much as 8.1% to 159.44 after reports that its board was preparing for a possible leadership change. The same session, the Philadelphia Semiconductor Index rose 5.7% with all 30 components higher, CoreWeave jumped 24.7% on 168% revenue growth, and Micron added 11.9%. If AI demand were being repriced, AMD and Broadcom would not be bid. This is a governance discount on one name, and 204.54 — the 200-day average — is the level that settles it.
Author  Irene Q.
Nov 12, Thu
Nvidia closed Wednesday at 173.73, up 2.87%, then fell as much as 8.1% to 159.44 after reports that its board was preparing for a possible leadership change. The same session, the Philadelphia Semiconductor Index rose 5.7% with all 30 components higher, CoreWeave jumped 24.7% on 168% revenue growth, and Micron added 11.9%. If AI demand were being repriced, AMD and Broadcom would not be bid. This is a governance discount on one name, and 204.54 — the 200-day average — is the level that settles it.
placeholder
Gold hit a one-year low while central banks bought 321 tonnes — the sellers were never the ones you thinkSpot gold closed at 3,876 on Thursday, down 2.8% and its lowest close in more than a year, with an intraday low near 3,852. The dollar is at a 19-month high of 103.21 and the 10-year yield is at 5.10%, so the price move is easy to explain. What is harder to explain is who sold: central banks bought 321 tonnes in Q3, the PBoC added for a 24th straight month, ETF holdings are near a record 4,256 tonnes, and roughly 95% of the futures selling came from non-reportable and sovereign-type accounts rather than hedge funds. This piece separates the two books that have to balance.
Author  Irene Q.
Yesterday 02: 40
Spot gold closed at 3,876 on Thursday, down 2.8% and its lowest close in more than a year, with an intraday low near 3,852. The dollar is at a 19-month high of 103.21 and the 10-year yield is at 5.10%, so the price move is easy to explain. What is harder to explain is who sold: central banks bought 321 tonnes in Q3, the PBoC added for a 24th straight month, ETF holdings are near a record 4,256 tonnes, and roughly 95% of the futures selling came from non-reportable and sovereign-type accounts rather than hedge funds. This piece separates the two books that have to balance.
placeholder
Brent rose 3.3% and US crude stocks built 4.66 million barrels in the same weekBrent January settled at 95.82, up 3.3%, and WTI at 88.74, up 2.55%, after the US signalled it would not pursue a deal with Iran and attacks on Gulf shipping continued. In the same week, EIA data showed US crude inventories rising 4.657 million barrels against expectations of a 1.1 million draw, with gasoline up another 1.799 million. OPEC output also rebounded 1.96 million barrels a day to 27.16 million in October, led by Saudi Arabia at 10.56 million. This piece separates the geopolitical premium from the physical balance and lays out where each side of the trade is anchored.
Author  Irene Q.
Yesterday 03: 06
Brent January settled at 95.82, up 3.3%, and WTI at 88.74, up 2.55%, after the US signalled it would not pursue a deal with Iran and attacks on Gulf shipping continued. In the same week, EIA data showed US crude inventories rising 4.657 million barrels against expectations of a 1.1 million draw, with gasoline up another 1.799 million. OPEC output also rebounded 1.96 million barrels a day to 27.16 million in October, led by Saudi Arabia at 10.56 million. This piece separates the geopolitical premium from the physical balance and lays out where each side of the trade is anchored.
Related Instrument
goTop
quote