


NEAR Protocol Forecast: Bearish move extends despite House of Stake issuance cut approval
- NEAR Protocol extends losses below $4 on Tuesday after a 10% decline the previous day.
- House of Stake, NEAR’s decentralized on-chain governance body, passes a proposal to reduce the annual issuance rate.
- The technical outlook for NEAR indicates a downside bias as selling pressure mounts.
NEAR Protocol (NEAR) trades below $4 on Tuesday, following a 10% loss the previous day and three consecutive weeks of decline. House of Stake, NEAR’s decentralized on-chain governance body, approved a proposal to reduce annual issuance on Monday, lowering long-term inflation and supply growth. The technical outlook for NEAR suggests further decline as sellers control the momentum.
NEAR Protocol strengthens tokenomics
NEAR protocol’s governing body, House of Stake, approved the HSP-029 proposal to phase down the maximum annual token issuance from 2.5% to 1.6% over 24 months. The implementation will go through a Security Council review, a 90-day grace period, and a protocol upgrade for validators. This decision will programmatically lower long-term inflation and supply growth.

Retail demand returns
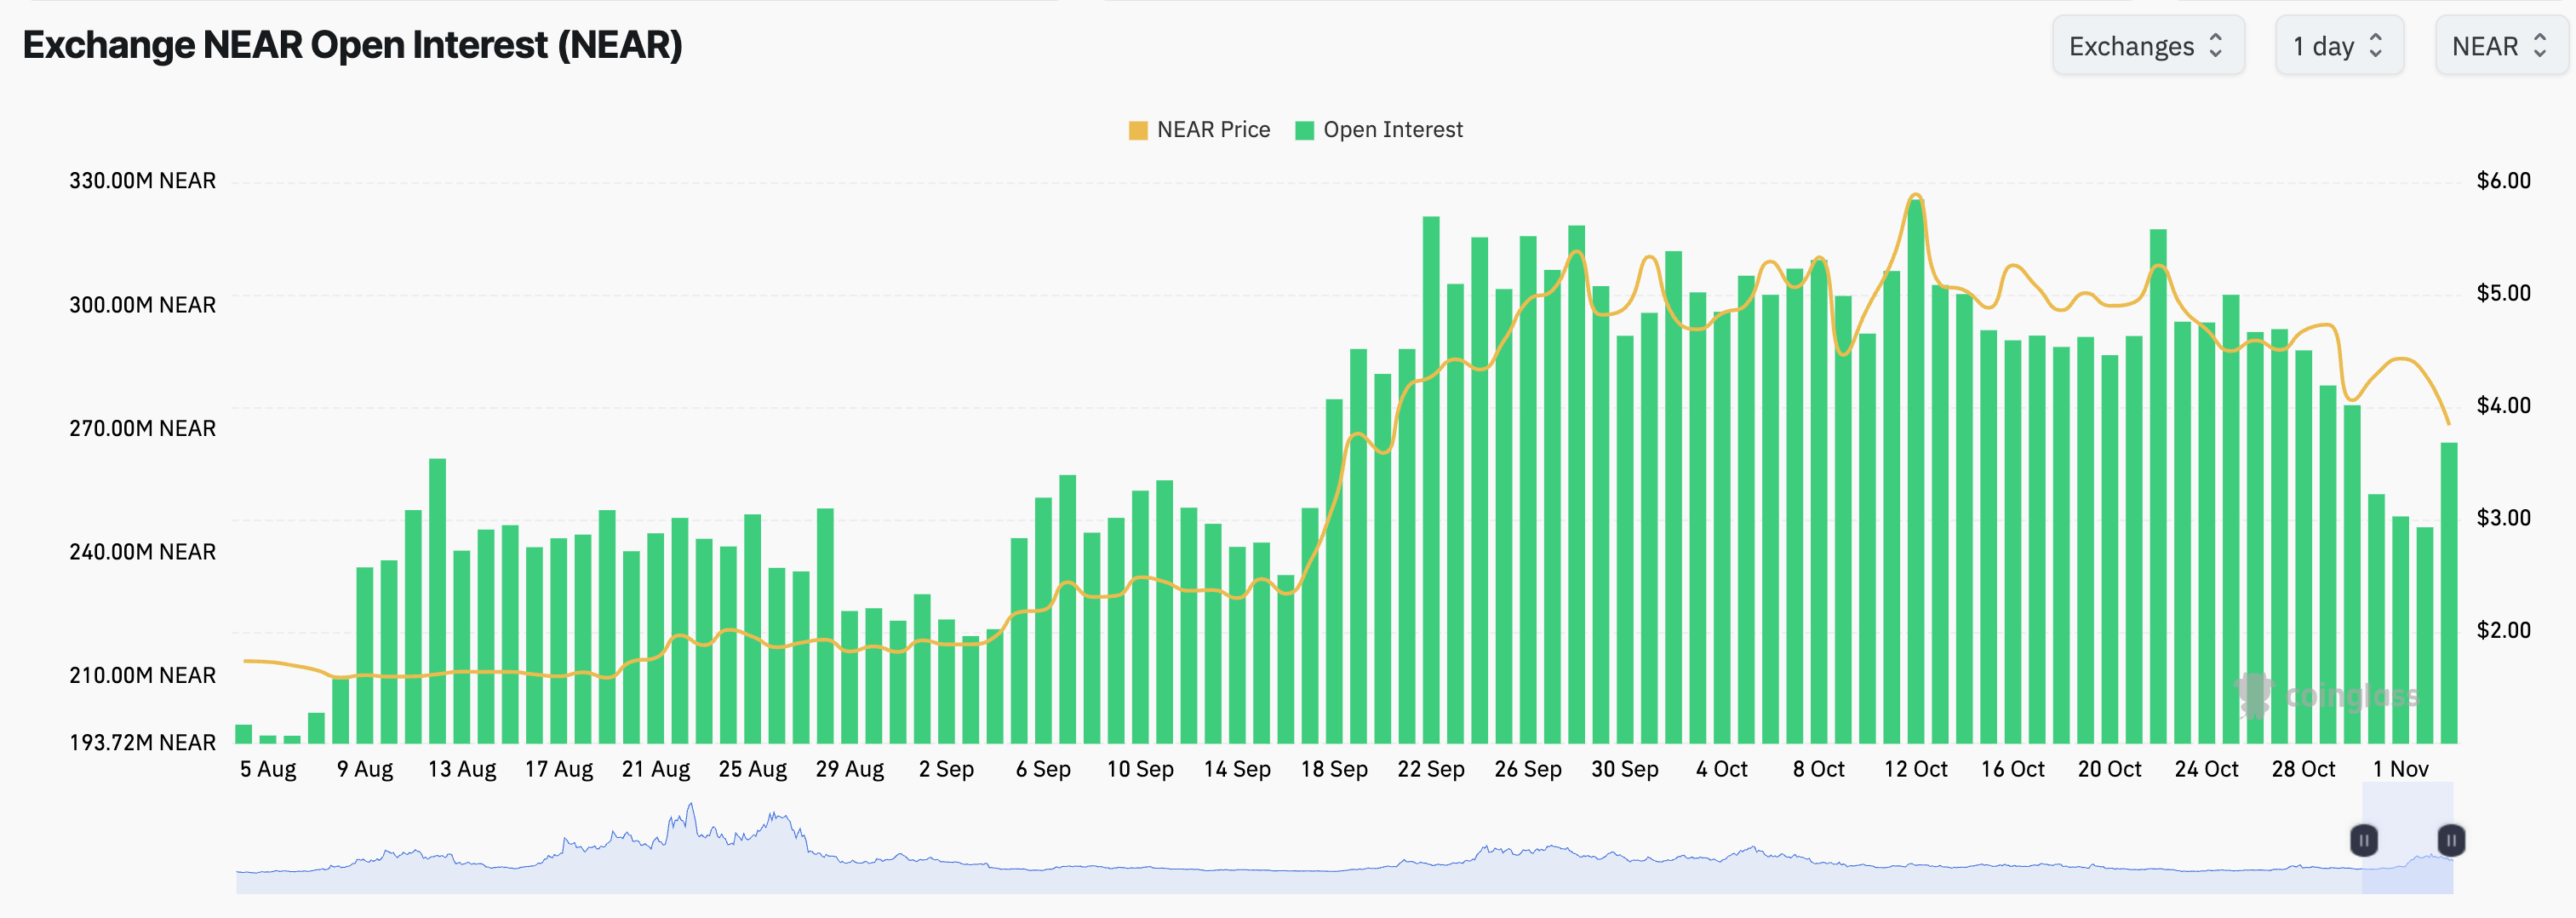
Retail interest in NEAR Protocol shows signs of building after a mild contraction phase. CoinGlass data shows the NEAR futures Open Interest at 266.81 million NEAR tokens on Tuesday, up from 246.27 million the previous day. The surge reflects a sharp recovery in fresh positional buildup, challenging the prevailing decline from the October 25 high of 302.69 million NEAR tokens. However, the OI growth amid the declining spot price implies that traders are anticipating further volatility.
Technical outlook: Will NEAR extend its decline?
NEAR token trades at $3.8270 at press time on Tuesday, indicating a bearish reversal on the four-hour chart. The price holds below both the 50- and 200-period Exponential Moving Averages (EMAs) at $4.3677 and $4.5235, respectively, maintaining a clear bearish bias. In addition, the 50-period EMA crosses below the 200-period EMA, reaffirming the bearish change in the near-term trend.
From a technical perspective, NEAR's decline is capped by a tight band of two parallel trendlines, forming a falling channel pattern on the same chart. The price approaches the lower-boundary trendline near $3.7303, guarding the downside toward the $3.4030 horizontal support set by the September 19 low.
Momentum is weak, with the Relative Strength Index (RSI) on the four-hour chart hovering around 26 in oversold territory and the Moving Average Convergence Divergence (MACD) deep in negative ground, hinting that downside pressure dominates.
On the topside, a potential rebound from the supporting trendline could test the support-turned-resistance level at $3.9160, followed by the $4.3010 level.
(The technical analysis of this story was written with the help of an AI tool. Know more.)
Recommended Articles


