

Cardano Price Forecast: ADA extends losses as sellers stay in control

Source Fxstreet
  • Cardano extends its losses, trading below $0.189 on Tuesday after closing below key support around $0.190 the previous day.
  • Mixed derivatives and cautious on-chain metrics continue to cap ADA bulls.
  • The technical outlook suggests further losses as sellers control the momentum.

Cardano (ADA) extends correction, trading below $0.189 on Tuesday after losing key support zone the previous day. Mixed derivatives data and cautious on-chain metrics continue to weigh on bullish sentiment, while weakening technical indicators suggest further downside risks for ADA.

Mixed sentiment caps Cardano recovery

Cardano derivatives data shows weakening, cautious conditions. CoinGlass’ long-to-short ratio for ADA reads 0.75 on Tuesday, nearing the lowest level over a month. A ratio below one indicates bearish sentiment, as traders bet that Cardano prices will fall.
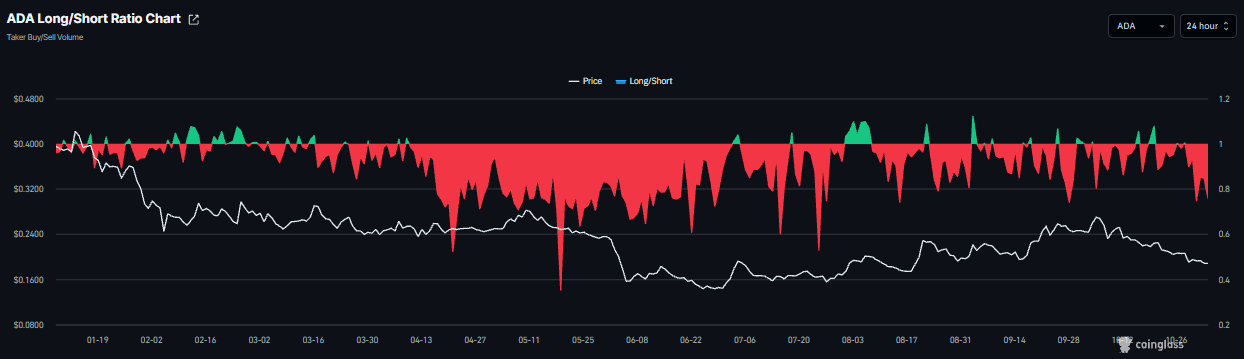
Cardano funding rates chart. Source: Coinglass

However, Cardano’s funding rates flipped positive to 0.0071% on Tuesday, indicating longs are paying shorts and suggesting a mildly bullish outlook.
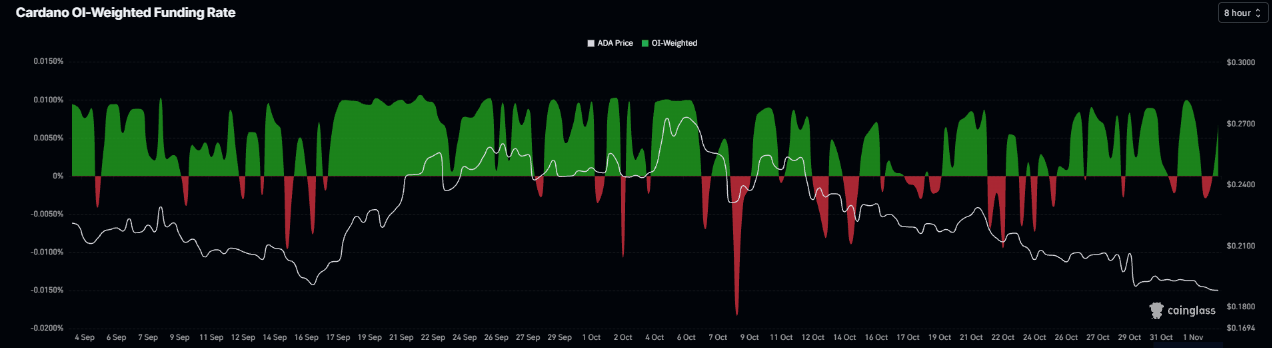
Cardano funding rates chart. Source: Coinglass

On-chain data shows caution signs

CryptoQuant’s summary data shows a cautious tone. ADA’s spot and futures markets show large whale orders, but with overheating conditions and sell-side dominance. These highlight a bearish, cautious sentiment bias among Cardano traders.
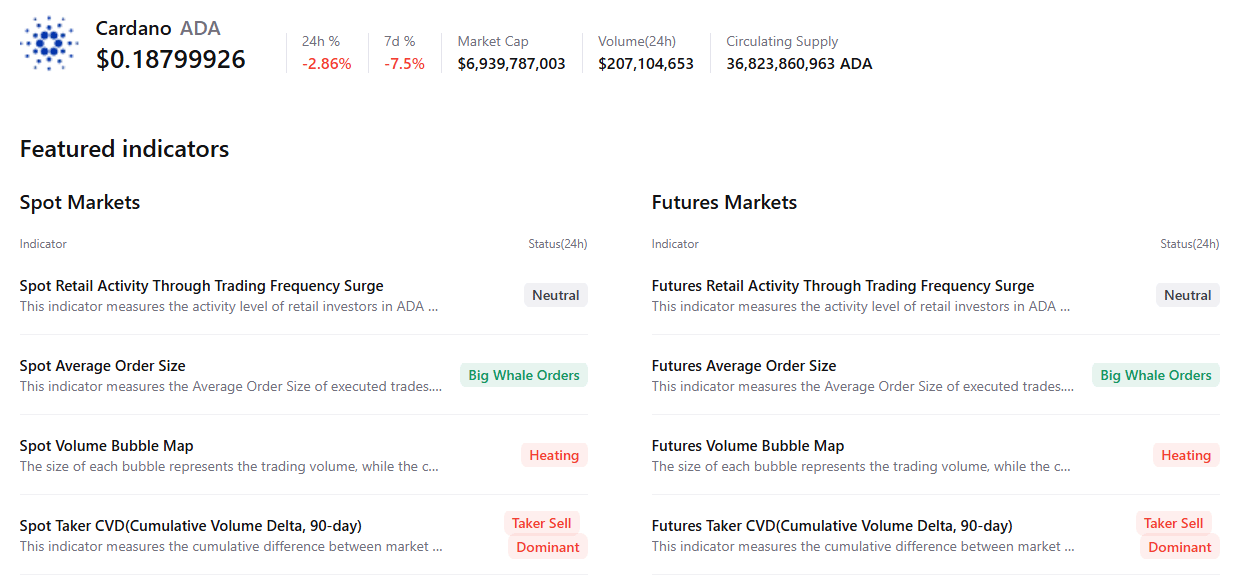
Cardano summary chart. Source: CryptoQuant

Cardano technical outlook: Sellers in control

Cardano price trades at $0.188 on Tuesday, extending its decline well below the short- and medium-term Exponential Moving Averages (EMAs), which keeps the near-term bias bearish. 

ADA has slipped under the former rising support trendline, now a barrier at $0.218, while the 100-day and 50-day EMAs at $0.215 and 0.216 add to the overhead supply zone.

The Relative Strength Index (RSI) hovers near 30, hinting at emerging oversold conditions, but the Moving Average Convergence Divergence (MACD) remains slightly negative, suggesting downside pressure remains dominant despite waning momentum.

On the topside, initial resistance is clustered around $0.215–$0.218, defined by the 100-day EMA, the 50-day EMA and the reclaimed uptrend line, ahead of further caps at $0.236 and the 200-day EMA near $0.239. Above these, horizontal barriers at $0.245 and $0.299 would come into play if a stronger corrective bounce develops.

On the downside, the key support to watch is the horizontal level of $0.155, where a clearer demand zone could emerge if the current bearish leg extends.
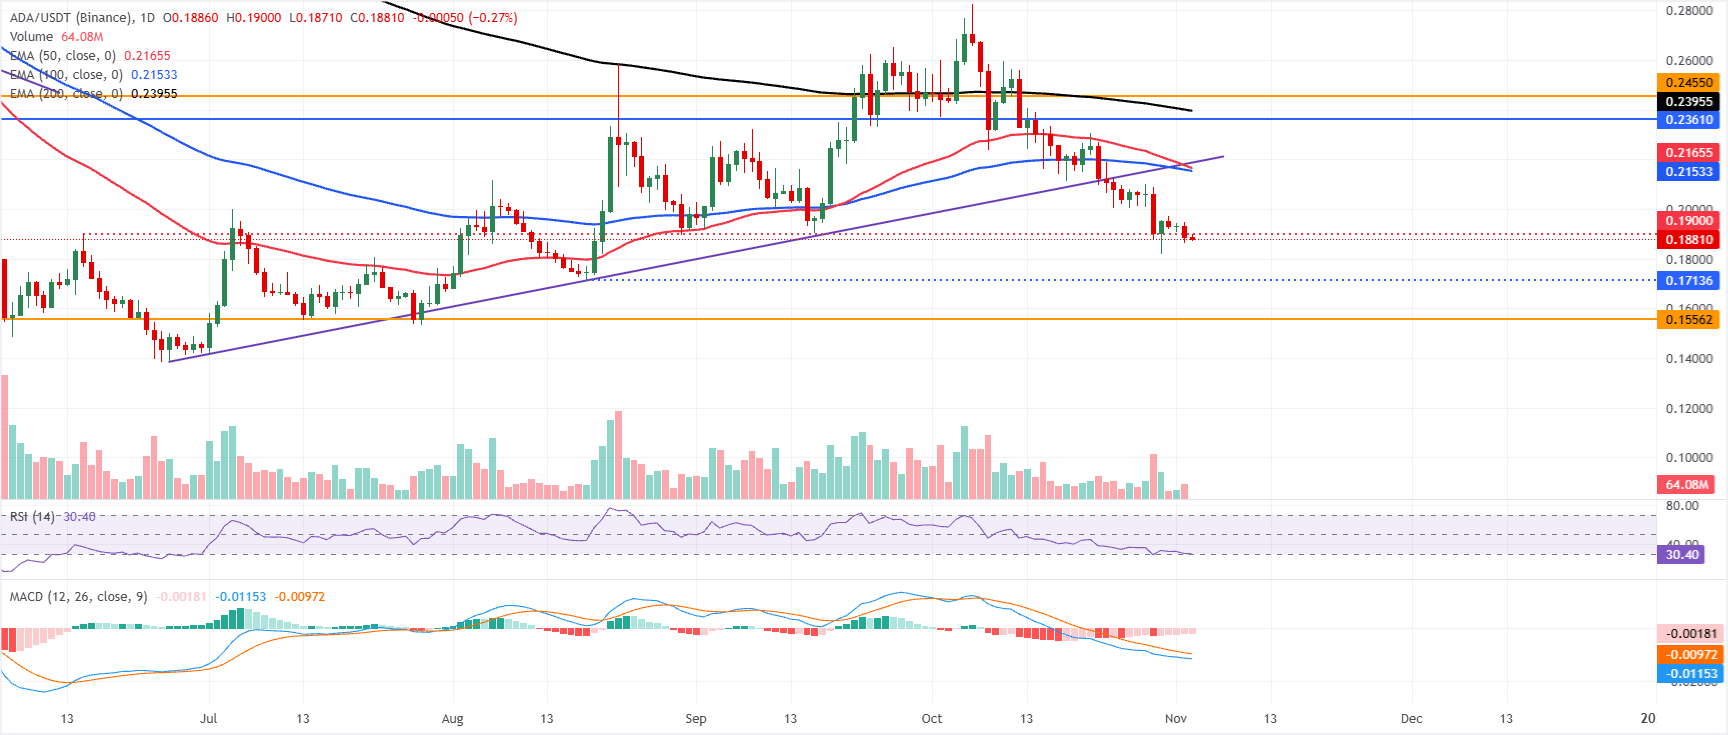
ADA/USDT daily chart

(The technical analysis of this story was written with the help of an AI tool. Know more.)

Disclaimer: For information purposes only. Past performance is not indicative of future results.
placeholder
Today’s Market Recap: Three Major US Indexes Plunge, Philadelphia Semiconductor Index Tumbles Over 7%, Oil Falls, Gold and Silver AdvanceWith the U.S. midterm elections approaching, the three major U.S. stock indices and the Philadelphia Semiconductor Index collectively suffered sharp falls last Frida
Author  TradingKey
Yesterday 01: 29
With the U.S. midterm elections approaching, the three major U.S. stock indices and the Philadelphia Semiconductor Index collectively suffered sharp falls last Frida
placeholder
Gold Price Analysis Today | Forex Gold Analysis | XAU/USD Analysis - November 2, 2026Get the latest gold price analysis, forex gold insights, and XAU/USD analysis for November 2, 2026. Read on for the details.
Author  Mitrade
Yesterday 02: 00
Get the latest gold price analysis, forex gold insights, and XAU/USD analysis for November 2, 2026. Read on for the details.
placeholder
Binance replaced 95% of a $6.3bn hole — Bitcoin is trading the plumbing, not the coinBinance resumed withdrawals on November 1 after a record $6.3bn theft. In the first 9.5 hours, users withdrew $4.64bn and deposited $1.01bn, a net outflow of $3.64bn, or 2.1% of assets. Bitcoin fell to 76,173 and is now 78,473. The market is pricing the exchange, not the supply.
Author  Suzie
Yesterday 02: 18
Binance resumed withdrawals on November 1 after a record $6.3bn theft. In the first 9.5 hours, users withdrew $4.64bn and deposited $1.01bn, a net outflow of $3.64bn, or 2.1% of assets. Bitcoin fell to 76,173 and is now 78,473. The market is pricing the exchange, not the supply.
placeholder
Brent slips to $111 as a two-day Hormuz plan lands — the supply-risk premium is the only thing being soldBrent fell 1.95% to $111.20 and WTI to $101.92 after Iran's foreign minister said a Qatar-brokered plan could reopen the Strait of Hormuz in two days. Two tankers were still reported hit by mines. The move is a premium unwind, not a supply change.
Author  Irene Q.
Yesterday 03: 02
Brent fell 1.95% to $111.20 and WTI to $101.92 after Iran's foreign minister said a Qatar-brokered plan could reopen the Strait of Hormuz in two days. Two tankers were still reported hit by mines. The move is a premium unwind, not a supply change.
placeholder
Gold Price Analysis Today | Forex Gold Analysis | XAU/USD Analysis - November 3, 2026Get the latest gold price analysis, forex gold insights, and XAU/USD analysis for November 3, 2026. Read on for the details.
Author  Mitrade
8 hours ago
Get the latest gold price analysis, forex gold insights, and XAU/USD analysis for November 3, 2026. Read on for the details.
Related Instrument
goTop
quote