

Ether Price Forecast: Foundation Sell-Off Breaks $2,300, Risks Further 13% Drop

Source Tradingkey

TradingKey - Foundation sell-off triggers selling pressure as ETH loses $2,300 critical line again, technicals signal potential 13% drop.

On October 26, under heavy pressure from market-wide high-leverage liquidations, Bitcoin (BTC) breaking below the $80,000 mark, and rising U.S. Treasury yields driven by hawkish Fed expectations, Ether (ETH) became the asset under the heaviest selling pressure in the major cryptocurrency sector, falling over 2% intraday and briefly losing the $2,300 level.

The most direct catalyst for Ether's decline this time was the Ethereum Foundation's ETH sell-off, which triggered panic selling in the market. According to on-chain data, the Ethereum Foundation sold approximately 2,800 ETH today via the decentralized exchange CoW Swap, receiving over $6 million worth of the stablecoin USDS.

In terms of capital scale, compared to ETH's market size of over $100 billion, the Ethereum Foundation's sell-off is negligible. However, under the current fragile market structure, it has added fuel to the fire. This Wednesday (October 28), the Federal Reserve will announce its latest interest rate decision. The market currently assigns a more than 90% probability to rates remaining unchanged, and a high-interest-rate environment increases the holding cost of non-yielding assets, driving global risk-averse capital out of the crypto market.

In addition, the indefinite postponement of the Glamsterdam upgrade originally scheduled for today on the Hoodi testnet further battered bullish market confidence. On October 22, Ethereum's core development team announced a suspension of public testing for the "Glamsterdam" scaling upgrade due to extreme smart contract security considerations, raising concerns among some short-to-medium-term swing capital over timeline delays and further weakening bulls' confidence in a rebound.

With rate cuts virtually off the table, Ether's price remains under downward pressure. From a technical perspective, Ether's price could fall another 13% to $2,000, a level that serves not only as a crucial psychological barrier but also coincides with the 200-day moving average and multiple bottom bases from the first half of the year.
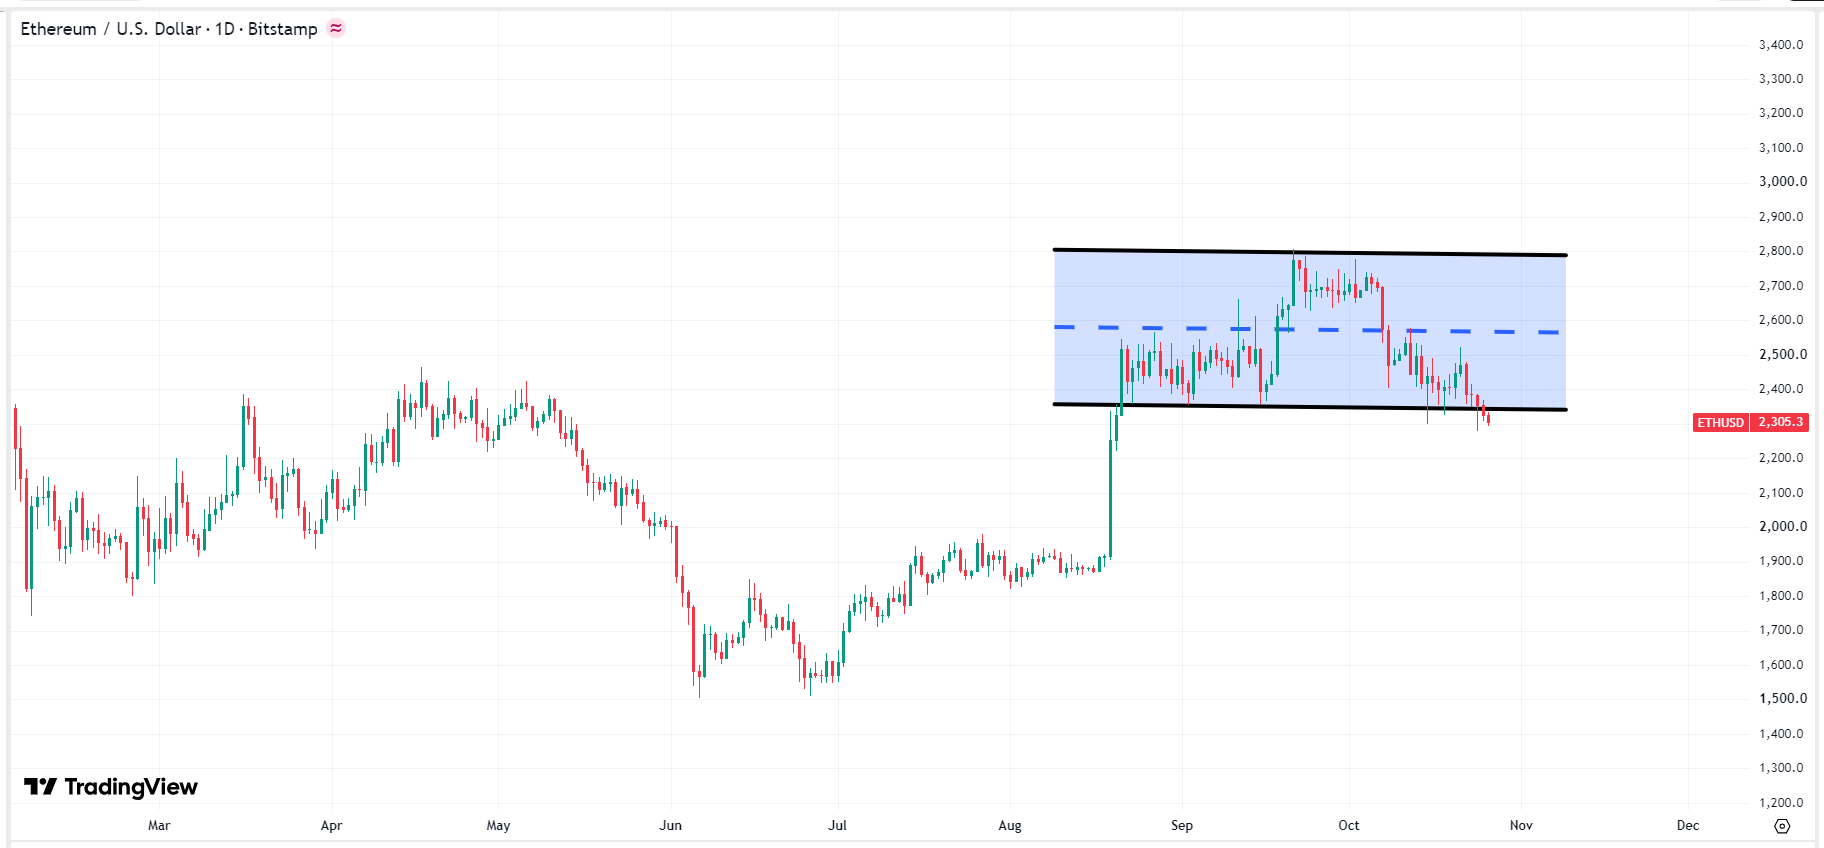
ethereum-eth-usd-price-4426ef6ce3374a829b0846f9752c8cf5ETH Price Chart, Source: TradingView

If ETH bulls can successfully build a bottom and halt the decline in the $2,300 region, combined with market sentiment recovery driven by U.S. tech earnings, ETH will immediately launch a rally to reverse the downward trend, fully defusing the near-term risk of further declines and laying a foundation for another push toward $2,800 by year-end.

Disclaimer: For information purposes only. Past performance is not indicative of future results.
placeholder
The Fed will sit still on October 28 — but 100 of 100 economists now expect a December hikeA Reuters poll run October 16-20 found 94 of 100 economists expecting the Fed to hold at 3.75-4.00% on October 28 — and all 100 expecting a hike in December, against less than half a month earlier. The market is close to the same price, with CME FedWatch at roughly 17% for October and 82.8% for December. With the Fed in blackout since October 17, here are the five dates that decide the rest of the year, what each one is priced for, and the two directions each can take.
Author  Irene Q.
Oct 22, Thu
A Reuters poll run October 16-20 found 94 of 100 economists expecting the Fed to hold at 3.75-4.00% on October 28 — and all 100 expecting a hike in December, against less than half a month earlier. The market is close to the same price, with CME FedWatch at roughly 17% for October and 82.8% for December. With the Fed in blackout since October 17, here are the five dates that decide the rest of the year, what each one is priced for, and the two directions each can take.
placeholder
Gold Price Analysis Today | Forex Gold Analysis | XAU/USD Analysis - October 23, 2026Get the latest gold price analysis, forex gold insights, and XAU/USD analysis for October 23, 2026. Read on for the details.
Author  Mitrade
Oct 23, Fri
Get the latest gold price analysis, forex gold insights, and XAU/USD analysis for October 23, 2026. Read on for the details.
placeholder
Nasdaq closes at 26,008.86 — 8.9 points above 26,000, and the credit market never blinkedThe Nasdaq Composite fell 2.60% to 26,008.86 on October 22, its worst session since June, as Meta sank 6.98% on 2026 capex guidance of $135–145 billion. But the equal-weight S&P 500 rose 0.73%, high-yield credit was flat and 10-year yields fell 20 basis points. This was an AI de-rating, not a risk-off event — here is the transmission chain, the 29,000 / 28,200 levels and what would prove it wrong.
Author  Irene Q.
Oct 23, Fri
The Nasdaq Composite fell 2.60% to 26,008.86 on October 22, its worst session since June, as Meta sank 6.98% on 2026 capex guidance of $135–145 billion. But the equal-weight S&P 500 rose 0.73%, high-yield credit was flat and 10-year yields fell 20 basis points. This was an AI de-rating, not a risk-off event — here is the transmission chain, the 29,000 / 28,200 levels and what would prove it wrong.
placeholder
Brent tops $113 on Saudi supply risk — but the diesel line in the EIA report is the tellBrent's December contract settled at $113.17 on October 22, up 4.00% and the highest close since May 4, after Saudi Arabia restricted refined-product shipments. The same session's EIA report showed crude stocks down 3.06 million barrels and gasoline down 2.95 million — but distillates built 1.68 million. That single line decides whether $113 holds: here are the data, the 108.8 / 114.0 / 119.3 levels and the two scenarios.
Author  Irene Q.
Oct 23, Fri
Brent's December contract settled at $113.17 on October 22, up 4.00% and the highest close since May 4, after Saudi Arabia restricted refined-product shipments. The same session's EIA report showed crude stocks down 3.06 million barrels and gasoline down 2.95 million — but distillates built 1.68 million. That single line decides whether $113 holds: here are the data, the 108.8 / 114.0 / 119.3 levels and the two scenarios.
placeholder
Gold Price Analysis Today | Forex Gold Analysis | XAU/USD Analysis - October 26, 2026Get the latest gold price analysis, forex gold insights, and XAU/USD analysis for October 26, 2026. Read on for the details.
Author  Mitrade
5 hours ago
Get the latest gold price analysis, forex gold insights, and XAU/USD analysis for October 26, 2026. Read on for the details.
goTop
quote