

Pi Network Price Forecast: PI defends key support as selling pressure eases

Source Fxstreet
  • Pi Network edges higher on Wednesday, holding above its near-term horizontal support around $0.0774.
  • Derivatives data shows PI futures Open Interest at $8.05 million, suggesting a buildup in active positions.
  • The technical outlook for PI is bearish, with the price risking a breakout and momentum indicators signaling neutrality.

Pi Network (PI) price is up 1% at press time on Wednesday, extending its rebound from the $0.0774 support level. A surge in PI futures Open Interest above $8 million reflects an early sign of renewed retail demand. The technical outlook for PI is mixed, as the consolidation range is under persistent downside pressure.

Retail demand holds firm amid Stellar Protocol v30 news

Pi Network’s derivatives data shows early signs of renewed retail demand. Blockworks data shows PI futures Open Interest rising to $8.05 million, up from $7.80 million the previous day, indicating an increase in the notional value of active positions. Typically, retail buildup signals increased anticipation of a rebound in a token’s price.
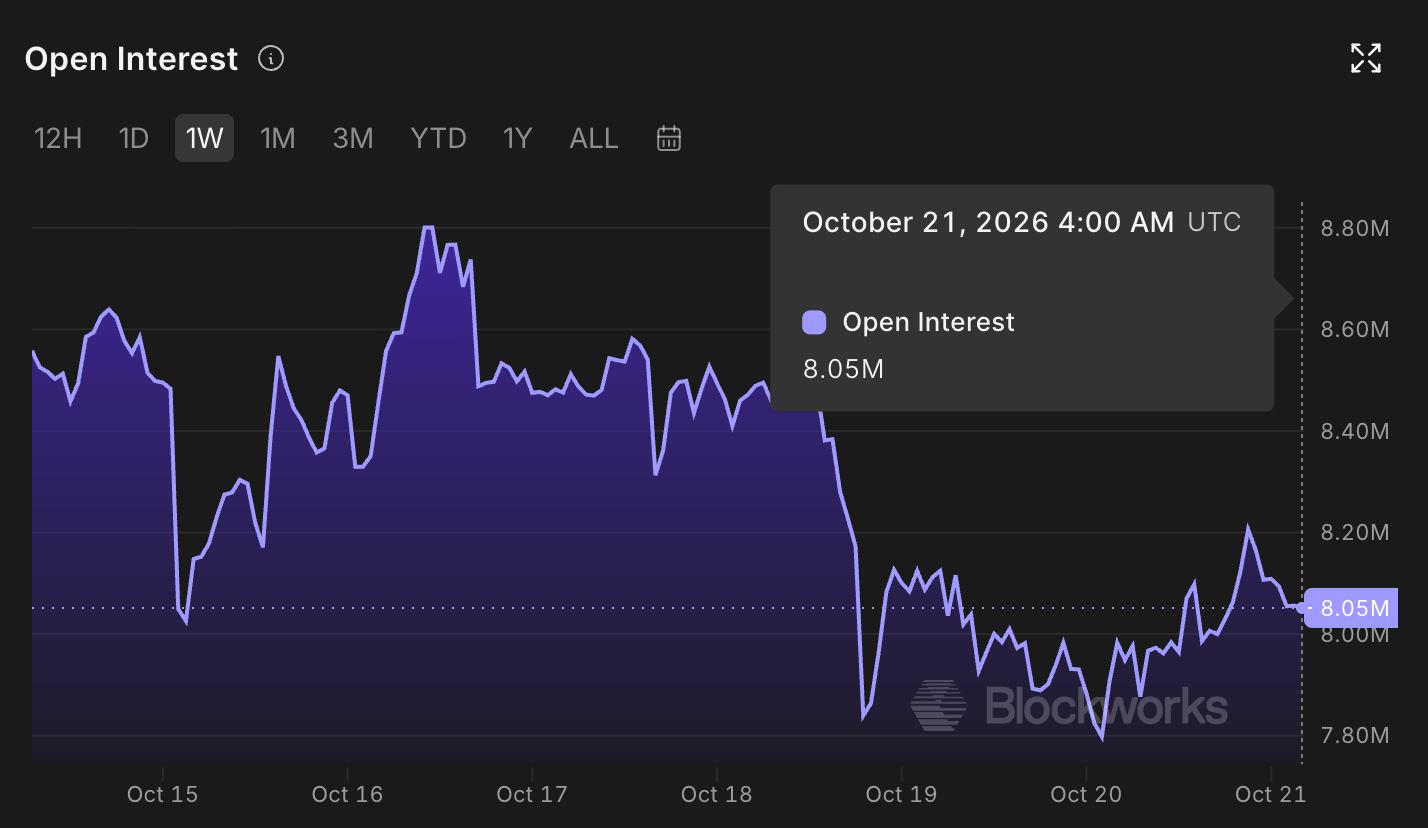
PI token Open Interest chart. Source: Blockworks

This shift in near-term retail outlook aligns with the announcement of Stellar’s new Protocol v30. Stellar Protocol, the underlying blockchain of Pi Network, announced the Protocol v30 upgrade on Wednesday. The Bell upgrade will introduce muxed addresses via CAP-84 and add post-quantum ML-DSA signature verification, reflecting steady development toward quantum security. 

As of Wednesday, Pi Network remains focused on activating Stellar Protocol v28 on its mainnet, and Stellar’s Bell upgrade paves the way for the Pi Core Team to incorporate quantum-resistant security measures.
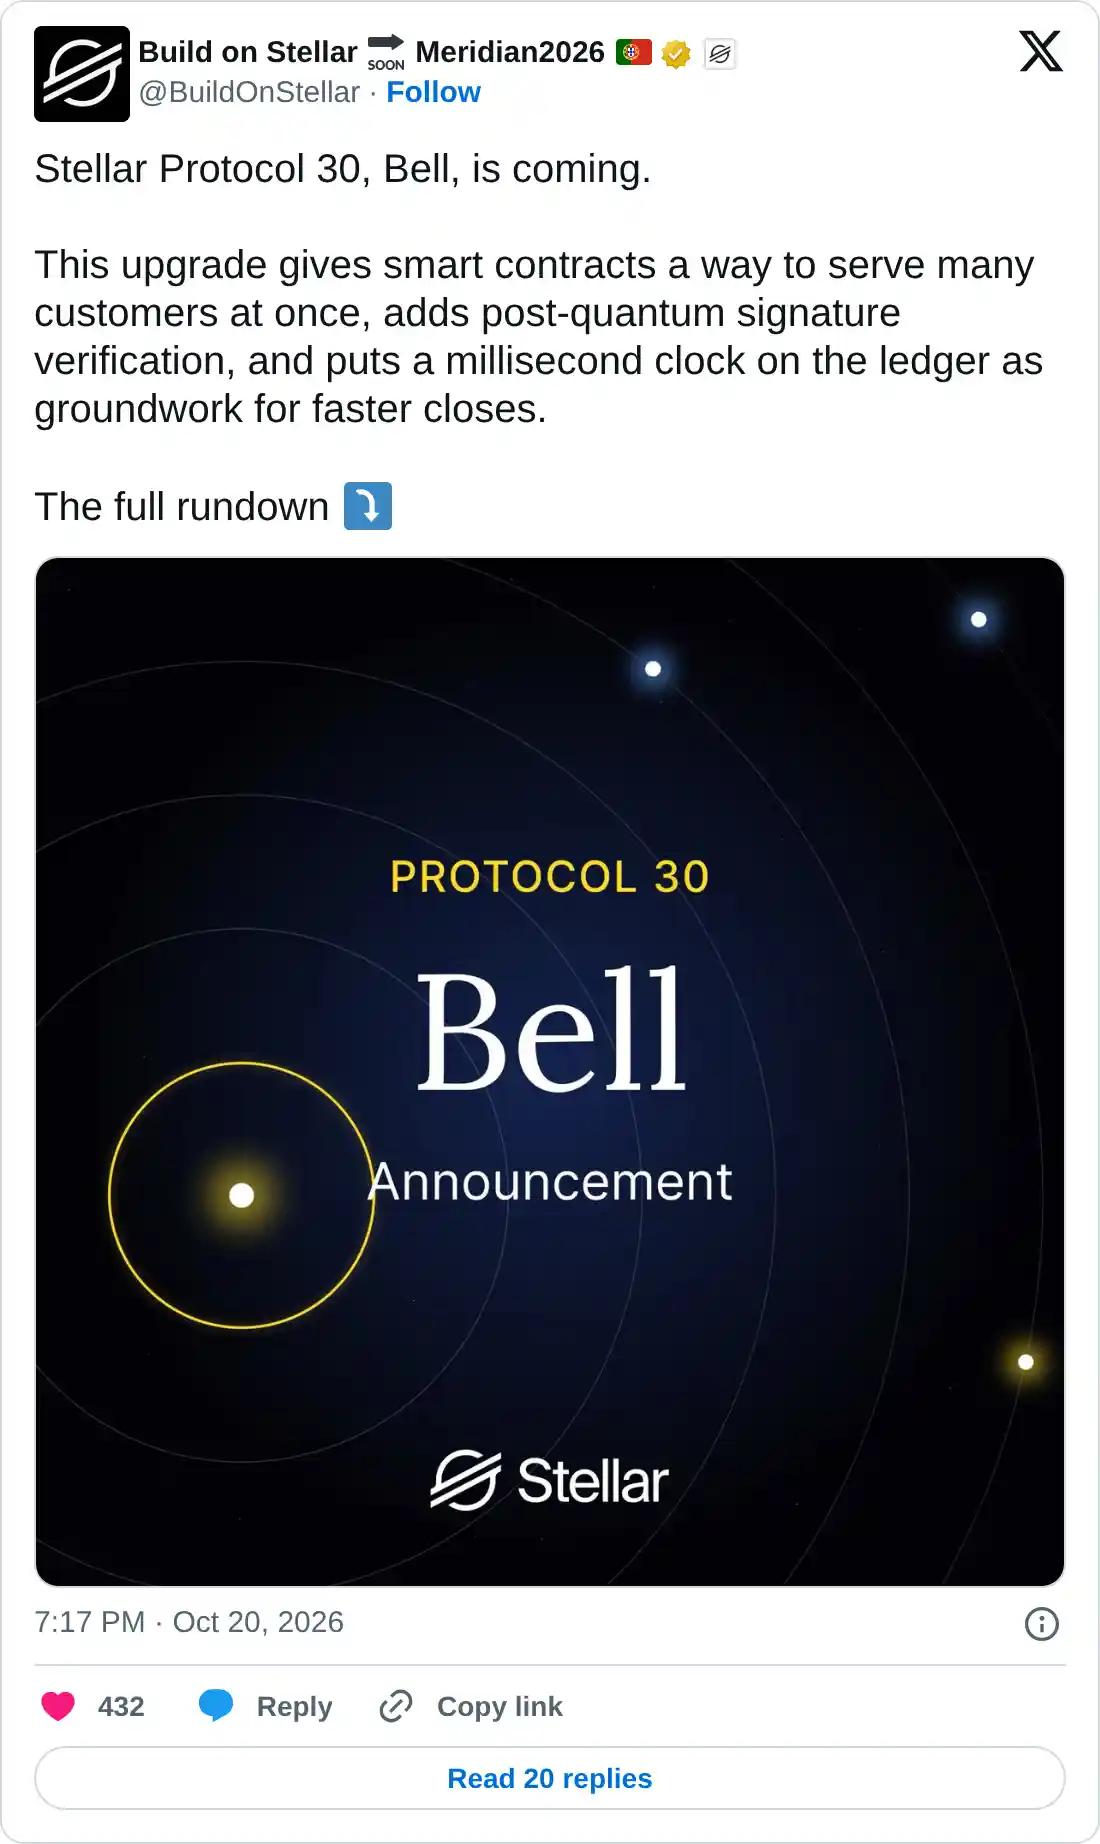
https://x.com/BuildOnStellar/status/2112624151643160580

Technical outlook: PI defends the $0.0774 line

Pi Network trades at $0.0798 at press time on Wednesday, extending a sideways consolidation above the October 8 low at $0.0774. PI remains capped beneath a descending resistance trendline, connecting the June 20 and August 22 highs, near $0.0834.

In addition, the price sits below the 50- and 200-day Exponential Moving Averages (EMAs) at $0.0860 and $0.1188, respectively. For a sustained recovery, PI must reclaim the overhead trendline with a break near $0.0834, which could open the path toward the 50-day EMA at $0.0860.

Momentum remains subdued on the daily chart, with the Relative Strength Index (RSI) around 41 and the Moving Average Convergence Divergence (MACD) close to its signal line in negative territory, suggesting weak downside momentum rather than an imminent recovery.

Chart Analysis PI/USD (baha Crypto)
PI/USD daily price chart.

On the downside, the only notable support lies at the October 8 low at $0.0774, providing downside protection. However, a daily close below this structural low could extend the decline toward the record low of $0.0704, where stronger buying interest would be needed to arrest any renewed slide.

(The technical analysis of this story was written with the help of an AI tool. Know more.)

Disclaimer: For information purposes only. Past performance is not indicative of future results.
placeholder
Today’s Market Recap: U.S. Stocks Rebound as Nasdaq Gains 1.11%, Memory Chip Stocks Rally, SanDisk Jumps 5.5%U.S. stocks rebounded on Monday, October 19, following a sharp sell-off in AI infrastructure stocks last week, lifting the Nasdaq Composite and S&P 500.At the clo
Author  TradingKey
Yesterday 01: 25
U.S. stocks rebounded on Monday, October 19, following a sharp sell-off in AI infrastructure stocks last week, lifting the Nasdaq Composite and S&P 500.At the clo
placeholder
Gold Price Analysis Today | Forex Gold Analysis | XAU/USD Analysis - October 20, 2026Get the latest gold price analysis, forex gold insights, and XAU/USD analysis for October 20, 2026. Read on for the details.
Author  Mitrade
Yesterday 03: 17
Get the latest gold price analysis, forex gold insights, and XAU/USD analysis for October 20, 2026. Read on for the details.
placeholder
Dollar presses 102 as the 10-year yield sits at 5.14% — and October hike odds are only 17%The dollar index closed at 101.99 (+0.20%) on Monday after briefly topping 102.07, while the 10-year Treasury yield rose to 5.14% and the 2-year hit 4.774% — yet futures price only about a 17% chance of a hike at the October 27-28 FOMC, versus roughly 90% for December. The driver is a global bond selloff, not a Fed repricing: France's 10-year OAT jumped to 4.84% ~ 4.94% and the OAT-Bund spread widened to 140 ~ 146bp. Here are the levels, the cross-asset read-through and what to watch.
Author  Irene Q.
Yesterday 05: 50
The dollar index closed at 101.99 (+0.20%) on Monday after briefly topping 102.07, while the 10-year Treasury yield rose to 5.14% and the 2-year hit 4.774% — yet futures price only about a 17% chance of a hike at the October 27-28 FOMC, versus roughly 90% for December. The driver is a global bond selloff, not a Fed repricing: France's 10-year OAT jumped to 4.84% ~ 4.94% and the OAT-Bund spread widened to 140 ~ 146bp. Here are the levels, the cross-asset read-through and what to watch.
placeholder
Tesla Q3 Earnings Preview: Can Auto Margins Stabilize? Wall Street’s Highest Price Target at $550Tesla (TSLA) will report its third-quarter 2026 financial results after the U.S. stock market close on October 21, Eastern Time, and host an earnings conference call at 17:30 that day. Th
Author  TradingKey
Yesterday 10: 22
Tesla (TSLA) will report its third-quarter 2026 financial results after the U.S. stock market close on October 21, Eastern Time, and host an earnings conference call at 17:30 that day. Th
placeholder
Gold Price Analysis Today | Forex Gold Analysis | XAU/USD Analysis - October 21, 2026Get the latest gold price analysis, forex gold insights, and XAU/USD analysis for October 21, 2026. Read on for the details.
Author  Mitrade
7 hours ago
Get the latest gold price analysis, forex gold insights, and XAU/USD analysis for October 21, 2026. Read on for the details.
goTop
quote