

NEAR Protocol Price Forecast: Mild correction persists despite resilient ETF inflows

Source Fxstreet
  • NEAR edges below $5 on Tuesday, extending its near-term pullback capped by its 50-period EMA at $5.0182.
  • Bitwise’s NEAR-focused ETF recorded over $5 million in inflows on Monday, following last week’s total of more than $11 million.
  • The technical outlook for NEAR suggests a near-term downside bias, with bears eyeing the 200-period EMA at $4.5514.

NEAR Protocol (NEAR) price is down nearly 2% on Tuesday, mirroring its 2% decline from the previous day. Institutional demand remains firm, with Bitwise’s NEAR-focused Exchange Traded Fund (ETF) recording over $5 million in inflows on Monday. The technical outlook for NEAR suggests a mild correction in the broader upward trend, with bears targeting the 200-period Exponential Moving Average (EMA) at $4.5514.

Consistent ETF inflows back NEAR token’s long-term upside

NEAR Protocol retains firm institutional demand. SoSoValue data shows Bitwise’s spot NEAR-focused ETF (NRR) recorded $5.42 million in inflows on Monday, following three consecutive weeks of inflows totaling over $80 million. This reflects consistent buying pressure on the NRR ETF, likely driven by NEAR Protocol’s network growth, expansion into tokenized assets, and privacy features.
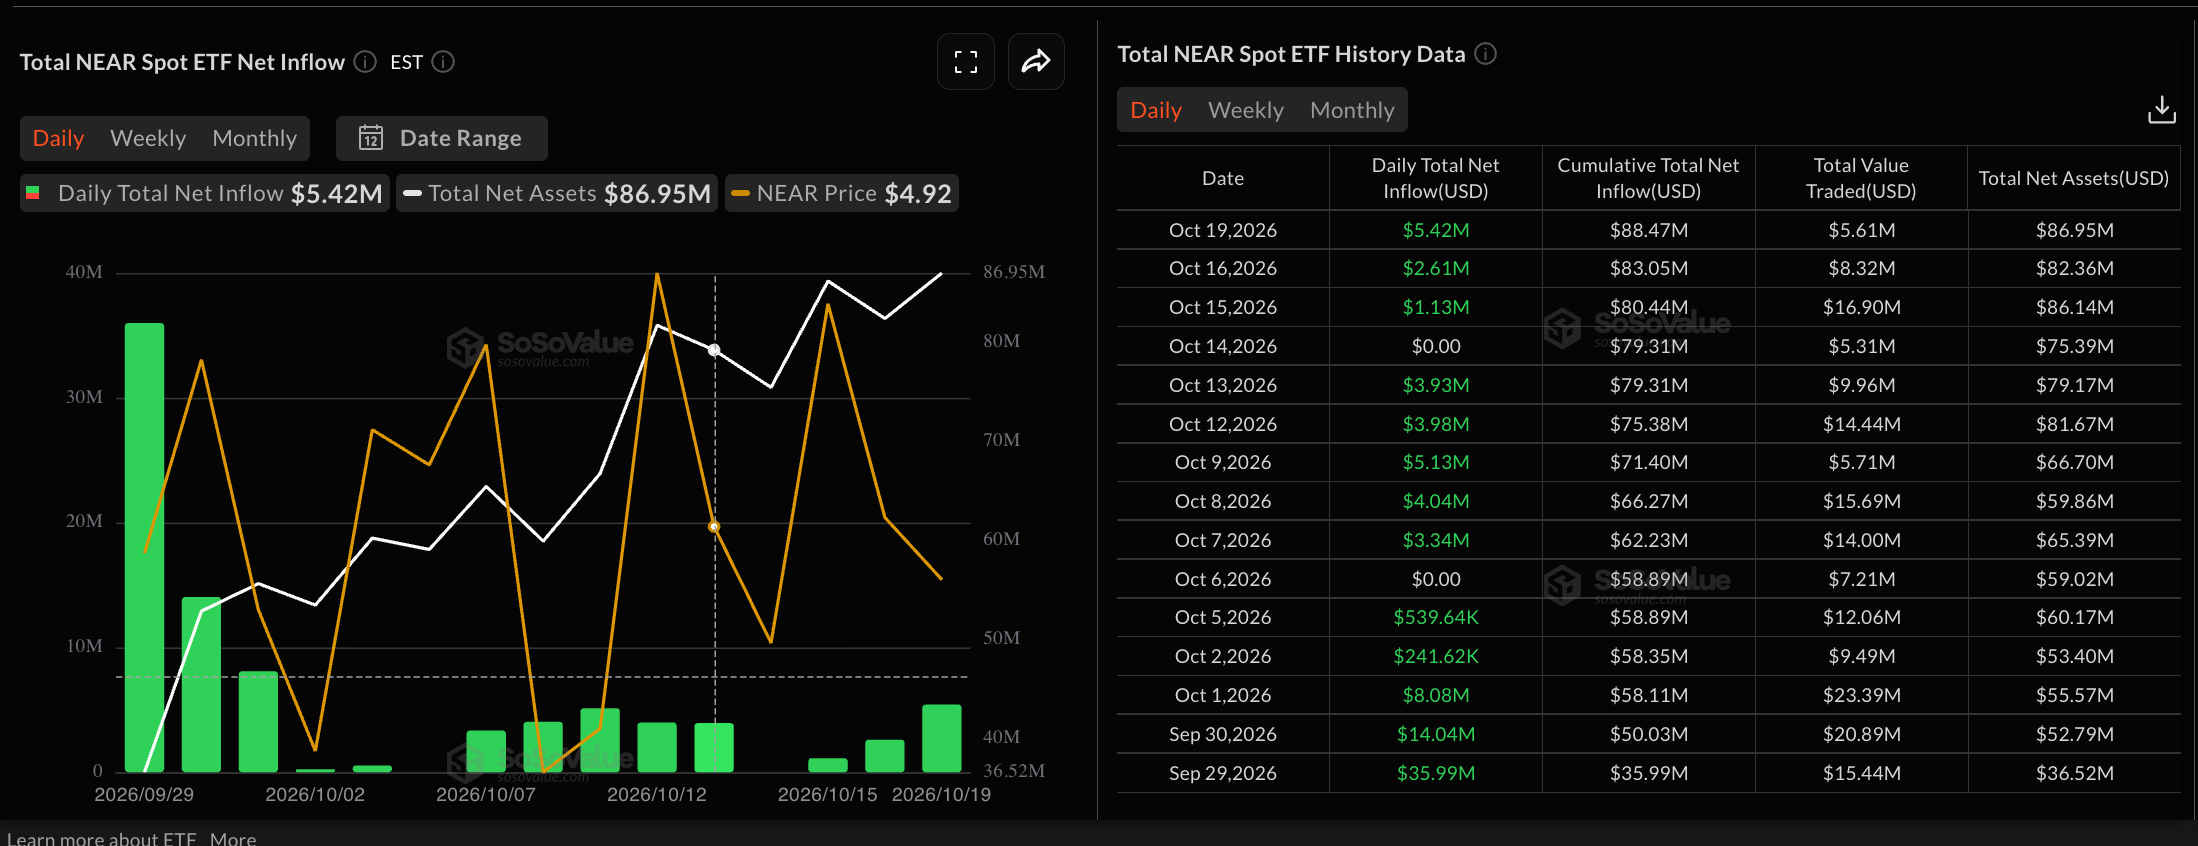
NEAR ETFs data. Source: Sosovalue

According to NEAR Protocol’s Q3 2026 report released on Monday, NEAR Intents, a multichain transaction pool, recorded over $32 billion in cumulative volume, up 45% from the previous quarter, with over $8 million in fees directed toward token buybacks. At the same time, the Total Value Locked (TVL) in NEAR’s privacy-focused Confidential Intents reached approximately $160 million, up roughly 463%.
https://x.com/NEARProtocol/status/2112225472071311506

Technical outlook: Will NEAR price resurface above $5?

NEAR Protocol trades at $4.8160 on Tuesday, maintaining a bearish near-term bias. On the four-hour chart, the NEAR token is capped below the 50-period EMA at $5.0179 and the descending trendline at $5.0261, while remaining above the 200-period EMA at $4.5513. This configuration suggests the token is capped by an overhead compact supply zone that bulls would need to reclaim to shift the short-term tone.

A confirmed breakout above the declining trendline at $5.0261 could reinstate NEAR's constructive tone, opening the path toward the September 28 high at $5.5780, followed by the $6.0000 round figure.

The Relative Strength Index (RSI) is at 43 in the neutral-to-soft territory on the four-hour chart, while the Moving Average Convergence Divergence (MACD) crosses marginally below its signal line, hinting at waning upside pressure.

Looking down, the 200-period EMA at $4.5513 emerges as the immediate support level, reinforced by the $4.4440 horizontal level, which capped losses on October 8. A sustained correction below this zone could indicate a clear bearish trend reversal, potentially targeting the September 19 high at $3.9140.

Chart Analysis NEAR/USDT (Binance)
NEAR/USDT four-hour price chart.

(The technical analysis of this story was written with the help of an AI tool. Know more.)

Disclaimer: For information purposes only. Past performance is not indicative of future results.
placeholder
Tesla Q3 Earnings Preview: Can Auto Margins Stabilize? Wall Street’s Highest Price Target at $550Tesla (TSLA) will report its third-quarter 2026 financial results after the U.S. stock market close on October 21, Eastern Time, and host an earnings conference call at 17:30 that day. Th
Author  TradingKey
12 hours ago
Tesla (TSLA) will report its third-quarter 2026 financial results after the U.S. stock market close on October 21, Eastern Time, and host an earnings conference call at 17:30 that day. Th
placeholder
Brent Crude Tops $110 to Hit Near Five-Month High, Oil May Test $120On October 20, international oil prices remained high, as Brent (UKOIL) crude oil broke through the $110 mark intraday to reach a nearly five-month high. Persistent market concern over Mi
Author  TradingKey
13 hours ago
On October 20, international oil prices remained high, as Brent (UKOIL) crude oil broke through the $110 mark intraday to reach a nearly five-month high. Persistent market concern over Mi
placeholder
Netflix earnings land tonight: the $70 line that decides whether the AI rebound has legsNetflix reports Q3 after the US close on October 20 with the stock at $69.85 (-0.96%), just below the $70 round number and far from its 52-week high of $124.86. Consensus looks for revenue near $12.87bn (+12%), EPS around $0.82 and a 33.2% operating margin, while options imply an 8.4% one-day move. With the Nasdaq up 1.11% and the SOX up 1.61% after an eight-day slide, the result is the first real test of the AI-led rebound. Here are the numbers, the $65 / $70 / $75 levels and the three checks that matter.
Author  Irene Q.
16 hours ago
Netflix reports Q3 after the US close on October 20 with the stock at $69.85 (-0.96%), just below the $70 round number and far from its 52-week high of $124.86. Consensus looks for revenue near $12.87bn (+12%), EPS around $0.82 and a 33.2% operating margin, while options imply an 8.4% one-day move. With the Nasdaq up 1.11% and the SOX up 1.61% after an eight-day slide, the result is the first real test of the AI-led rebound. Here are the numbers, the $65 / $70 / $75 levels and the three checks that matter.
placeholder
Dollar presses 102 as the 10-year yield sits at 5.14% — and October hike odds are only 17%The dollar index closed at 101.99 (+0.20%) on Monday after briefly topping 102.07, while the 10-year Treasury yield rose to 5.14% and the 2-year hit 4.774% — yet futures price only about a 17% chance of a hike at the October 27-28 FOMC, versus roughly 90% for December. The driver is a global bond selloff, not a Fed repricing: France's 10-year OAT jumped to 4.84% ~ 4.94% and the OAT-Bund spread widened to 140 ~ 146bp. Here are the levels, the cross-asset read-through and what to watch.
Author  Irene Q.
17 hours ago
The dollar index closed at 101.99 (+0.20%) on Monday after briefly topping 102.07, while the 10-year Treasury yield rose to 5.14% and the 2-year hit 4.774% — yet futures price only about a 17% chance of a hike at the October 27-28 FOMC, versus roughly 90% for December. The driver is a global bond selloff, not a Fed repricing: France's 10-year OAT jumped to 4.84% ~ 4.94% and the OAT-Bund spread widened to 140 ~ 146bp. Here are the levels, the cross-asset read-through and what to watch.
placeholder
Gold Price Analysis Today | Forex Gold Analysis | XAU/USD Analysis - October 20, 2026Get the latest gold price analysis, forex gold insights, and XAU/USD analysis for October 20, 2026. Read on for the details.
Author  Mitrade
19 hours ago
Get the latest gold price analysis, forex gold insights, and XAU/USD analysis for October 20, 2026. Read on for the details.
goTop
quote