

Pi Network Price Forecast: Weak momentum and waning demand reinforce downside bias

Source Fxstreet
  • Pi Network edges lower on Monday, risking a break below its immediate near-term support around $0.0774.
  • Declining PI futures Open Interest and weekly spot trading volume suggest reduced demand among traders.
  • The technical outlook for PI indicates a downside bias as momentum remains weak.

Pi Network (PI) edges lower on Monday, risking a bearish conclusion to its short-term consolidation above the $0.0774 horizontal support. A steady decline in the notional value of active PI futures contracts and the weekly spot trading volume suggests reduced retail demand. The PI token risks a retest of its record low around $0.0704 as bearish momentum remains dominant on the daily chart. 

Pi Network loses retail support

Pi Network is in a long-term bearish trend, weighing on investors' confidence. Blockworks data shows PI is losing demand in the retail space, with weekly spot trading volume dropping to 30.36 million last week, extending a steady decline over the last four weeks after the $65.52 million peak in late September.

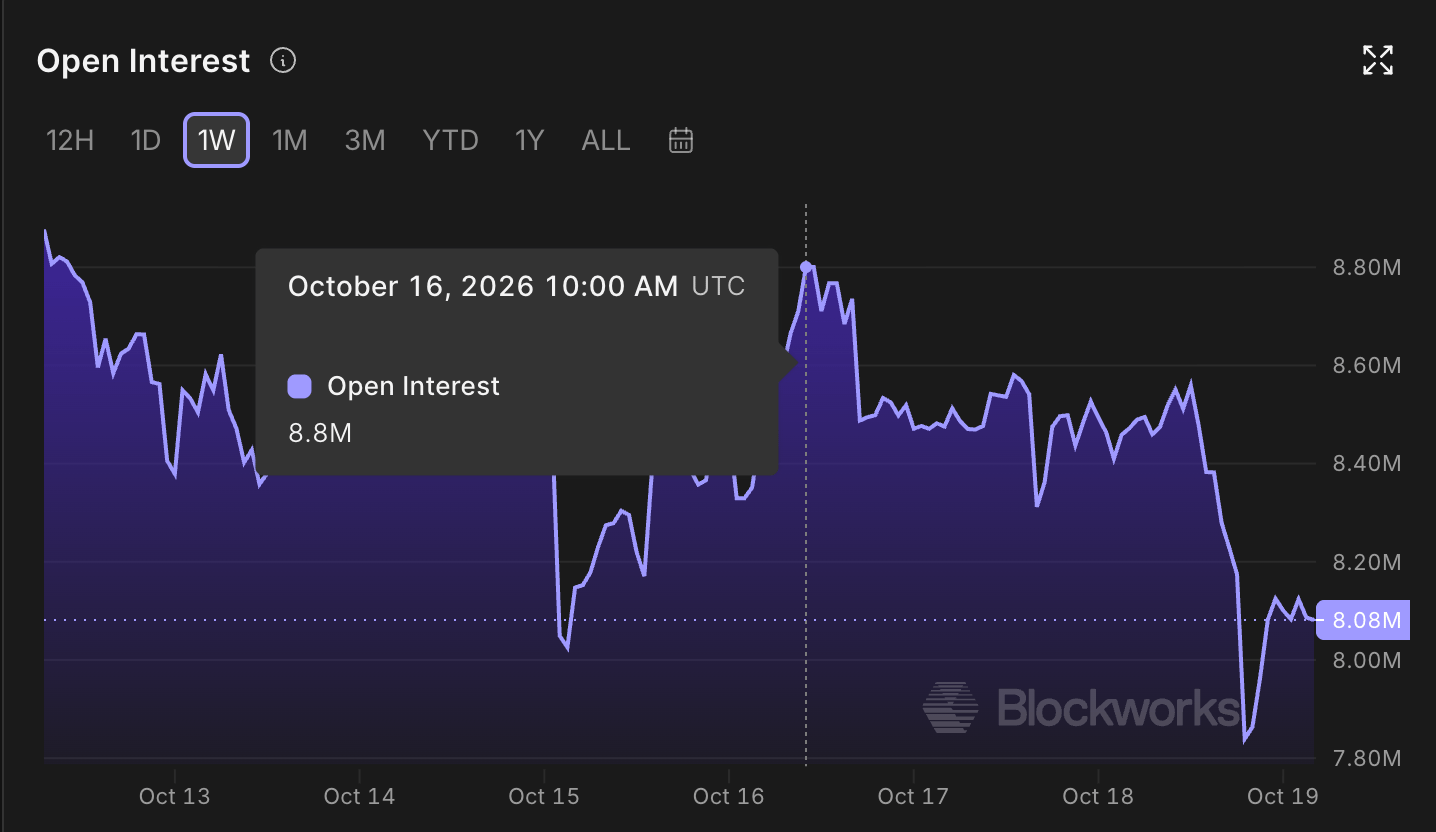
Similarly, the derivatives market is seeing reduced demand in PI futures. Blockworks data shows PI futures Open Interest (OI) is down to $8.08 million on Monday, from $8.80 million on Friday, suggesting a lower notional value of active contracts, driven by a lower spot price or a positional wipeout.
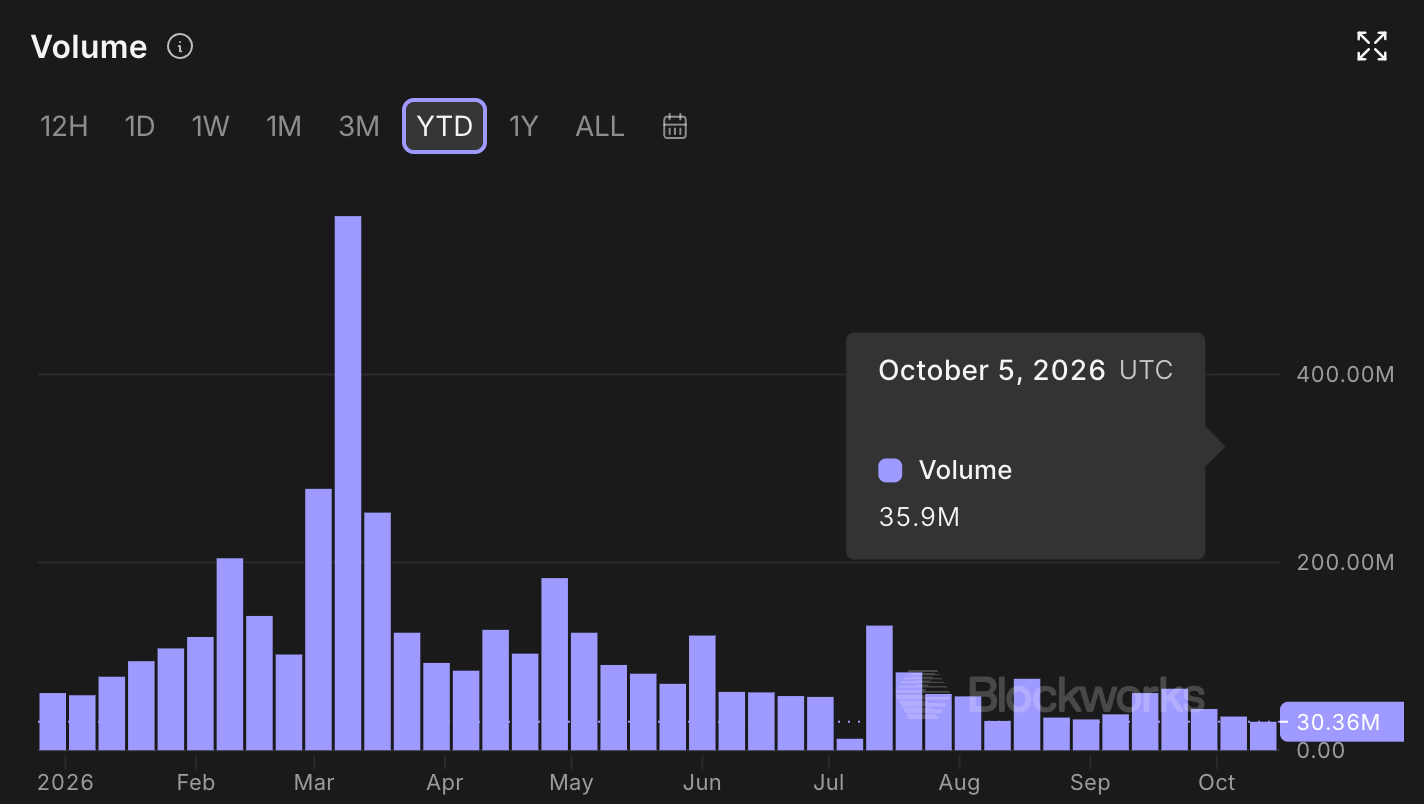
Pi Network trading volume data. Source: Blockworks
PI token Open Interest chart. Source: Blockworks

Technical outlook: Will Pi Network extend its decline to a fresh record low?

Pi Network trades around $0.0786 at press time on Monday, maintaining a long-term bearish bias. The PI token remains capped beneath the 50-day Exponential Moving Average (EMA) at $0.0865 and the broken downward trendline, which connects the June 20 and August 22 highs, at $0.0843.

From a technical perspective, the 23.6% Fibonacci retracement level, measured from $0.1394 to $0.0704, at $0.0866 reinforces the overhead barrier near the declining resistance trendline. To reinstate an upward trend, PI must surpass the 50-day EMA at $0.0865, which could extend the recovery toward the 50% retracement level at $0.1049.

The Relative Strength Index (RSI) at 37 signals soft but not extreme downside momentum, and the Moving Average Convergence Divergence (MACD) line remains marginally below its signal line, which together hint that sellers still retain control.

PI/USD daily price chart.

On the downside, the immediate technical floor is at the October 8 low of $0.0774, guarding the Fibonacci anchor at $0.0704. A decisive break beneath this structural low would open the door to a deeper bearish extension into untested waters.

(The technical analysis of this story was written with the help of an AI tool. Know more.)

Disclaimer: For information purposes only. Past performance is not indicative of future results.
placeholder
Brent Crude Oil Price Forecast: Trump Eases Sanctions on Russia, Oil Prices Under Pressure Below $110, Can They Still Rise?On Monday (October 19), Brent (UKOIL) crude oil prices fell noticeably at the open today after a sharp rally last Friday. As of press time, oil prices were down about 2.1%, trading near $
Author  TradingKey
11 hours ago
On Monday (October 19), Brent (UKOIL) crude oil prices fell noticeably at the open today after a sharp rally last Friday. As of press time, oil prices were down about 2.1%, trading near $
placeholder
Bitcoin's double top at $88,000: why $78,000 is the line that decides the next moveBitcoin trades near $82,500 (+0.47%) after twice failing at the $88,000 area, forming a potential double top with a neckline at $78,000. A break below the neckline would project a measured target near $68,200; a close back above $88,000 would invalidate the pattern. Here are the structure, the levels and what would confirm either side.
Author  Suzie
14 hours ago
Bitcoin trades near $82,500 (+0.47%) after twice failing at the $88,000 area, forming a potential double top with a neckline at $78,000. A break below the neckline would project a measured target near $68,200; a close back above $88,000 would invalidate the pattern. Here are the structure, the levels and what would confirm either side.
placeholder
Brent slips from $110 as Russian supply prospects return — is the five-month rally over?Brent crude traded near $108.06 on Monday (-1.71%), pulling back from last week's $110 high after Washington moved to ease restrictions on Russian oil flows. WTI hovered around $101 before dipping below $99. The retreat is real, but so is the supply-risk premium: Hormuz shipping disruptions, attacks on Saudi energy infrastructure and strikes on Russian refineries remain live. Here are the three numbers, the transmission chain and the levels that matter.
Author  Irene Q.
15 hours ago
Brent crude traded near $108.06 on Monday (-1.71%), pulling back from last week's $110 high after Washington moved to ease restrictions on Russian oil flows. WTI hovered around $101 before dipping below $99. The retreat is real, but so is the supply-risk premium: Hormuz shipping disruptions, attacks on Saudi energy infrastructure and strikes on Russian refineries remain live. Here are the three numbers, the transmission chain and the levels that matter.
placeholder
Gold retests $4,200 as dollar and yields retreat — can bullion clear its hardest level?Spot gold traded near $4,175 on Monday (+0.23%), with an intraday high of $4,187.71 after last week's $4,073 ~ $4,217 range; COMEX futures briefly topped $4,200. The dollar slipped to 101.76 and 10-year yields eased from their highs, but October Fed hike odds near 52% and BofA's sub-$4,000 call still cap the upside. Here are the drivers, the levels and what would flip the script.
Author  Irene Q.
15 hours ago
Spot gold traded near $4,175 on Monday (+0.23%), with an intraday high of $4,187.71 after last week's $4,073 ~ $4,217 range; COMEX futures briefly topped $4,200. The dollar slipped to 101.76 and 10-year yields eased from their highs, but October Fed hike odds near 52% and BofA's sub-$4,000 call still cap the upside. Here are the drivers, the levels and what would flip the script.
placeholder
Gold Price Analysis Today | Forex Gold Analysis | XAU/USD Analysis - October 19, 2026Get the latest gold price analysis, forex gold insights, and XAU/USD analysis for October 19, 2026. Read on for the details.
Author  Mitrade
19 hours ago
Get the latest gold price analysis, forex gold insights, and XAU/USD analysis for October 19, 2026. Read on for the details.
goTop
quote