


Gold sags near $4,150 as Oil fuels US yields rebound
- Gold falls 0.54% to $4,141 as US Dollar strength pressures bullion.
- WTI rises above $99, lifting 10-year Treasury yields to 5.144%.
- October Fed hike odds stand at 16%, while December reaches 92%.
Gold (XAU/USD) falls about 0.54% on Monday as the Greenback drifts higher and market mood shifts to neutral amid tensions in the Middle East, sparking a risein Oil prices, with West Texas Intermediate (WTI) bouncing off daily lows beneath $97 to $99.30. At the time of writing, XAU/USD trades at $4,141.
XAU/USD retreats as rising energy prices and Treasury yields overshadow fading October Fed hike bets
The yellow metal began the week on a lower note as the US Dollar drifts higher even though last week’s US hot-inflation data, particularly the Producer Price Index (PPI), triggered a leg down on the Greenback as money markets priced out a rate hike in October.
Geopolitics continued to play its role as Iran’s navy reported attacks from the US military at the Konarak naval base, reporting that two soldiers were injured, according to Al Jazeera.
That pushed WTI prices higher and US Treasury yields higher. The US 10-year T-note yield is up six basis points at 5.144%.
This week, the US economic docket will be absent of speeches from Federal Reserve (Fed) officials during October’s Federal Open Market Committee (FOMC) blackout period. But economic data will be released, like the ADP Employment Change 4-week average, jobless claims and S&P Global Flash PMIs.
Worth noting that the White House National Economic Adviser Kevin Hassett said that inflation looks like “it is needing some work” at CNBC.
Even though Gold is used as a hedge against high inflation, rising US yields undermine the yellow metal due to its non-yielding nature.
Money markets trimmed the odds of an October Fed rate hike to 16% following September's 25-basis-point increase. For the December meeting, the odds are nearly 92%, according to Prime Terminal data.

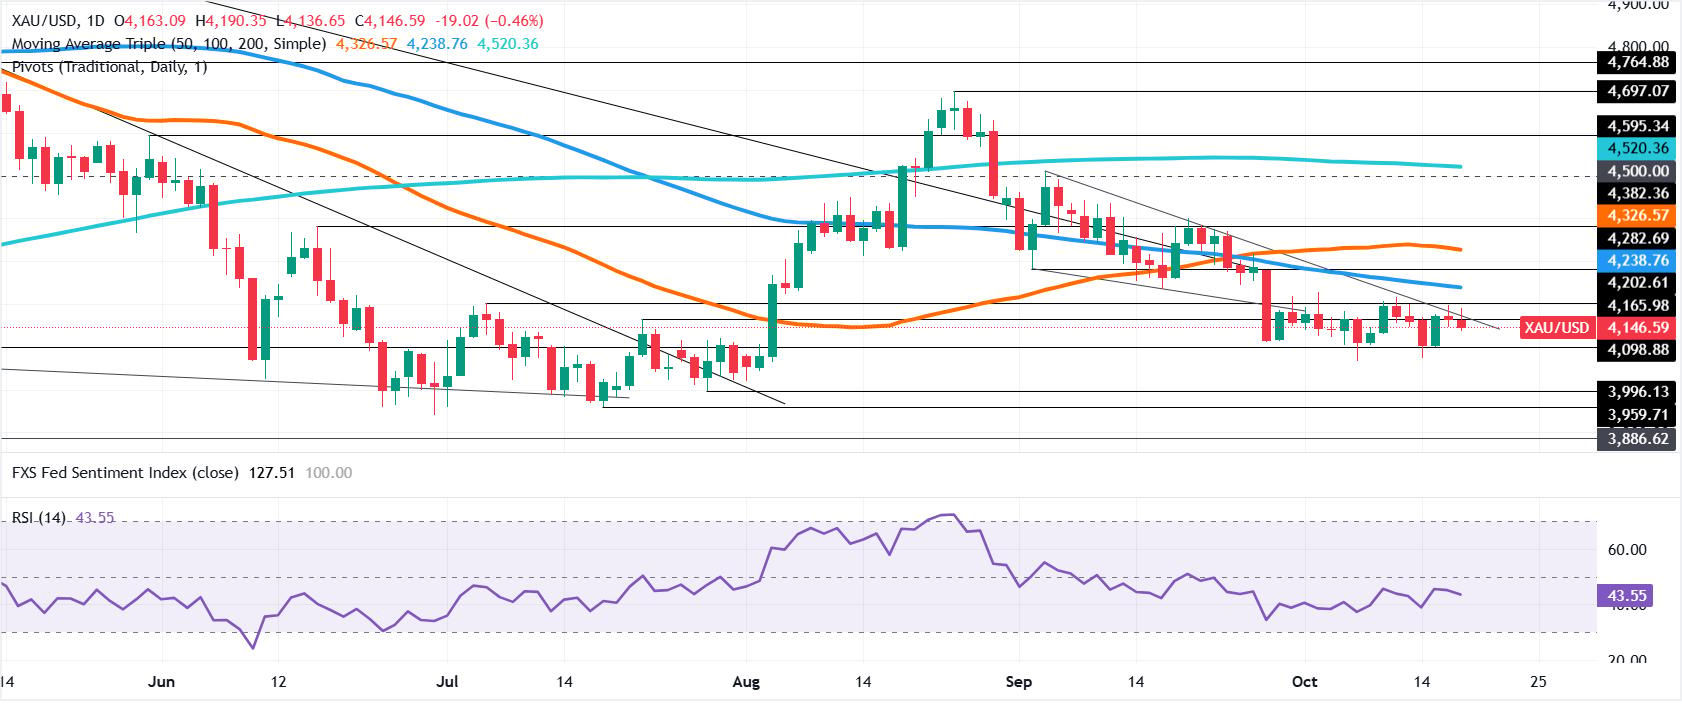
XAU/USD technical analysis: Gold trapped within $4,100-$4,200
Gold continues to trade laterally within the $4,100-$4,200 range, and although it appears to have bottomed near the range’s lower end, nothing is certain amid growing speculation that the Fed could increase rates in December.
The Relative Strength Index (RSI) remains bearish, though it has shifted to a flattish level, indicating that neither buyers nor sellers are in charge.
For a bullish reversal, XAU/USD’s first resistance is at $4,200, followed by the 100-day Simple Moving Average (SMA) at $4,238. Above that is the 50-day SMA at $4,326, followed by the $4,500 mark.
If XAU/USD continues lower, initial support is at $4,100. If sellers push Gold below that level, it would put the October 14 low of $4,073 in play, followed by the July 29 cycle low at $3,996, ahead of the July 17 low at $3,959. The yearly low at $3,941 lies below these levels.
Gold FAQs
Gold has played a key role in human’s history as it has been widely used as a store of value and medium of exchange. Currently, apart from its shine and usage for jewelry, the precious metal is widely seen as a safe-haven asset, meaning that it is considered a good investment during turbulent times. Gold is also widely seen as a hedge against inflation and against depreciating currencies as it doesn’t rely on any specific issuer or government.
Central banks are the biggest Gold holders. In their aim to support their currencies in turbulent times, central banks tend to diversify their reserves and buy Gold to improve the perceived strength of the economy and the currency. High Gold reserves can be a source of trust for a country’s solvency. Central banks added 1,136 tonnes of Gold worth around $70 billion to their reserves in 2022, according to data from the World Gold Council. This is the highest yearly purchase since records began. Central banks from emerging economies such as China, India and Turkey are quickly increasing their Gold reserves.
Gold has an inverse correlation with the US Dollar and US Treasuries, which are both major reserve and safe-haven assets. When the Dollar depreciates, Gold tends to rise, enabling investors and central banks to diversify their assets in turbulent times. Gold is also inversely correlated with risk assets. A rally in the stock market tends to weaken Gold price, while sell-offs in riskier markets tend to favor the precious metal.
The price can move due to a wide range of factors. Geopolitical instability or fears of a deep recession can quickly make Gold price escalate due to its safe-haven status. As a yield-less asset, Gold tends to rise with lower interest rates, while higher cost of money usually weighs down on the yellow metal. Still, most moves depend on how the US Dollar (USD) behaves as the asset is priced in dollars (XAU/USD). A strong Dollar tends to keep the price of Gold controlled, whereas a weaker Dollar is likely to push Gold prices up.
Recommended Articles


