


Inflation Just Spooked the Market -- But There's Still Good News for Patient Investors
Key Points
September's hot CPI report sent the S&P 500 down 1.1% and the Nasdaq down 1.8% in a single day.
Daily drops of 1% or more have happened 18 times in 2026, so one rough session is less unusual than it feels.
A $10,000 S&P 500 index fund investment made just before the 2008 crash would be worth about $81,000 today with dividends reinvested, far ahead of inflation.
- 10 stocks we like better than SPDR S&P 500 ETF Trust ›
The Bureau of Labor Statistics released another gloomy inflation report last week. The overall Consumer Price Index (CPI) rose 0.6% in September and 3.7% year-over-year, up from 0.4% and 3.4% in last month's report.
This was market-moving news. The odds for Federal Reserve interest rate hikes ticked up, discouraging debt-fueled investments and pressuring the margins in corporate earnings reports. The S&P 500 (SNPINDEX: ^GSPC) fell 1.1% that day while the volatile Nasdaq Composite (NASDAQINDEX: ^IXIC) took a 1.8% hit.
Missed Nvidia in 2009? This Rare Signal Is Flashing Again. In 2009, a "Double Down" signal flashed for a little-known chipmaker called Nvidia. For the first time in years, that same "Total Conviction" signal is flashing for a company 1/100th the size of Nvidia. Continue »
That's the bad news. I should have asked you to take a seat before reading that bit. But I can make up for the nerve-rattling inflation data and Fed rate predictions.
You see, it's still a good idea to start investing (or to keep investing) in October 2026. There may be some dark days ahead, but the stock market still tends to deliver inflation-beating returns in the long run. That's true even if you pick absolutely terrible times to put money in the market.

Image source: Getty Images.
Market noise is louder than it looks
The stock market is not a smooth ride to the stars. Every day is a new squiggle on the long-term charts. Future investors may remember the September CPI report as a fairly significant blip.
Then again, maybe they won't. Oct. 14 was far from a record-breaking downtick. According to my spreadsheets, it was the 18th time the S&P 500 fell more than 1% in 2026. It also gained more than 1% on 19 occasions so far this year.
One uncomfortable economic report quickly blends into the daily noise. You're more likely to remember week-long price drops when looking at a full-year chart, or longer downturns on long-term time scales.
Meet the unluckiest index investor of 2006
Imagine starting a simple $10,000 investment in October 2006. This isn't about trying to beat the market with hand-picked stocks -- just a simple index fund that tracks the S&P 500. The SPDR S&P 500 ETF (NYSEMKT: SPY) has been around since 1993, so that ETF would have been a real option 20 years ago.
Wall Street had recovered from the dot-com crash and the 9/11 attack. Tech stocks soared, and the American housing market was red-hot. On Oct. 18, 2007, the S&P 500 had gained 74% in five years.
But you know what came next. The subprime mortgage bubble popped, credit markets froze, and the stock market plunged. By March 2009, the SPDR S&P 500 fund had fallen more than 50% from your starting price.
Many investors bailed out of their stock holdings during this market meltdown. Who could blame them? The sky was falling, and everything felt wrong.
But in this example, you held on to your ETF shares.
Patience beat inflation by a mile
And that was a good choice. Despite a 50% market drop in the first couple of years, another plunge in the early COVID-19 panic, and the inflation crisis of 2022, your hypothetical 2006 investment has done a stellar job of building wealth over the years:
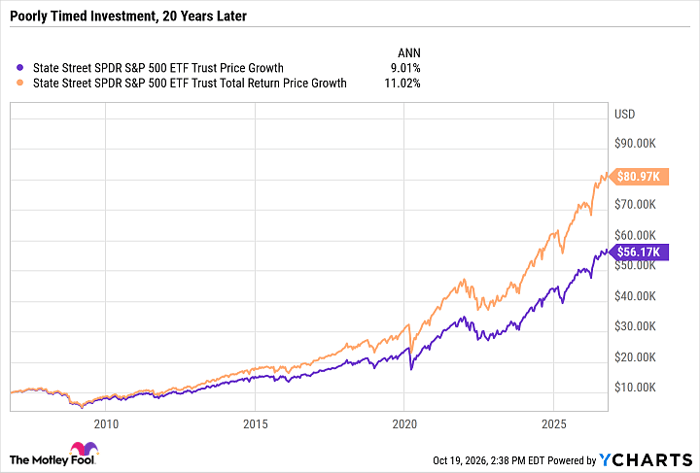
SPY data by YCharts
In terms of basic share prices, the ETF has turned $10,000 into $56,170. If you also enabled dividend reinvestments right away, the position would be worth $80,970 today.
That's way ahead of the inflation curve. According to inflation calculators, $10,000 in October 2006 has the same purchasing power as $16,697 today. $80,970, against an inflation-adjusted $16,697, amounts to roughly 4.8 times the original purchasing power.
The lesson for today's nervous investors
It wasn't a smooth ride at all, but positive market trends keep overcoming speed bumps, staving off the inflation effect.
So yes, September's inflation report stung. But if a 2006 investor could sit through a financial crisis, a pandemic crash, and a 40-year inflation peak and still end up with more than eight times the starting stake, one hot CPI report shouldn't chase you out of the market.
Keep investing, and let time do the heavy lifting.
Should you buy stock in SPDR S&P 500 ETF Trust right now?
Before you buy stock in SPDR S&P 500 ETF Trust, consider this:
The Motley Fool Stock Advisor analyst team just identified what they believe are the 10 best stocks for investors to buy now… and SPDR S&P 500 ETF Trust wasn’t one of them. The 10 stocks that made the cut could produce monster returns in the coming years.
Consider when Netflix made this list on December 17, 2004... if you invested $1,000 at the time of our recommendation, you’d have $380,363!* Or when Nvidia made this list on April 15, 2005... if you invested $1,000 at the time of our recommendation, you’d have $1,315,732!*
Now, it’s worth noting Stock Advisor’s total average return is 919% — a market-crushing outperformance compared to 211% for the S&P 500. Don't miss the latest top 10 list, available with Stock Advisor, and join an investing community built by individual investors for individual investors.
See the 10 stocks »
*Stock Advisor returns as of October 19, 2026.
Anders Bylund has no position in any of the stocks mentioned. The Motley Fool has no position in any of the stocks mentioned. The Motley Fool has a disclosure policy.
Recommended Articles


