

Pi Network Price Forecast: PI halts decline at key support amid easing retail support

Source Fxstreet
  • PI Network is up nearly 2% on Thursday, ticking higher after a roughly 7% decline the previous day.
  • PI futures Open Interest declines to $8.94 million, suggesting reduced risk appetite.
  • The technical outlook for PI is bearish, as downside momentum prevails.

Pi Network (PI) price is up nearly 2% on Thursday, ticking higher after seven consecutive bearish daily closes, including a 7% decline the previous day. Despite the mild recovery, retail support is lacking as PI futures Open Interest declines to $8.94 million, from $10.38 million the previous day. The technical outlook for the PI token is bearish as downside pressure mounts on the $0.0800 support level.

Pi Network is losing retail demand despite elevated social chatter

Pi Network futures witness a decline in the notional value of all open positions. CoinAnk data shows the PI futures Open Interest (OI) down to $8.94 million from $10.38 million the previous day, suggesting a reduced value due to a spot price decline or a possible positional wipeout. 

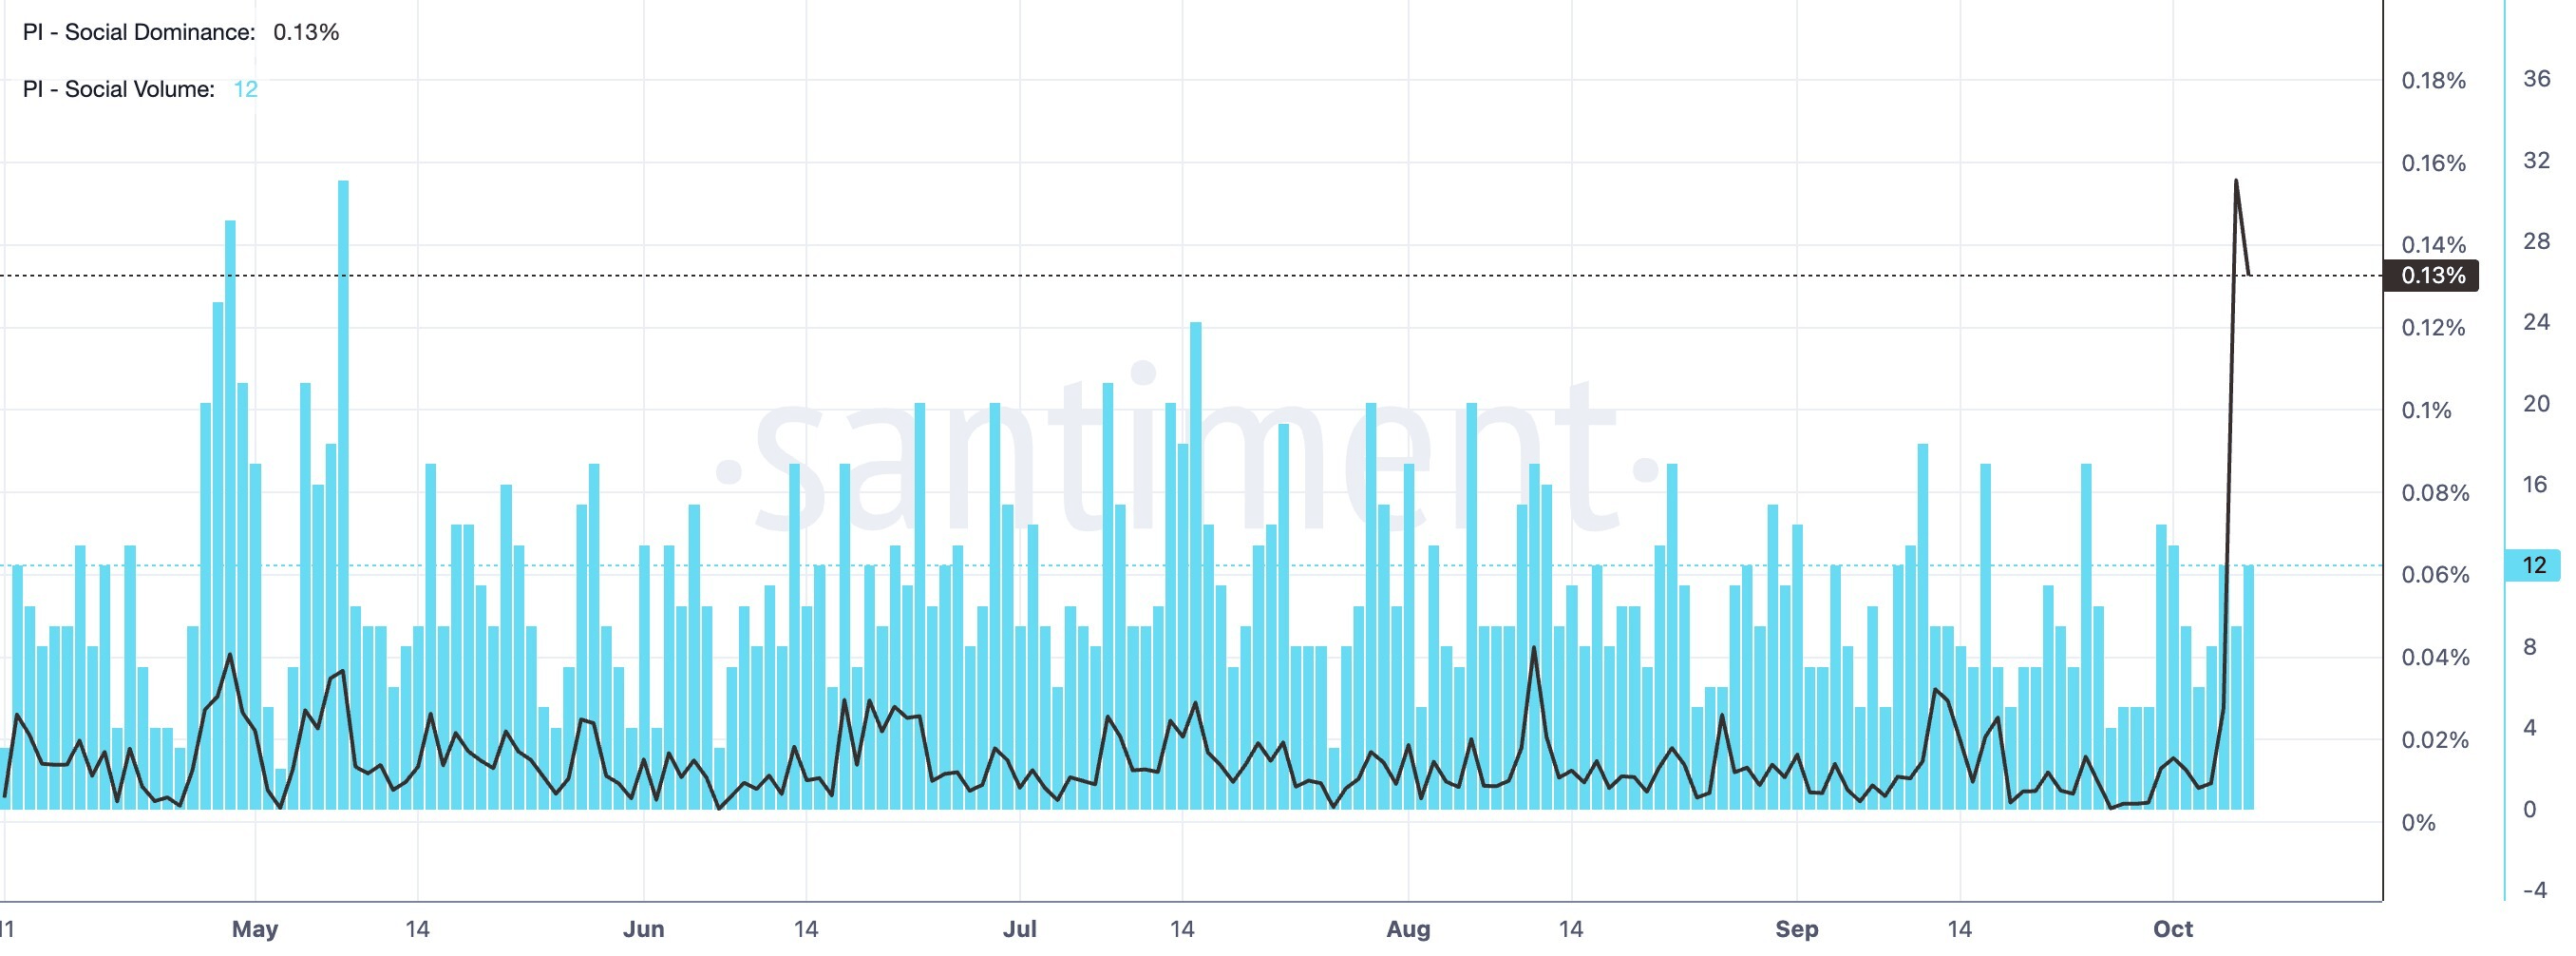
On the other hand, Santiment data shows elevated social buzz for the PI token, with the social dominance score at 0.13%, after a surge to 0.14% the previous day.
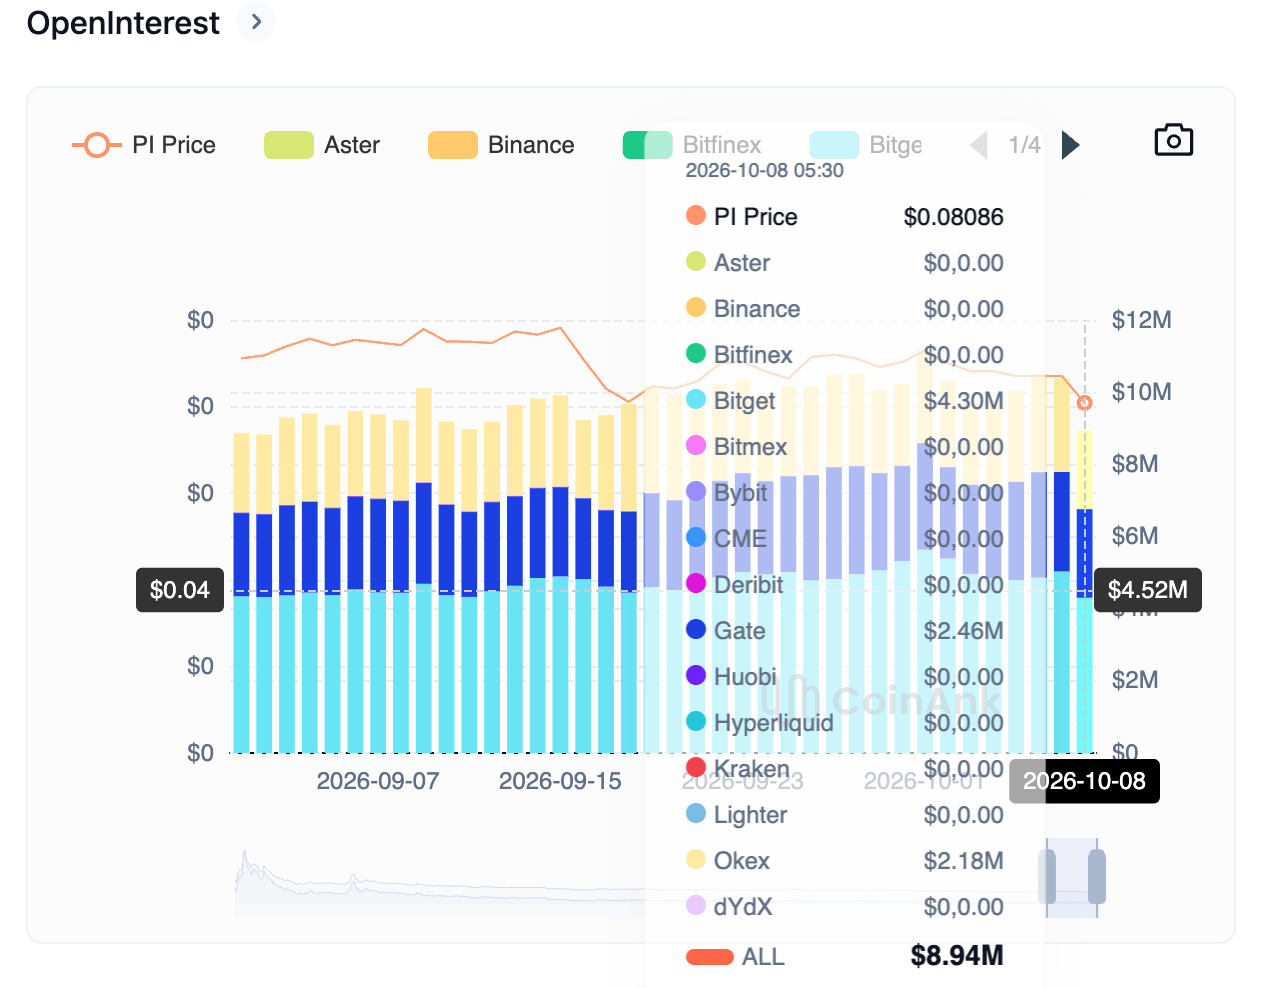
PI token Open Interest chart. Source: CoinAnk
PI social interest data. Source: Santiment

Technical outlook: Pi Network hints at a rebound

Pi Network trades around $0.0823 at press time on Thursday, extending a mild rebound from the $0.0801 support level set by the July 31 low. The PI token maintains a bearish near-term tone as it holds beneath both the 50-day and 200-day Exponential Moving Averages (EMAs) at $0.0902 and $0.1247, respectively.

From a technical perspective, PI trades below the 23.6% Fibonacci retracement at $0.0827, measured from $0.1341 to $0.0704, keeping the broader downside bias intact. For a sustained recovery, PI must reclaim the $0.0827 level, which could pave the path toward the 50-day EMA at $0.0902.

Momentum remains soft on the daily chart, with the Relative Strength Index (RSI) around 38, suggesting firm selling pressure rather than outright oversold conditions. At the same time, the Moving Average Convergence Divergence (MACD) line declines below the signal line into the negative territory, hinting that bearish momentum is gaining strength.

Chart Analysis PI/USD (baha Crypto)
PI/USD daily price chart.

On the downside, the only nearby structural support is at the July 31 low of $0.0801, guarding the Fibonacci anchor around $0.0704, where buyers may attempt to build a more durable floor.

(The technical analysis of this story was written with the help of an AI tool. Know more.)

Disclaimer: For information purposes only. Past performance is not indicative of future results.
placeholder
Gold Price Forecast: XAU/USD holds positive ground above $2,020 ahead of US CPI dataGold price (XAU/USD) drifted higher during the early Asian trading hours on Thursday.
Author  FXStreet
Jan 11, 2024
Gold price (XAU/USD) drifted higher during the early Asian trading hours on Thursday.
placeholder
Gold holds steady below $4,150 amid elevated US yields Gold price (XAU/USD) trades on a flat note near $4,140 during the early Asian session on Tuesday. Pressure from a stronger US Dollar (USD) and elevated US Treasury yields was offset by reduced expectations of a Federal Reserve (Fed) rate hike this month.
Author  FXStreet
Oct 06, Tue
Gold price (XAU/USD) trades on a flat note near $4,140 during the early Asian session on Tuesday. Pressure from a stronger US Dollar (USD) and elevated US Treasury yields was offset by reduced expectations of a Federal Reserve (Fed) rate hike this month.
placeholder
WTI rises to near $89.50 as Middle East supply threats offset Persian Gulf recoveryWest Texas Intermediate (WTI) oil price extends its gains for the second successive day, trading around $89.50 per barrel during the Asian hours on Wednesday. Crude oil climbed as persistent risks to Middle East energy flows overshadowed signs of rising supply from the region.
Author  FXStreet
Yesterday 01: 26
West Texas Intermediate (WTI) oil price extends its gains for the second successive day, trading around $89.50 per barrel during the Asian hours on Wednesday. Crude oil climbed as persistent risks to Middle East energy flows overshadowed signs of rising supply from the region.
placeholder
Gold Price Forecast: XAU/USD retraces gains and nears two-month lows at $4,104Gold (XAU/USD) retraces Tuesday’s gains on Wednesday and resumes its broader bearish trend, with the US Dollar (USD) appreciating across the board, as investors brace for the release of the minutes of the latest Federal Reserve (Fed) meeting.
Author  FXStreet
Yesterday 10: 13
Gold (XAU/USD) retraces Tuesday’s gains on Wednesday and resumes its broader bearish trend, with the US Dollar (USD) appreciating across the board, as investors brace for the release of the minutes of the latest Federal Reserve (Fed) meeting.
placeholder
Gold falls to a two-month low as real yields bite — can $4,000 hold?Gold hit a two-month low on 7 October, with spot touching roughly $4,090 and COMEX December futures closing at $4,140.70, even as the New York Fed's one-year inflation expectation rose to 3.9% — its highest since May 2023. The paradox resolves through real yields: the 30-year Treasury yield reached 5.732% intraday, its highest since 2002. Here are the levels, the institutional split, and the scenarios into tonight's jobless claims and 30-year auction.
Author  Irene Q.
6 hours ago
Gold hit a two-month low on 7 October, with spot touching roughly $4,090 and COMEX December futures closing at $4,140.70, even as the New York Fed's one-year inflation expectation rose to 3.9% — its highest since May 2023. The paradox resolves through real yields: the 30-year Treasury yield reached 5.732% intraday, its highest since 2002. Here are the levels, the institutional split, and the scenarios into tonight's jobless claims and 30-year auction.
goTop
quote