


Gold falls to a two-month low as real yields bite — can $4,000 hold?

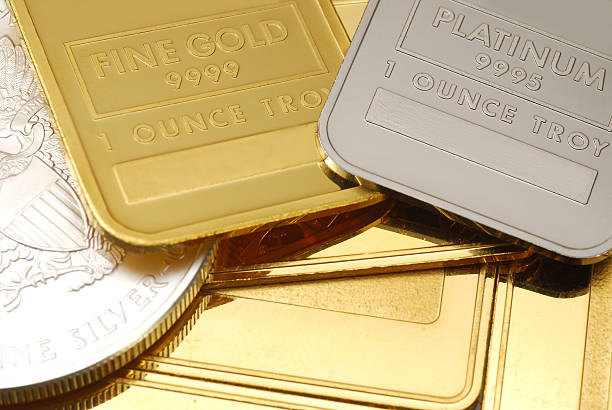
Gold hit a two-month low on 7 October — spot touched roughly $4,090 and COMEX December futures settled at $4,140.70, down 1.1% — and the metals complex sold off with it: silver briefly lost the $60 handle (low $59.53) and platinum dropped more than 3% to $1,633. What makes the move unusual is what happened the same day: the New York Fed's survey showed one-year inflation expectations rising to 3.9%, the highest since May 2023. Higher inflation expectations, and gold at a two-month low — the paradox resolves through one variable: real yields.
The move
The decline has been orderly rather than panicked. COMEX gold closed the week starting 2 October around $4,160, then slid through Wednesday's session to a $4,091.20 low — the weakest since early August — before settling at $4,140.70. In Asia on Thursday, dip-buying lifted spot back to about $4,137 (+0.6%), with the session range holding between $4,103 and $4,140.
The broader metals board was weaker than gold itself. Silver fell 2.1% to $60.29 on the COMEX close after a $59.53 low, and platinum's overnight low of $1,633 marked a drop of more than 3% — the two most industrial-levered precious metals are acting like risk assets, not havens.
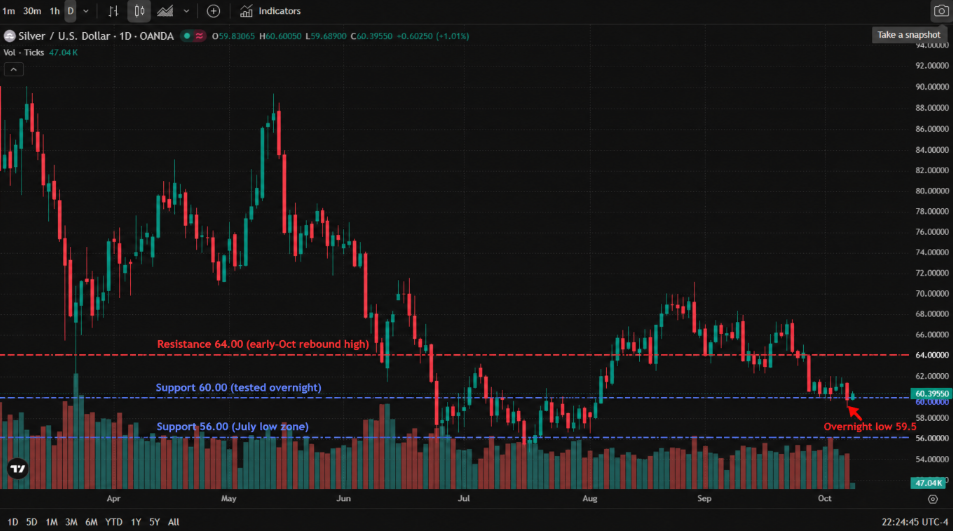
* Chart source: TradingView official chart screenshot, data source OANDA (XAG/USD).
Why real yields beat inflation expectations
Gold's two traditional drivers are pointing in opposite directions, and the market is trading only one of them.
The inflation side is genuinely hot. The New York Fed's Survey of Consumer Expectations, published Wednesday, put one-year inflation expectations at 3.9% (from 3.6%) and three-year expectations at 3.3%. Oil above $100 — Brent held around $100.20 after Iran's latest Strait of Hormuz warnings — keeps the energy-inflation channel open.
The rate side is stronger. The Treasury's official par curve shows the 30-year yield at 5.67% (5.732% intraday), its highest since 2002, with the 10-year at 5.28%. What matters for gold is the gap: with nominal yields above both the inflation print and the inflation expectation, the real yield keeps rising — and gold pays no yield at all. That is the entire explanation for a falling gold price in an environment of rising inflation expectations, and it is precisely the mechanism Natixis analyst Bernard Dahdah highlighted when he argued gold has "re-established" its negative correlation with oil and cut his year-end target to $4,100 — a level Wednesday's low has now touched. The dollar adds a second layer: the index sits near an 18-month high.
The institutional split — and where demand actually sits
The gap between the most bullish and most bearish published targets is extraordinary: $3,500 (Natixis bear case) to $7,150 (ICBC Standard Bank's Julia Du). In the middle, State Street's Aakash Doshi argues the $4,000 line is a "structural floor" backed by central-bank buying, with a path to $5,000 by Q2 2027.
Physical demand gives the bulls their best material. China's post-Golden Week buying season is now underway, and the Shanghai gold premium sat at a three-month high before the holiday — evidence that Chinese buyers were paying up even as Western futures sold off. That is the counterweight to the real-yield story, and it is why $4,000, not $4,100, is the level most institutions name as the line that matters.
Levels and technicals
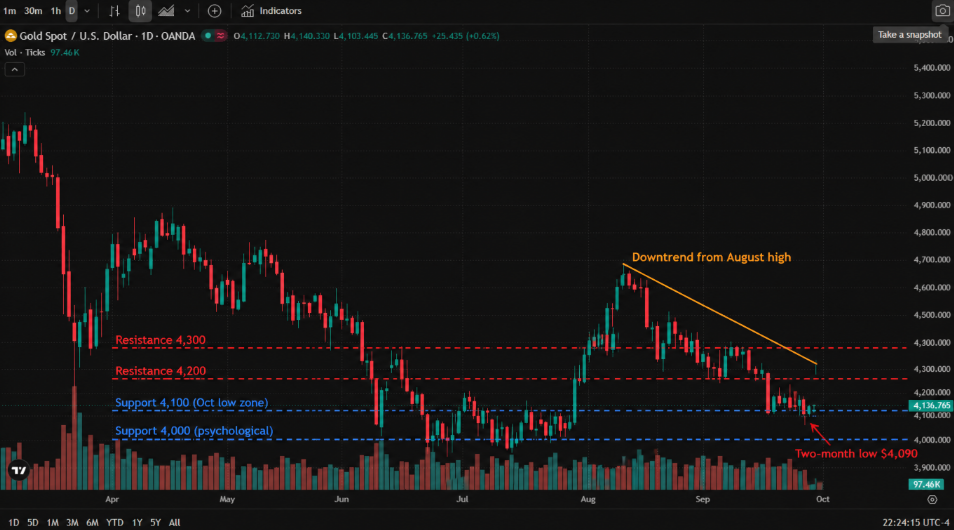
* Chart source: TradingView official chart screenshot, data source OANDA (XAU/USD).
Gold key levels. Support: $4,100 (Wednesday's low zone) / $4,000 (the psychological line, State Street's "structural floor") / $3,950 (July low zone). Resistance: $4,200 / $4,251 (the 30 September high) / $4,300 (where the downtrend line from the August high converges). The first thing to watch is whether $4,100 holds on a closing basis — it has been tested once and held, barely.
What to watch, and the two scenarios
Tonight brings two scheduled tests: US initial jobless claims at 8:30 ET (consensus 200k, prior 197k) and the $22 billion 30-year Treasury auction at 1:00 pm ET (previous award 5.308%). For gold, the auction matters as much as the data — a strong long-end take-down would pull the 30-year yield back below its highs and remove the single biggest headwind, while a weak auction does the opposite.
Scenario A — $4,100 holds and the rebound extends. Soft claims or a solid auction push real yields lower; gold reclaims $4,162 and then $4,200, with the post-holiday Chinese buying season providing a physical bid underneath. A weekly close back above the August downtrend line (near $4,300) would end the correction narrative outright.
Scenario B — $4,100 gives way. A close below Wednesday's $4,090 low opens a direct test of $4,000. Losing that level — the line institutions most often name — puts $3,950 and then the $3,500 bear case in play. The trigger would be a 30-year yield pushing beyond 5.732% while the dollar presses its highs.
Read more
Before making any trading decisions, it is important to equip yourself with sufficient fundamental knowledge, have a comprehensive understanding of market trends, be aware of risks and hidden costs, carefully consider investment targets, level of experience, risk appetite, and seek professional advice if necessary.
Furthermore, the content of this article is solely the author's personal opinion and does not necessarily constitute investment advice. The content of this article is for reference purposes only, and readers should not use this article as a basis for any investment decisions.
Investors should not rely on this information as a substitute for independent judgment or make decisions solely based on this information. It does not constitute any trading activity and does not guarantee any profits in trading.
If you have any inquiries regarding the data, information, or content related to Mitrade in this article, please contact us via email: insights@mitrade.com. The Mitrade team will carefully review the content to continue improving the quality of the article.


