

Ripple and Stellar outlook: XRP and XLM face resistance amid weak signals

Source Fxstreet
  • XRP extends its correction, trading below $1.480 on Tuesday after three consecutive days of losses since last week.
  • XLM faces rejection from the $0.234 resistance level, suggesting a downside move.
  • Mixed derivatives positioning and bearish on-chain metrics cap upside for both altcoins.

Ripple (XRP) and Stellar (XLM) remain under pressure on Tuesday as bulls struggle to sustain recent gains. XRP extends its decline below $1.480 after three consecutive losing days, while XLM faces rejection near the $0.234 resistance zone. In addition, mixed derivatives outlook and weakening on-chain metrics suggest that bullish momentum remains fragile, leaving both XRP and XLM vulnerable to further losses.

Mixed derivatives metrics cap upside

Derivatives data shows a mixed and cautious outlook among traders. CoinGlass’ long-to-short ratio for Ripple reads 1.02 on Tuesday. A ratio above one indicates bullish sentiment, as traders bet that asset prices will rise.

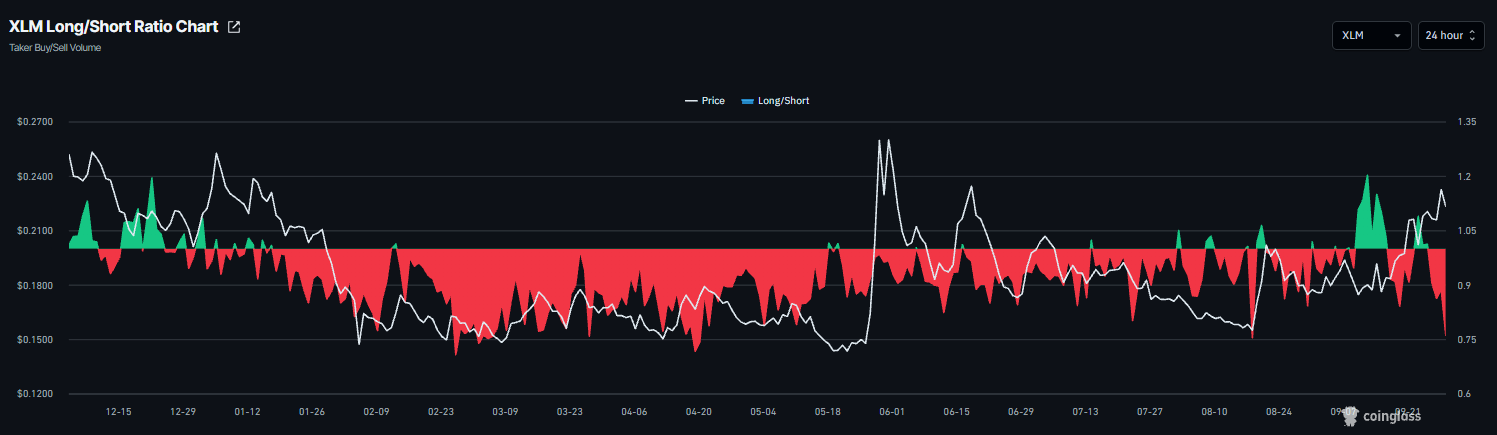
Meanwhile, XLM’s ratio read 0.76 on Tuesday, nearing the lowest level over a month. A ratio below one indicates bearish sentiment, as traders bet that asset prices will fall.
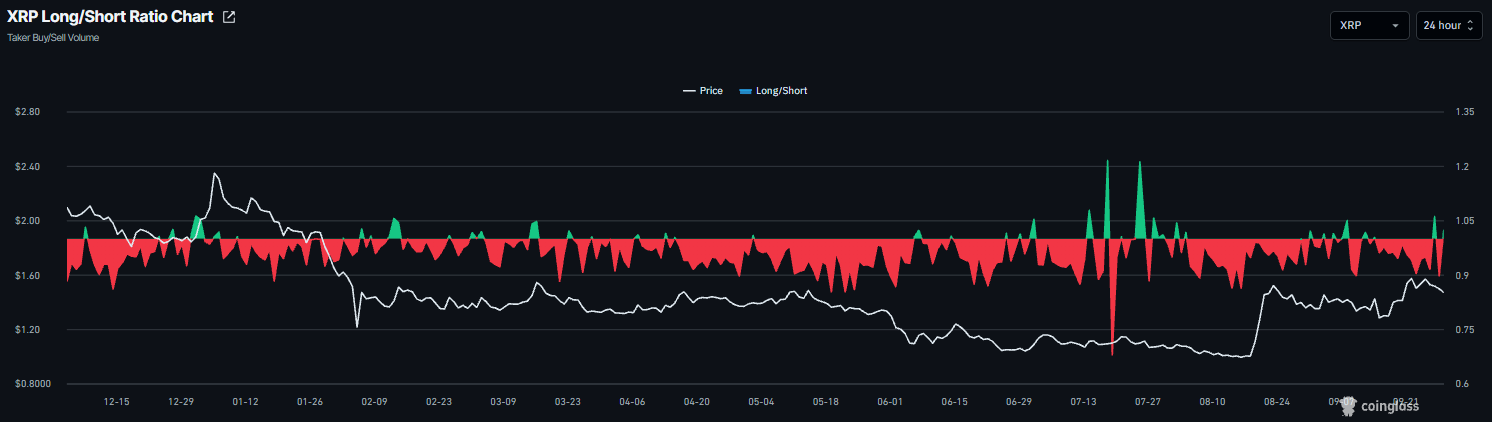
XRP long-to-short ratio chart. Source: Coinglass
XLM long-to-short ratio chart. Source: Coinglass

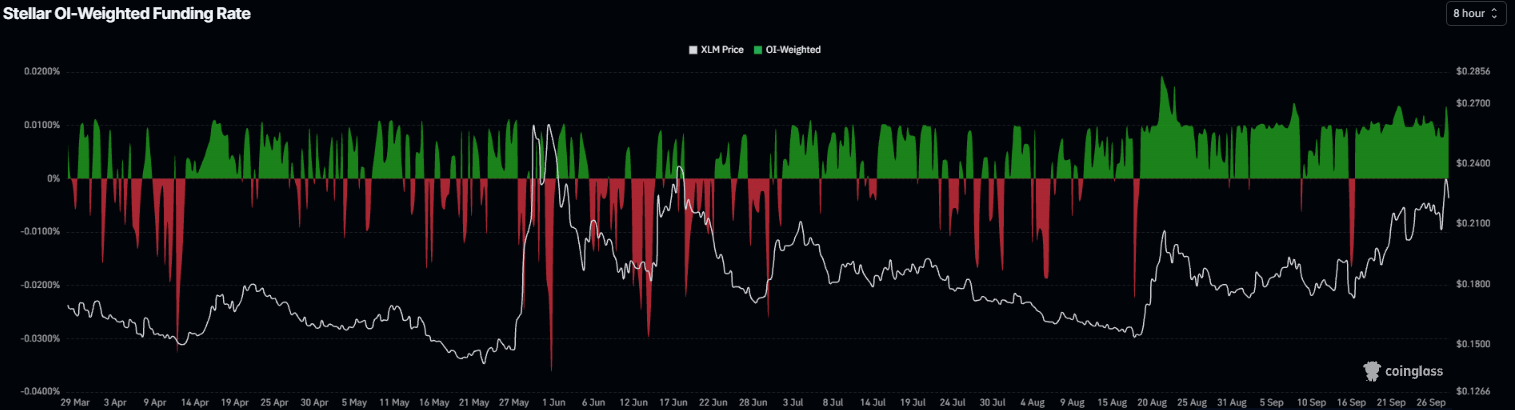
In addition, the XRP funding rate flipped positive on September 24, reading 0.0020% on Tuesday. Similarly, the XLM funding rate flipped positive on September 14, reading 0.0083% on Tuesday. These positive rates indicate longs are paying shorts, reflecting a bullish outlook.
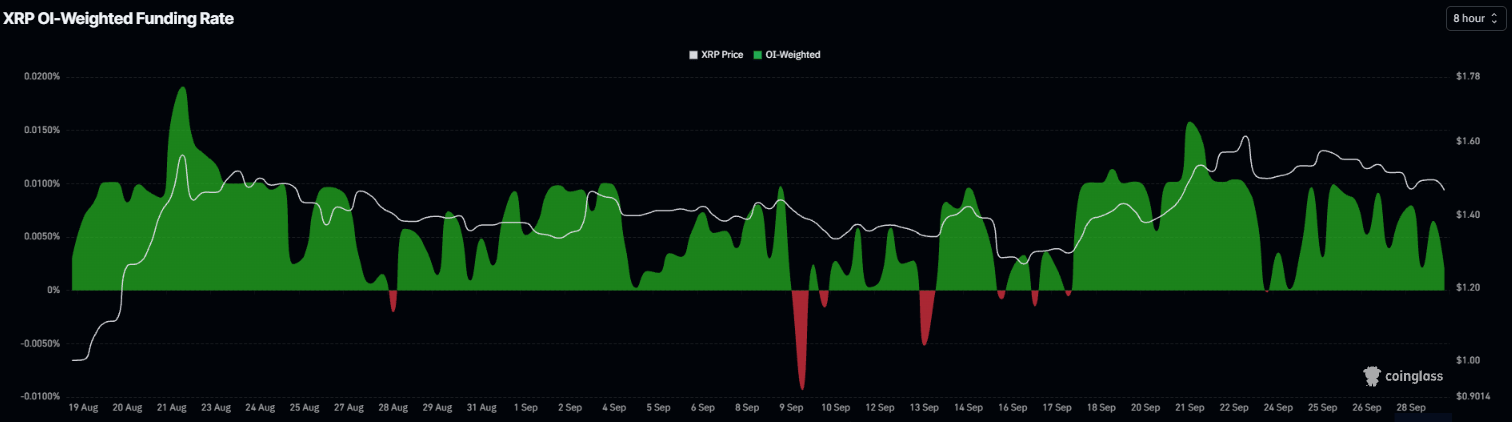
XRP funding rate chart. Source: Coinglass
XLM funding rate chart. Source: Coinglass

On-chain data shows signs of concern

CryptoQuant’s summary data shows caution for both altcoins. XRP’s spot and futures markets show overheating conditions, while the futures market shows sell-side dominance. These highlight a bearish, cautious sentiment bias among Ripple traders.

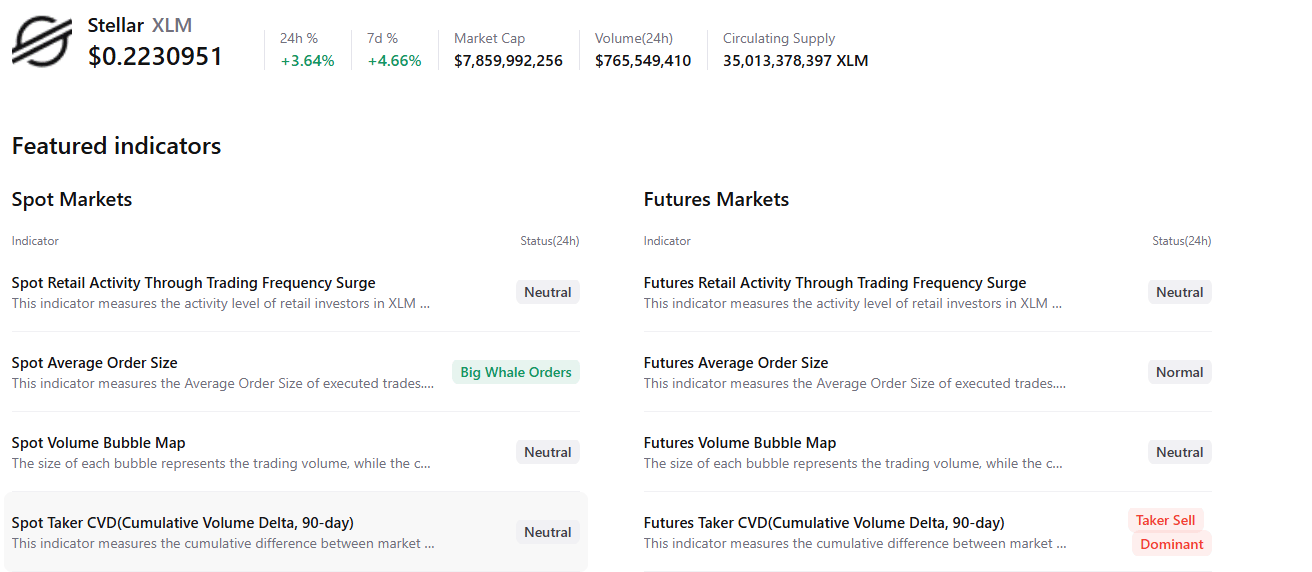
For XLM, spot shows large whale orders; however, the futures market also shows sell-side dominance and overheating conditions, indicating a negative outlook among Stellar traders.
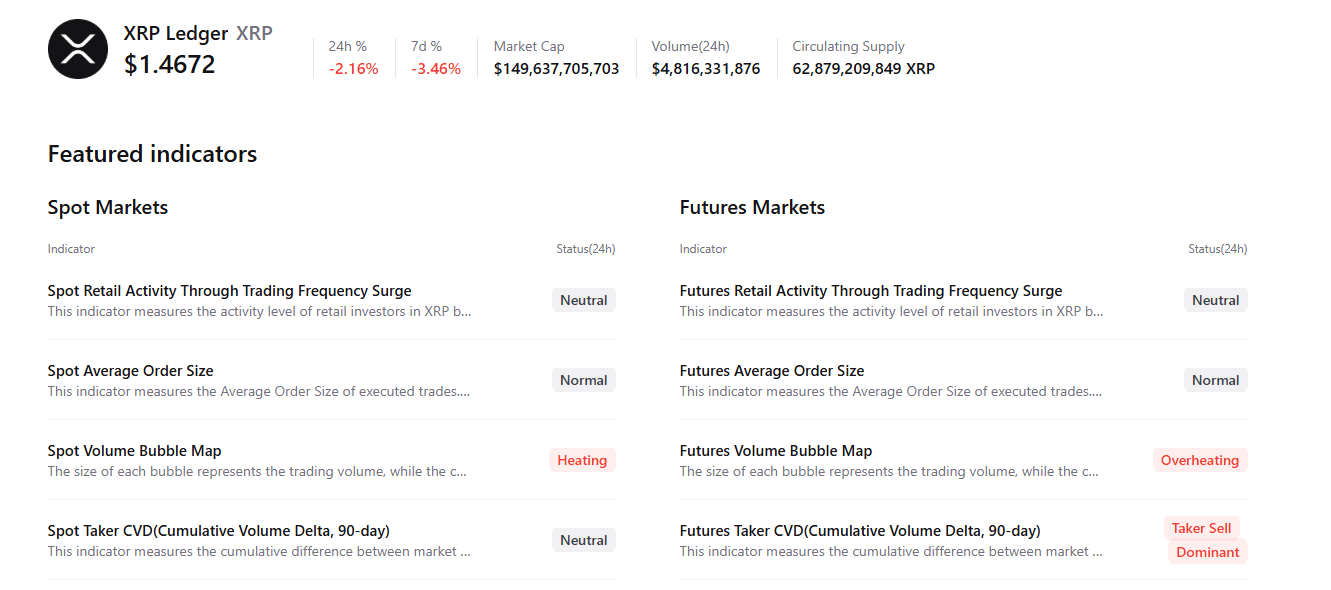
XRP summary data chart. Source: CryptoQuant
XLM summary data chart. Source: CryptoQuant

XRP technical outlook: Faces correction

XRP price trades at $1.469 on Tuesday after three consecutive days of losses since last week. Despite the correction, XRP remains bullish, holding above the 50-day and 200-day exponential moving averages (EMAs) at $1.365 and $1.369, while the 100-day EMA at $1.307 reinforces the broader constructive structure below.

Momentum is more subdued than earlier in the rally, with the Relative Strength Index (RSI) slipping toward a neutral 53 and the Moving Average Convergence Divergence (MACD) indicator flattening around zero, hinting at consolidation rather than a clean continuation impulse.

On the downside, initial support is seen at the nearby structural band formed by the 50-day and 200-day EMAs just above $1.370, followed by the 100-day EMA and horizontal support in the $1.307–$1.300 area. Meanwhile, a deeper pullback would expose the psychological floor at $1.000. 

On the topside, XRP faces first resistance at the horizontal level marked around $1.574, and a break above this barrier would likely open the way toward the next key cap near $1.900.
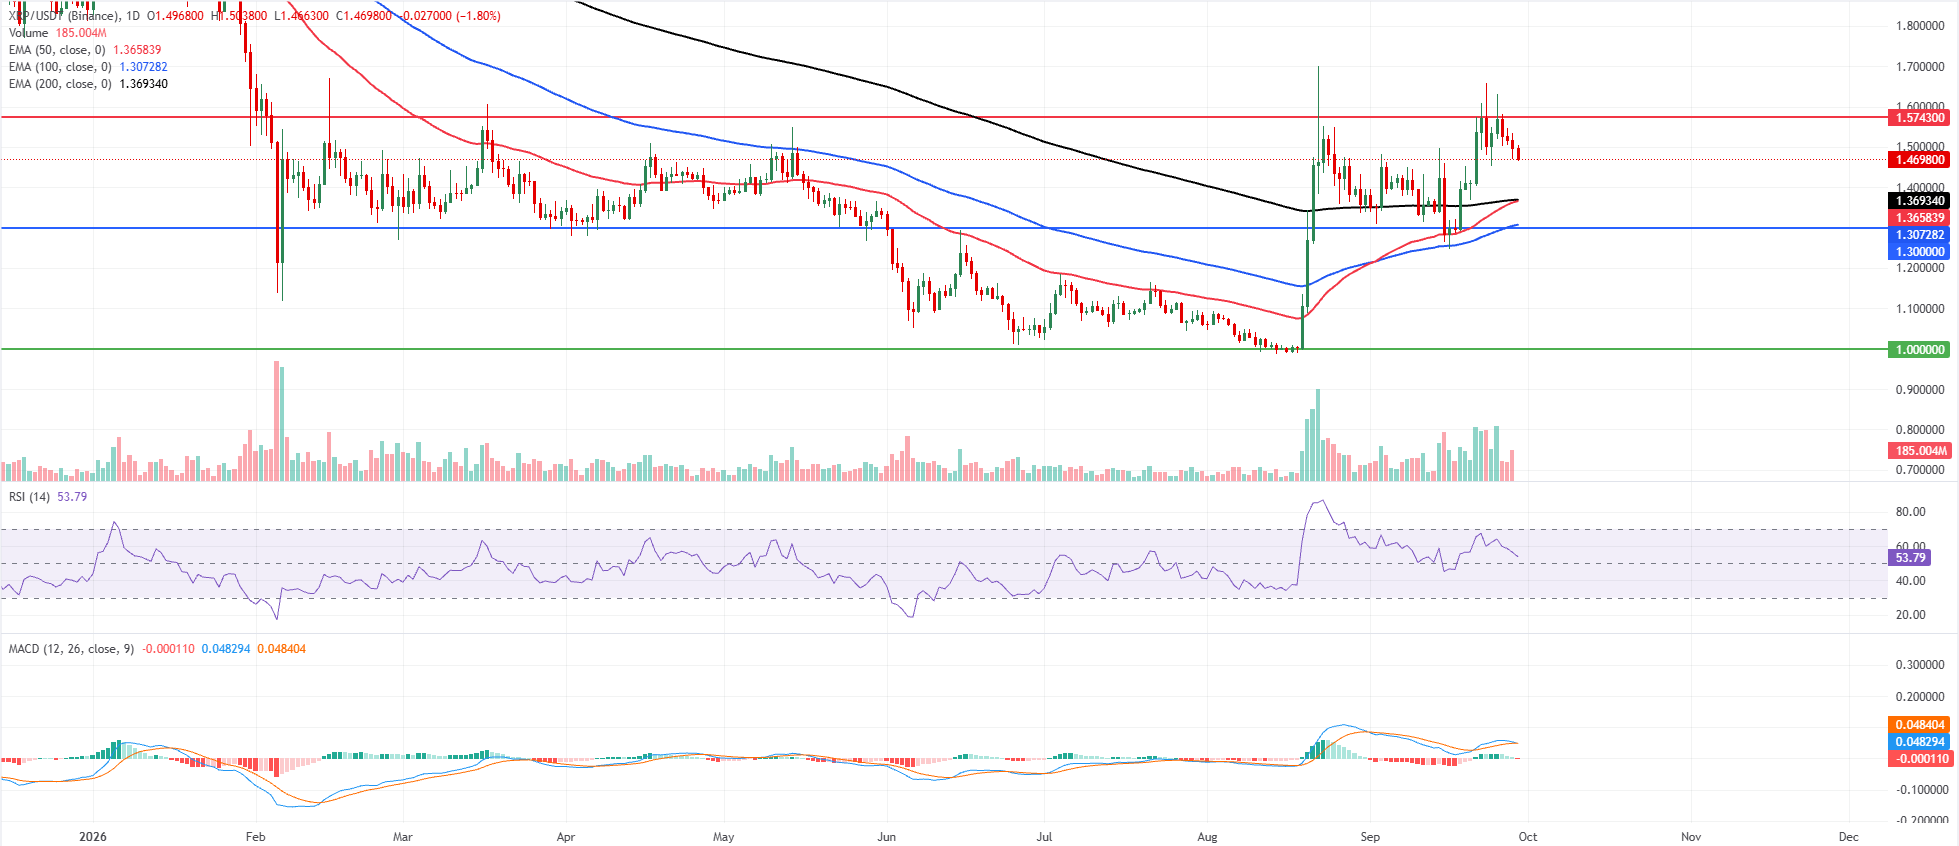
XRP/USDT daily chart

XLM technical outlook: Bulls take a breather

XLM price trades at $0.224 on Tuesday, facing rejection from key resistance at $0.234. However, XLM remains bullish, trading well above the 50-day, 100-day, and 200-day EMAs clustered between roughly $0.187 and $0.193.

The upward-sloping former trendline support, now tracked around $0.182, underpins the broader advance. At the same time, momentum readings remain constructive: the RSI at 62 points to persistent bullish pressure without yet flagging overbought extremes, and the MACD line remains in positive territory, suggesting buying interest is still in control.

On the topside, initial resistance sits at the horizontal barrier near $0.234; a break would open the way to further gains and reinforce the current uptrend.

On the downside, nearest support emerges from the EMA cluster, with the 200-day EMA at $0.190 and the 50-day EMA at $0.192 providing the first technical floors, followed by the 100-day EMA at $0.187 and the former trendline support at $0.182. Deeper pullbacks would expose horizontal supports at $0.177 and $0.142, levels that would need to hold to prevent a broader deterioration of the bullish structure.
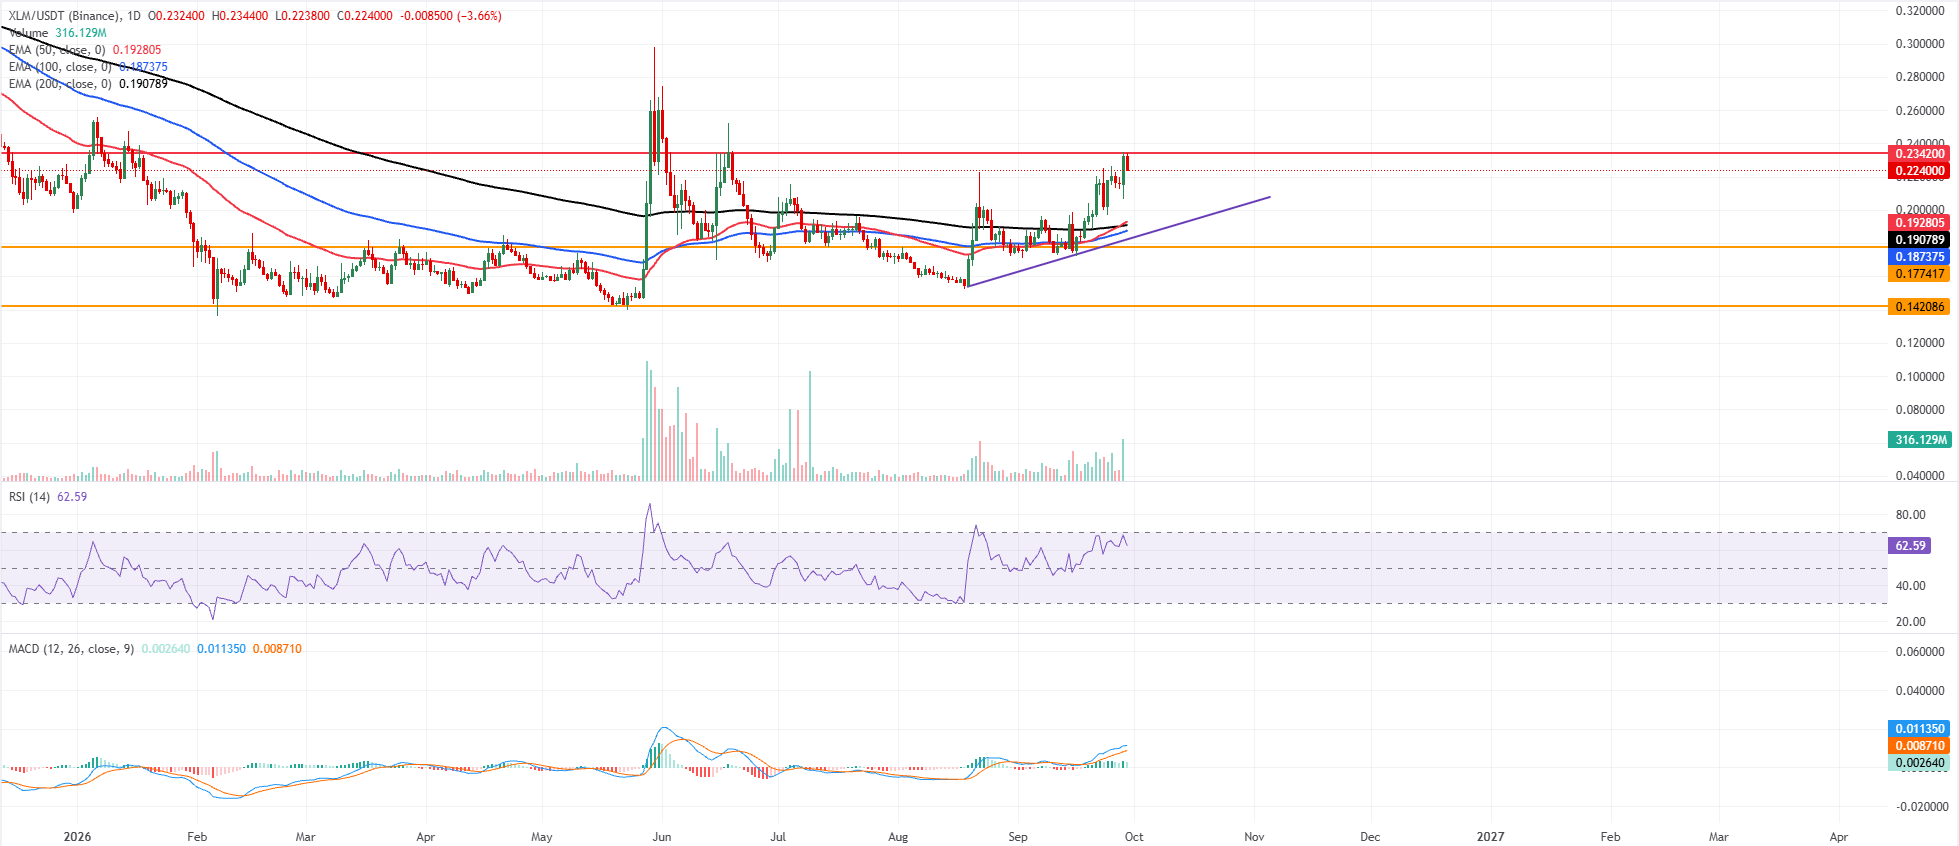
XLM/USDT daily chart

(The technical analysis of this story was written with the help of an AI tool. Know more.)

Disclaimer: For information purposes only. Past performance is not indicative of future results.
placeholder
Gold ends three-week slide at the $4,400 line — eight straight days of ETF inflows vs a 5% 10-year and a 100 dollarSpot gold closed Friday at $4,378.39, up 0.84% on the day and about 0.8% for the week — its first weekly gain in four weeks — with the intraday high of $4,399.67 leaving it 33 cents shy of the $4,400 line. Gold ETFs have now logged eight straight sessions of inflows, but with the 10-year back above 5% and the dollar index near 100, here is what decides whether this is a reversal or a bounce.
Author  Suzie
Sep 20, Sun
Spot gold closed Friday at $4,378.39, up 0.84% on the day and about 0.8% for the week — its first weekly gain in four weeks — with the intraday high of $4,399.67 leaving it 33 cents shy of the $4,400 line. Gold ETFs have now logged eight straight sessions of inflows, but with the 10-year back above 5% and the dollar index near 100, here is what decides whether this is a reversal or a bounce.
placeholder
October hike odds climb toward 60% as Goldman and BofA both flip — what Warsh's "dose of accommodation" really changedRate futures now price roughly 55% to 62% for a 25bp hike at the October 27-28 FOMC, up from about 30% before Chair Warsh's post-meeting framing that the Fed is merely "removing some accommodation." Goldman Sachs has added an October hike to its forecast and Bank of America now sees moves in both October and December. Here is the repricing, the language behind it, and the two data points that decide it.
Author  Irene Q.
Sep 23, Wed
Rate futures now price roughly 55% to 62% for a 25bp hike at the October 27-28 FOMC, up from about 30% before Chair Warsh's post-meeting framing that the Fed is merely "removing some accommodation." Goldman Sachs has added an October hike to its forecast and Bank of America now sees moves in both October and December. Here is the repricing, the language behind it, and the two data points that decide it.
placeholder
Four jobs reports in five days: what JOLTS, ADP, claims and the September payrolls mean for the October Fed decisionThe US labour market faces its densest data week of the month. JOLTS job openings land Tuesday (7.2 million expected), ADP on Wednesday (70,000 expected), initial claims on Thursday and the September non-farm payrolls on Friday (100,000 expected, down from 162,000). Markets price a 64%-70% chance of another quarter-point Fed hike on October 28. The dollar index sits at 100.77 and the S&P 500 at 7,729.8.
Author  Mitrade
Yesterday 06: 33
The US labour market faces its densest data week of the month. JOLTS job openings land Tuesday (7.2 million expected), ADP on Wednesday (70,000 expected), initial claims on Thursday and the September non-farm payrolls on Friday (100,000 expected, down from 162,000). Markets price a 64%-70% chance of another quarter-point Fed hike on October 28. The dollar index sits at 100.77 and the S&P 500 at 7,729.8.
placeholder
RBA set to hike interest rate to 4.60% in September as inflation remains elevatedThe Reserve Bank of Australia (RBA) is widely expected to raise the Official Cash Rate (OCR) by 25 basis points (bps) to 4.60% from 4.35% on Tuesday, after keeping rates unchanged at its previous two meetings
Author  FXStreet
8 hours ago
The Reserve Bank of Australia (RBA) is widely expected to raise the Official Cash Rate (OCR) by 25 basis points (bps) to 4.60% from 4.35% on Tuesday, after keeping rates unchanged at its previous two meetings
placeholder
Nvidia's $150 billion buyback landed — and the AI sector fell anyway. That's the signal worth tradingNvidia closed up 1.68% at $228.86 on 28 September after announcing a $150 billion share repurchase authorisation, the largest single corporate buyback on record, while the rest of the AI complex sold off: AMD -3.6%, Micron -2.6%, Meta -4.8% and the Philadelphia Semiconductor Index -1.61%. The divergence is not noise. Capital is rotating toward cash-flow certainty, not abandoning the AI theme. With Micron reporting after the close on 30 September, here is what the split means.
Author  Irene Q.
3 hours ago
Nvidia closed up 1.68% at $228.86 on 28 September after announcing a $150 billion share repurchase authorisation, the largest single corporate buyback on record, while the rest of the AI complex sold off: AMD -3.6%, Micron -2.6%, Meta -4.8% and the Philadelphia Semiconductor Index -1.61%. The divergence is not noise. Capital is rotating toward cash-flow certainty, not abandoning the AI theme. With Micron reporting after the close on 30 September, here is what the split means.
Related Instrument
goTop
quote