

Pi Network Price Forecast: PI stalls near key resistance as risk-on sentiment holds

Source Fxstreet
  • Pi Network is up nearly 2% on Tuesday, testing a bullish breakout above its 50-day EMA at $0.091.
  • The broader cryptocurrency market maintains a risk-on tone, with the Fear and Greed Index at 68.
  • The technical outlook for PI is mixed, with momentum indicators showing neutral signals.

Pi Network (PI) shows a mild recovery of nearly 2% on Tuesday, after losing over 2% the previous day. The broader cryptocurrency market retains a risk-on tone, hinting at potential upside for altcoins. PI token must surpass its 50-day Exponential Moving Average (EMA) at $0.0917 to reclaim near-term bullish tone.

Broader market sentiment backs upside potential

CoinMarketCap’s Fear and Greed Index stands at 68 on Tuesday, down from 78 last week but remains well above the neutral zone, suggesting persistent risk-on market sentiment. A sustained bullish tone in the broader crypto market could fuel investors’ risk appetite for the PI token amid the upcoming v28 protocol upgrade, as previously reported by FXStreet.
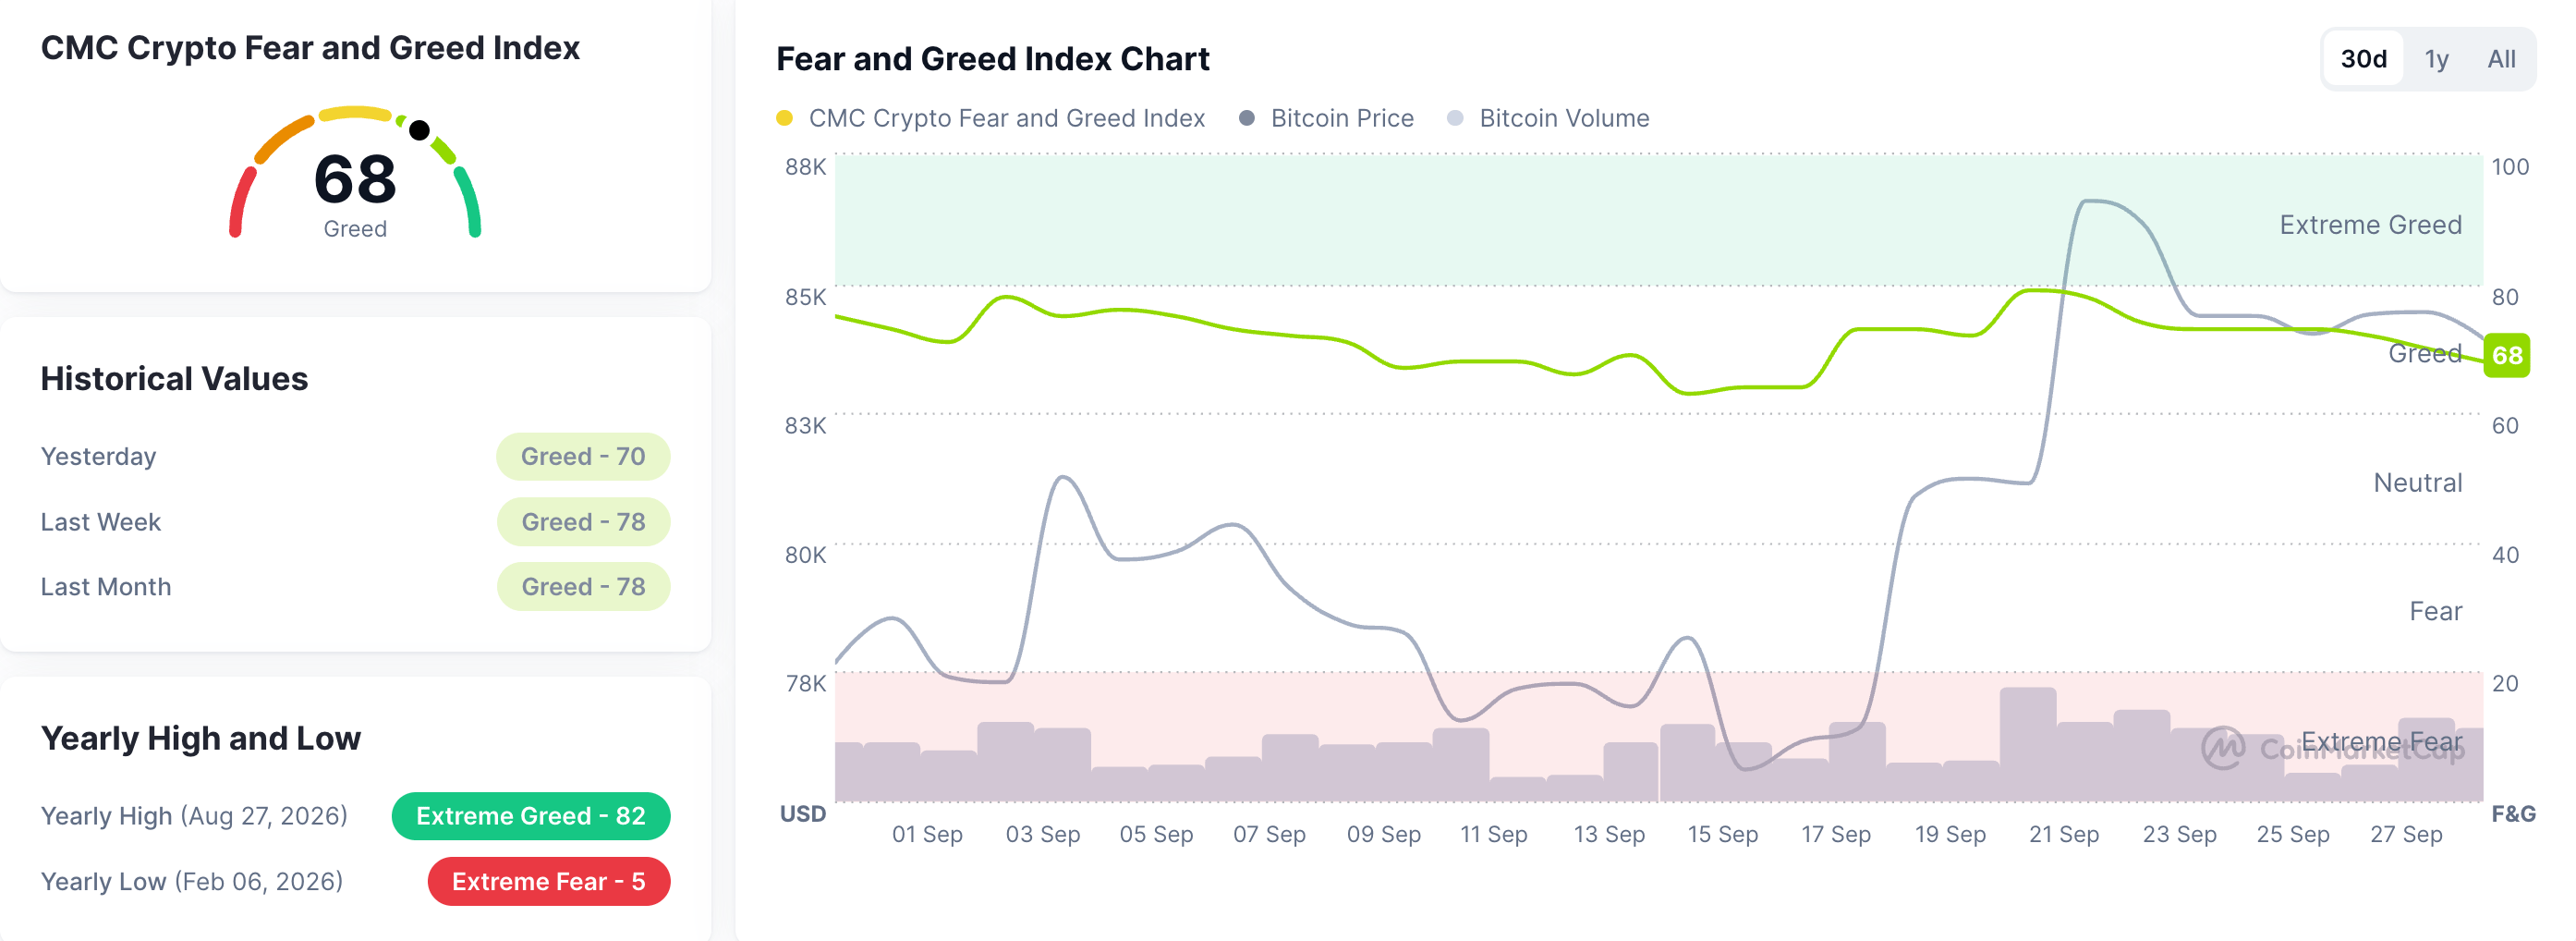
Fear and Greed Index. Source: CoinMarketCap

Technical outlook: Pi Network capped key resistance cluster

Pi Network price hovers around $0.09050 at press time on Tuesday, maintaining a bearish near-term bias as it holds below its 50-day EMA at $0.0917, which serves as the immediate resistance. The 100-day EMA at $0.1008 and the 200-day EMA at $0.1337 hold far above the price, reinforcing a broader downtrend.

A confirmed breakout above the 50-day EMA at $0.0917 could target the 50% retracement of the downswing from $0.1341 to $0.0704, at $0.0990,which is reinforced by the 100-day EMA at $0.1008.

Momentum is more balanced, with the Relative Strength Index (RSI) hovering around 50 on the daily chart, while the Moving Average Convergence Divergence (MACD) is holding just above its signal line, suggesting consolidation rather than a clear reversal.

Chart Analysis PI/USD (baha Crypto)
PI/USD daily price chart.

On the downside, immediate support aligns with the 23.6% Fibonacci retracement at $0.0827, while a deeper slide would expose the structural floor around the cycle low near $0.0704.

(The technical analysis of this story was written with the help of an AI tool. Know more.)

Disclaimer: For information purposes only. Past performance is not indicative of future results.
placeholder
Gold Price Forecast: Gold Plunges to Seven-Week Low, Can $4,100 Hold? Spot gold (XAUUSD) plunged 4% on Monday to close at $4,114.93 per ounce, hitting an intraday low of $4,110.80, its lowest level since August 5. Heading into Tuesday's Asian trading sessio
Author  TradingKey
7 hours ago
Spot gold (XAUUSD) plunged 4% on Monday to close at $4,114.93 per ounce, hitting an intraday low of $4,110.80, its lowest level since August 5. Heading into Tuesday's Asian trading sessio
placeholder
The 30-year Treasury just hit a 22-year high — and the bond market is not pricing the Fed, it is pricing the deficitThe 30-year Treasury yield closed at 5.56% on 28 September, the highest since June 2004, while the 10-year reached 5.24% and the 20-year 5.60%. The curve has steepened roughly 30bp in eight sessions even as October hike odds sit at 70.3%. That gap is the story: the long end is repricing fiscal and inflation risk, not policy. With PCE on Wednesday and payrolls on Friday, here is what the long end is really saying.
Author  Irene Q.
9 hours ago
The 30-year Treasury yield closed at 5.56% on 28 September, the highest since June 2004, while the 10-year reached 5.24% and the 20-year 5.60%. The curve has steepened roughly 30bp in eight sessions even as October hike odds sit at 70.3%. That gap is the story: the long end is repricing fiscal and inflation risk, not policy. With PCE on Wednesday and payrolls on Friday, here is what the long end is really saying.
placeholder
Nvidia's $150 billion buyback landed — and the AI sector fell anyway. That's the signal worth tradingNvidia closed up 1.68% at $228.86 on 28 September after announcing a $150 billion share repurchase authorisation, the largest single corporate buyback on record, while the rest of the AI complex sold off: AMD -3.6%, Micron -2.6%, Meta -4.8% and the Philadelphia Semiconductor Index -1.61%. The divergence is not noise. Capital is rotating toward cash-flow certainty, not abandoning the AI theme. With Micron reporting after the close on 30 September, here is what the split means.
Author  Irene Q.
10 hours ago
Nvidia closed up 1.68% at $228.86 on 28 September after announcing a $150 billion share repurchase authorisation, the largest single corporate buyback on record, while the rest of the AI complex sold off: AMD -3.6%, Micron -2.6%, Meta -4.8% and the Philadelphia Semiconductor Index -1.61%. The divergence is not noise. Capital is rotating toward cash-flow certainty, not abandoning the AI theme. With Micron reporting after the close on 30 September, here is what the split means.
placeholder
RBA set to hike interest rate to 4.60% in September as inflation remains elevatedThe Reserve Bank of Australia (RBA) is widely expected to raise the Official Cash Rate (OCR) by 25 basis points (bps) to 4.60% from 4.35% on Tuesday, after keeping rates unchanged at its previous two meetings
Author  FXStreet
15 hours ago
The Reserve Bank of Australia (RBA) is widely expected to raise the Official Cash Rate (OCR) by 25 basis points (bps) to 4.60% from 4.35% on Tuesday, after keeping rates unchanged at its previous two meetings
placeholder
Silver Price Forecast: XAG/USD falls like house of cards on Fed’s hawkish narrativeSilver price (XAG/USD) is down 4.3% to near $61.50 during the European trading session on Monday. The white metal nosedives as elevated United States (US) Treasury Yields have diminished its appeal.
Author  FXStreet
Yesterday 09: 04
Silver price (XAG/USD) is down 4.3% to near $61.50 during the European trading session on Monday. The white metal nosedives as elevated United States (US) Treasury Yields have diminished its appeal.
goTop
quote