


Gold reclaims $4,000 as Oil eases, Fed decision tests recovery
- Gold gains 0.6% to $4,020 after rebounding from $3,978.
- Lower Oil prices and Treasury yields provide relief for Bullion.
- December Fed hike odds reach 83% ahead of Warsh's remarks.
Gold price recovers, rises 0.6% after finishing last week below the $4,000 figure as speculation of a de-escalation in the US-Iran conflict pushed energy prices lower ahead of this week’s Federal Reserve (Fed) monetary policy meeting. The XAU/USD trades at $4,020 after bouncing off daily lows of $3,978.
XAU/USD rebounds as easing Treasury yields and Middle East diplomacy support Bullion
Geopolitics continued to drive price action, particularly Oil prices, which have shown a mild positive correlation with the Greenback. Iran, Turkey, Pakistan and Saudi Arabia – the Mecca Pact members – agreed to continue talks. Meanwhile, speculation of a US-Israel coordinated attack on Tehran looms as Iranian officials excluded nuclear talks from the Mecca Pact reunion.
West Texas Intermediate (WTI), the US Oil benchmark, edges 0.5% lower to $102.90, which opened the door for Bullion’s recovery as US Treasury yields edge lower.
The US 10-year T-note yield, which correlates inversely with Gold prices, falls by 2 basis points to 4.978%, as investors price out a Fed rate hike this Wednesday.
At the time of writing, money markets had priced in an 83% chance that the Fedwill raise rates at the December meeting. Nevertheless, investors await Fed Chair Kevin Warsh's press conference, in which he could signal the central bank’s next move, even though he doesn’t provide guidance.
Traders should be aware that although Gold is a hedge against inflation, it doesn’t fare well in high-interest-rate environments. If Warsh’s words are hawkish, XAU/USD might press lower, and a potential move below $4,000 is on the cards.
Besides this, traders eye the release of the US Personal Consumption Expenditures (PCE) data — the Fed's preferred inflation gauge — for fresh clues about the interest-rate outlook. Additionally, investors are bracing for the November 3 US midterm elections.
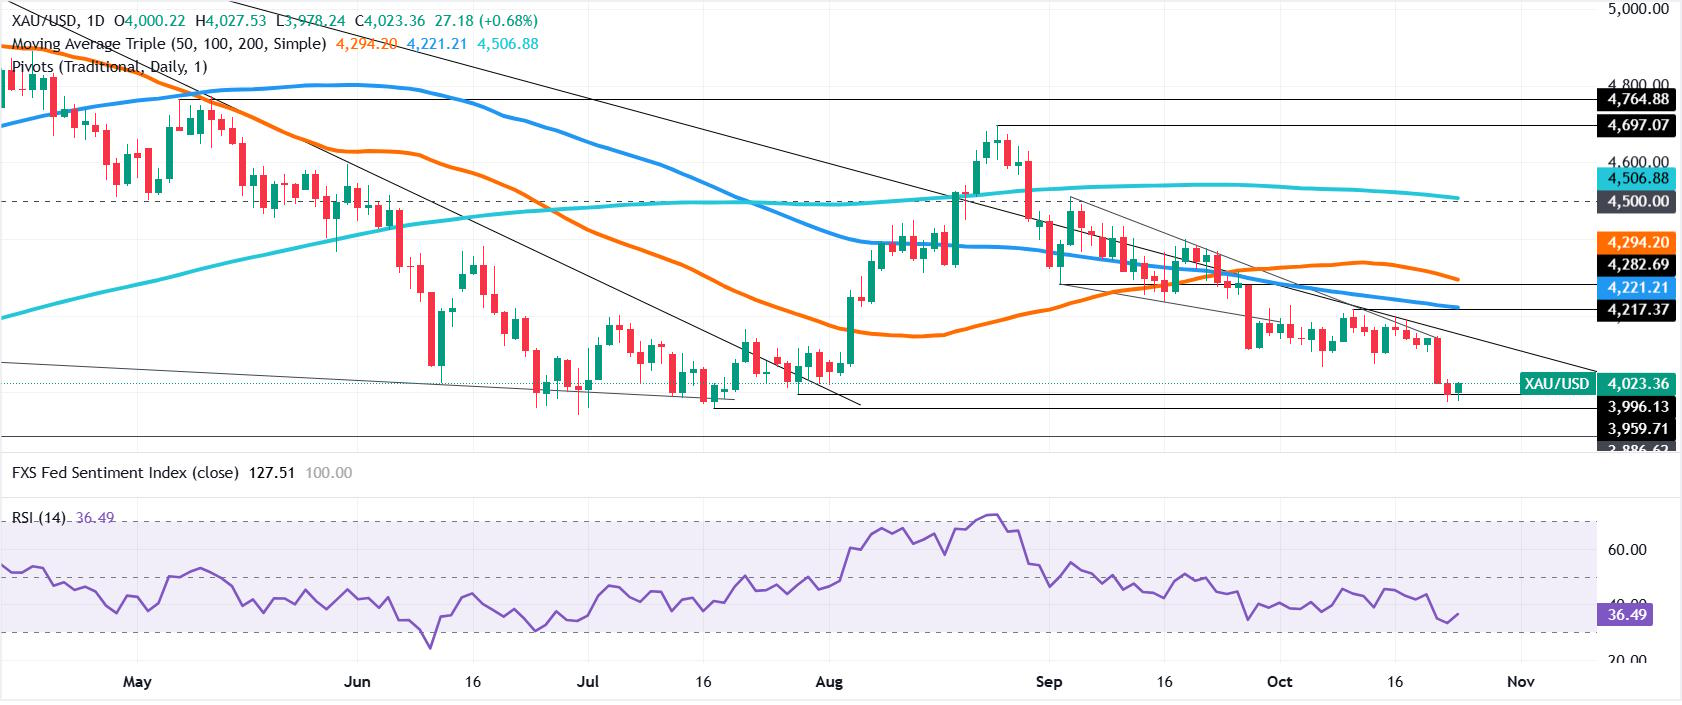
XAU/USD technical analysis: Gold buyers emerge below $4,000; up next is $4,050
After diving to a two-month low of $3,975, Gold is making a U-turn and is about to form a ‘bullish engulfing’ candle pattern, meaning that further upside is seen. Although the move is backed by momentum, with the Relative Strength Index (RSI) trending higher, the 14-day RSI remains bearish and could cap the move.
The first resistance for XAU/USD is $4,100. A breach of the latter exposes the $4,150 psychological level ahead of the $4,200 mark. If cleared, the next stop is the 100-day Simple Moving Average (SMA) at $4,221, and the 50-day SMA at $4,294.
For a bearish continuation, the first support for XAU/USD is $4,000, followed by October’s 23-day low of $3,975, with the next key support levels seen at the July 17 low at $3,959 and the year-to-date (YTD) low at $3,941.
Gold FAQs
Gold has played a key role in human’s history as it has been widely used as a store of value and medium of exchange. Currently, apart from its shine and usage for jewelry, the precious metal is widely seen as a safe-haven asset, meaning that it is considered a good investment during turbulent times. Gold is also widely seen as a hedge against inflation and against depreciating currencies as it doesn’t rely on any specific issuer or government.
Central banks are the biggest Gold holders. In their aim to support their currencies in turbulent times, central banks tend to diversify their reserves and buy Gold to improve the perceived strength of the economy and the currency. High Gold reserves can be a source of trust for a country’s solvency. Central banks added 1,136 tonnes of Gold worth around $70 billion to their reserves in 2022, according to data from the World Gold Council. This is the highest yearly purchase since records began. Central banks from emerging economies such as China, India and Turkey are quickly increasing their Gold reserves.
Gold has an inverse correlation with the US Dollar and US Treasuries, which are both major reserve and safe-haven assets. When the Dollar depreciates, Gold tends to rise, enabling investors and central banks to diversify their assets in turbulent times. Gold is also inversely correlated with risk assets. A rally in the stock market tends to weaken Gold price, while sell-offs in riskier markets tend to favor the precious metal.
The price can move due to a wide range of factors. Geopolitical instability or fears of a deep recession can quickly make Gold price escalate due to its safe-haven status. As a yield-less asset, Gold tends to rise with lower interest rates, while higher cost of money usually weighs down on the yellow metal. Still, most moves depend on how the US Dollar (USD) behaves as the asset is priced in dollars (XAU/USD). A strong Dollar tends to keep the price of Gold controlled, whereas a weaker Dollar is likely to push Gold prices up.
Recommended Articles


