


USD/JPY Price Forecast: Bulls test 160.00 as intervention risks rise
- Japanese intervention fears cap USD/JPY gains as bets on further Fed rate hikes support the US Dollar.
- USD/JPY breaks out of its recent range and holds above the 100-day and 200-day SMAs.
- RSI near 64 and a positive MACD point to firm upside momentum.
USD/JPY treads water near 160.00 on Friday as the risk of Japanese intervention limits gains despite a stronger US Dollar (USD). The pair is up 0.91% so far this week and remains on track for a third straight weekly gain as growing bets on further Federal Reserve (Fed) rate hikes keep the US-Japan yield gap in the Dollar’s favour.
Japanese Prime Minister Sanae Takaichi said on Friday that the government would strive to preserve an “orderly foreign exchange market,” adding that Japan remains in close contact with US financial authorities.
Japan rate convergence seen capping near-term yen gains
Analysts at Commerzbank argue that the Bank of Japan’s expected tightening will do little to support the currency in the short term. “While we also expect the Bank of Japan to implement two further rate rises – in December and in spring next year – this no longer favours the Japanese yen. Rather, it signals a convergence between the central banks, which will likely have little impact on the currency,” they write.
Against this backdrop, Commerzbank notes that “we see little potential for the Japanese yen in the near future,” pointing out that “in recent days, the yen has already weakened slightly due to rising market expectations regarding the Fed, and is currently trading just below USD-JPY 160.” The bank now looks for only limited gains over the coming quarters, stating that “by the middle of next year, we now expect only a slight appreciation towards 155.”
Technical analysis
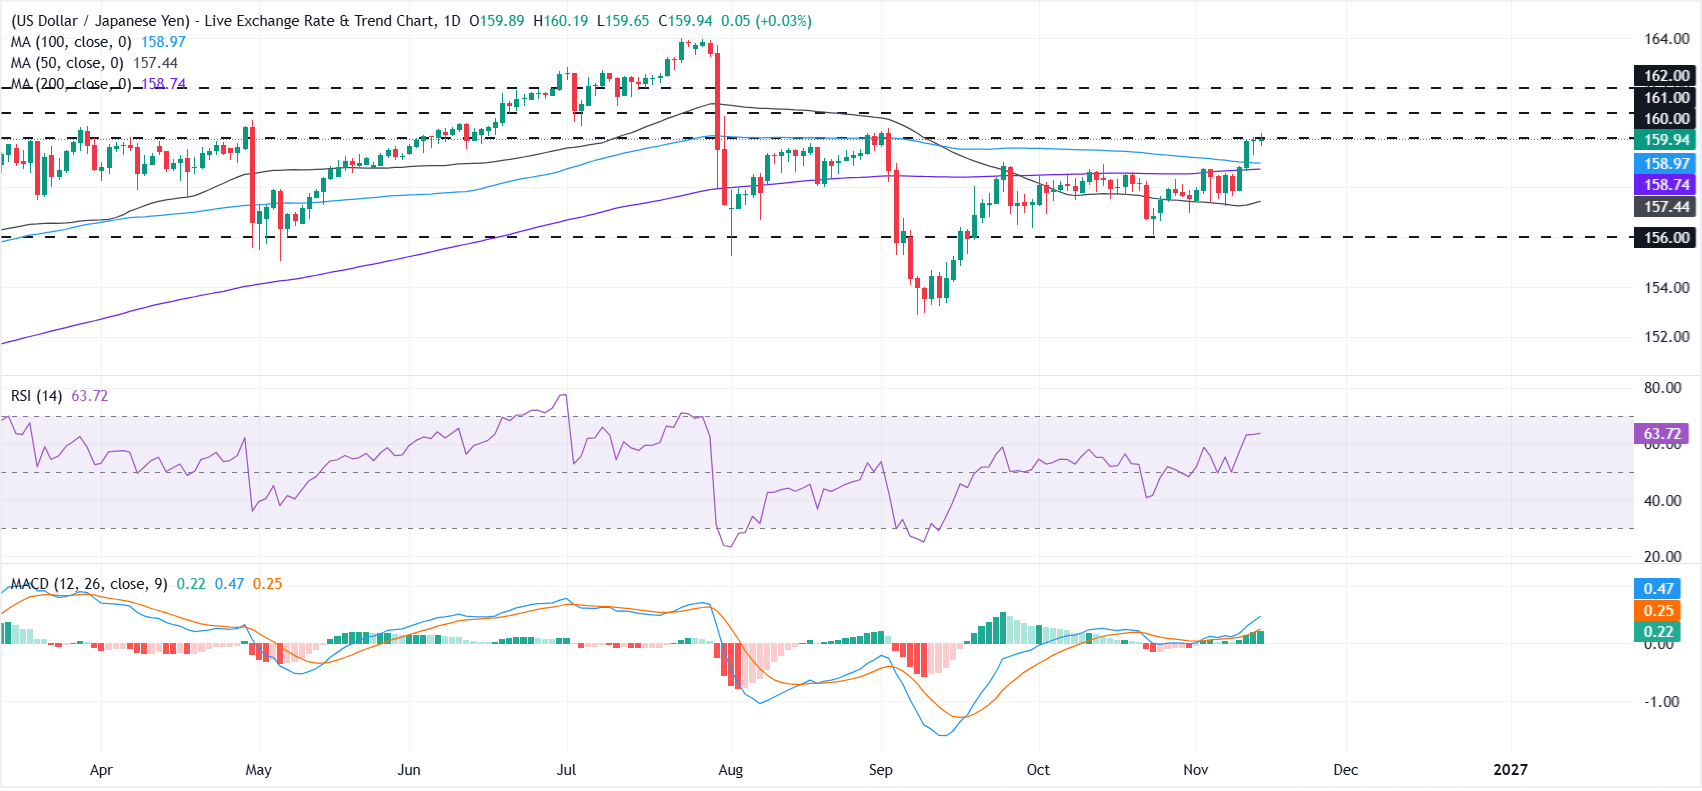
USD/JPY rebounded sharply from its September low of 152.89 before settling into a narrow trading range. The latest leg higher takes the pair above that range and the 100-day and 200-day Simple Moving Averages (SMAs) at 158.97 and 158.74, respectively.
The immediate focus is on the horizontal barrier at 160.00, which sits just above the market and acts as nearby resistance, while a firming Relative Strength Index (RSI) around 64 and a positive Moving Average Convergence Divergence (MACD) reading reinforce upward momentum rather than challenge the supportive price structure.
On the topside, a sustained break above the initial resistance at 160.00 would expose the next hurdles at 161.00 and 162.00, where prior supply is likely to re-emerge. On the downside, initial demand is seen around the current area backed by the 100-day SMA at 158.97 and the 200-day SMA at 158.74, ahead of deeper support at the 50-day SMA near 157.44 and the horizontal floor at 156.00.
(The technical analysis of this story was written with the help of an AI tool. Know more.)
Japanese Yen Price Today
The table below shows the percentage change of Japanese Yen (JPY) against listed major currencies today. Japanese Yen was the strongest against the Swiss Franc.
| USD | EUR | GBP | JPY | CAD | AUD | NZD | CHF | |
|---|---|---|---|---|---|---|---|---|
| USD | 0.03% | 0.04% | 0.03% | 0.02% | 0.15% | 0.19% | 0.32% | |
| EUR | -0.03% | 0.01% | 0.02% | 0.00% | 0.12% | 0.17% | 0.29% | |
| GBP | -0.04% | -0.01% | 0.00% | -0.01% | 0.10% | 0.15% | 0.28% | |
| JPY | -0.03% | -0.02% | 0.00% | -0.01% | 0.11% | 0.14% | 0.28% | |
| CAD | -0.02% | 0.00% | 0.00% | 0.00% | 0.12% | 0.16% | 0.29% | |
| AUD | -0.15% | -0.12% | -0.10% | -0.11% | -0.12% | 0.04% | 0.17% | |
| NZD | -0.19% | -0.17% | -0.15% | -0.14% | -0.16% | -0.04% | 0.14% | |
| CHF | -0.32% | -0.29% | -0.28% | -0.28% | -0.29% | -0.17% | -0.14% |
The heat map shows percentage changes of major currencies against each other. The base currency is picked from the left column, while the quote currency is picked from the top row. For example, if you pick the Japanese Yen from the left column and move along the horizontal line to the US Dollar, the percentage change displayed in the box will represent JPY (base)/USD (quote).
Recommended Articles


