

Ethereum (ETHUSD) Is up 1.01% on Oct 27: Key Drivers to Watch

Source Tradingkey

Ethereum (ETHUSD) is up 1.01% at Oct 27 20:55(ET), now at $2327.27, with a 7-day down of 4.88%.
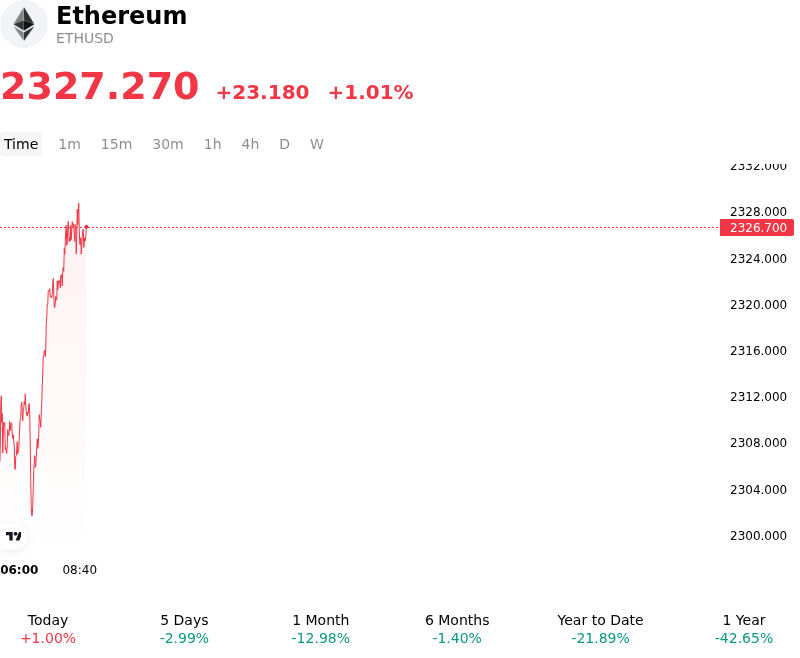
SummaryOverview

What is driving Ethereum (ETHUSD)’s stock price up today?

Capital flowed into Ethereum as market participants staged a technical recovery, lifting prices after recent downside pressure pushed the asset toward key structural support levels. Following extended sell-offs driven by institutional exchange-traded fund outflows and macroeconomic headwinds, oversold technical conditions prompted opportunistic spot buying and tactical short covering. Derivative market dynamics exacerbated intraday upward momentum, as leveraged short positions built up during prior sessions faced forced liquidations, providing an immediate liquidity push to the upside.

Macroeconomic positioning ahead of the Federal Reserve’s policy meeting significantly influenced price action and risk sentiment across digital asset markets. As investors repositioned portfolios in anticipation of the central bank's rate trajectory and global liquidity conditions, short-term treasury yield stabilization helped soothe broader market anxieties. The modest uptick in risk appetite encouraged macro desks and digital asset managers to reallocate capital into major digital assets, with Ethereum benefiting from sector-wide liquidity inflows and a shift toward short-term position adjustment.

Underlying network fundamentals and ongoing protocol progression provided additional background support for investor confidence. Market participants continue to monitor Ethereum’s technical roadmap, including execution layer throughput enhancements and testnet testing for upcoming protocol upgrades like Glamsterdam, alongside decentralized finance liquidity and staking participation. While spot ETF flows have shown heightened daily volatility, the price stabilization reflects a recalibration of market expectations as traders weigh monetary policy uncertainty against Ethereum’s long-term smart contract dominance and institutional infrastructure utility.

Technical Analysis of Ethereum (ETHUSD)

Technically, Ethereum (ETHUSD) shows a MACD (12,26,9) value of -22.134, indicating a sell signal. The RSI at 37.827 suggests neutral condition and the Williams %R at 81.622 suggests oversold condition. Please monitor closely.
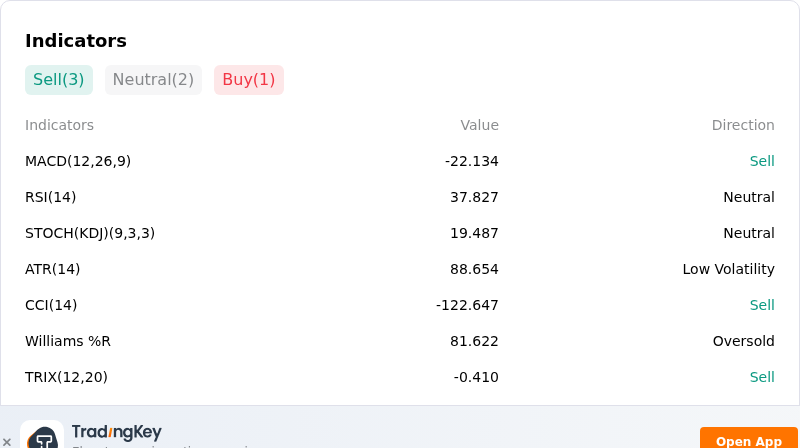
IndicatorAnalysis

More details about Ethereum (ETHUSD)

Recent Events and Risks:

  • Institutional Spot ETF Outflows: Persistent net redemptions from U.S. spot Ethereum ETFs have driven over $220 million in net capital flight across recent sessions, anchored by heavy withdrawals from funds such as BlackRock's ETHA and dampening institutional spot demand.
  • Concentrated Leverage and Liquidation Cascades: On-chain derivatives data highlights significant liquidation vulnerability, dominated by a $214 million leveraged long position holding over 93,000 ETH with liquidation thresholds less than 5% below current spot levels near $2,181–$2,256.
  • Technical Channel Breakdown and Taker Sell Pressure: ETH failed to reclaim its $2,440–$2,520 overhead resistance band and broke below its ascending technical channel support, driven by aggressive futures taker sell orders and forced long position closures.
  • Macro Risk-Off and Tech Equity Drag: Persistent macroeconomic headwinds—stemming from stubborn inflation readings, volatile energy prices, and earnings weakness in broader tech equities—have reinforced risk aversion, putting downward pressure on the ETH/BTC ratio.
Disclaimer: For information purposes only. Past performance is not indicative of future results.
placeholder
The Fed will sit still on October 28 — but 100 of 100 economists now expect a December hikeA Reuters poll run October 16-20 found 94 of 100 economists expecting the Fed to hold at 3.75-4.00% on October 28 — and all 100 expecting a hike in December, against less than half a month earlier. The market is close to the same price, with CME FedWatch at roughly 17% for October and 82.8% for December. With the Fed in blackout since October 17, here are the five dates that decide the rest of the year, what each one is priced for, and the two directions each can take.
Author  Irene Q.
Oct 22, Thu
A Reuters poll run October 16-20 found 94 of 100 economists expecting the Fed to hold at 3.75-4.00% on October 28 — and all 100 expecting a hike in December, against less than half a month earlier. The market is close to the same price, with CME FedWatch at roughly 17% for October and 82.8% for December. With the Fed in blackout since October 17, here are the five dates that decide the rest of the year, what each one is priced for, and the two directions each can take.
placeholder
Gold Price Analysis Today | Forex Gold Analysis | XAU/USD Analysis - October 26, 2026Get the latest gold price analysis, forex gold insights, and XAU/USD analysis for October 26, 2026. Read on for the details.
Author  Mitrade
Yesterday 01: 52
Get the latest gold price analysis, forex gold insights, and XAU/USD analysis for October 26, 2026. Read on for the details.
placeholder
Big Tech's $800 billion AI bill faces its first real test — free cash flow is the judgeAlphabet and Microsoft report after the close on October 28, Amazon on October 29, with hyperscaler AI capex running near $800 billion a year. Meta's negative free cash flow and 9.40% drop on October 22 was the warning; this week's prints decide whether cloud growth and backlog can pay for the buildout. Here are the consensus numbers, the free-cash-flow table and the two-sided test.
Author  Irene Q.
20 hours ago
Alphabet and Microsoft report after the close on October 28, Amazon on October 29, with hyperscaler AI capex running near $800 billion a year. Meta's negative free cash flow and 9.40% drop on October 22 was the warning; this week's prints decide whether cloud growth and backlog can pay for the buildout. Here are the consensus numbers, the free-cash-flow table and the two-sided test.
placeholder
Gold breaks $4,000 as oil becomes the inflation problem — $3,943 is the line that mattersSpot gold closed at $3,995.6 on October 23, down about 4.1% for the week and at its lowest since mid-July, and traded near $3,988 on October 26 even as Brent crude settled at $116.72 and Middle East supply risk stayed elevated. The war premium stopped working because oil is now the inflation trade: December Fed hike odds are 68.9% and the 10-year yield is 4.988%. Here are the three numbers, the transmission chain, and the July low at $3,943 that decides whether this is a bottom or a bigger correction.
Author  Irene Q.
19 hours ago
Spot gold closed at $3,995.6 on October 23, down about 4.1% for the week and at its lowest since mid-July, and traded near $3,988 on October 26 even as Brent crude settled at $116.72 and Middle East supply risk stayed elevated. The war premium stopped working because oil is now the inflation trade: December Fed hike odds are 68.9% and the 10-year yield is 4.988%. Here are the three numbers, the transmission chain, and the July low at $3,943 that decides whether this is a bottom or a bigger correction.
placeholder
Bitcoin Price Forecast: Drops Below $80,000 in Fifth Straight Loss, May Test $75,000 as FOMC Meeting Approaches Bitcoin falls below the $80,000 mark as the October FOMC decision approaches, threatening a further dip toward $75,000.On October 26, Bitcoin (BTC) again lost the key psychological mark o
Author  TradingKey
16 hours ago
Bitcoin falls below the $80,000 mark as the October FOMC decision approaches, threatening a further dip toward $75,000.On October 26, Bitcoin (BTC) again lost the key psychological mark o
goTop
quote