


Bitcoin (BTCUSD) Fluctuated Significantly on Oct 21: Key Variables Behind the Move
Bitcoin (BTCUSD) is up 1.11% at Oct 21 09:10(ET), now at $83739.48, with a 7-day up of 2.43%.
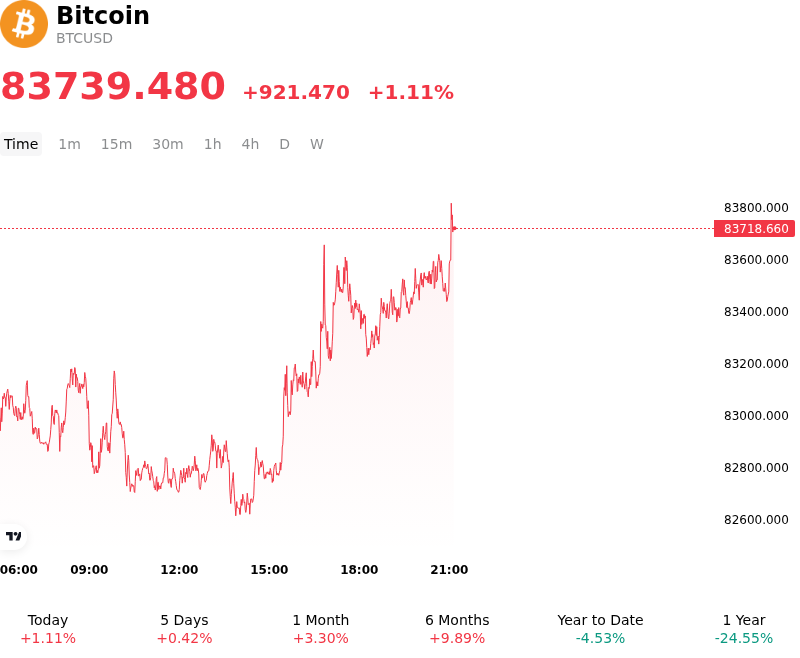
What is driving Bitcoin (BTCUSD)’s stock price up today?
Bitcoin's upward movement was primarily driven by a resurgence in institutional capital inflows into spot Bitcoin ETFs alongside a broader recovery in risk sentiment across global financial markets. Following a period of price consolidation near key technical support around the fifty-day exponential moving average, strong spot ETF net inflows provided meaningful spot market absorption and restored institutional confidence. This influx of institutional liquidity coincided with improving risk appetite across equity markets as corporate earnings season commenced, encouraging capital to re-enter liquid digital risk assets.
From a derivatives and market microstructure perspective, the move was accelerated by tight price compression and multi-month lows in realized and implied volatility across derivatives venues. With implied volatility coiling near multi-year lows and options positioning heavily concentrated, even moderate spot-driven buying triggered systematic short covering and delta hedging by market makers. Thin order-book depth near key technical resistance allowed aggressive buyers to clear overhead liquidity efficiently, expanding the intraday trading range.
The broader environment continues to reflect a structural transition toward deeper institutional integration, reinforced by major asset managers formalizing long-term return assumptions and ongoing corporate treasury interest. However, macro risks remain a primary consideration for market participants. Elevated energy prices and sticky inflation data continue to create uncertainty around future Federal Reserve monetary policy and benchmark Treasury yield trajectories. While today's advance signals a constructive shift in near-term risk sentiment, sustained upside momentum will largely depend on persistent ETF capital creation and broader macroeconomic liquidity expansion.
Technical Analysis of Bitcoin (BTCUSD)
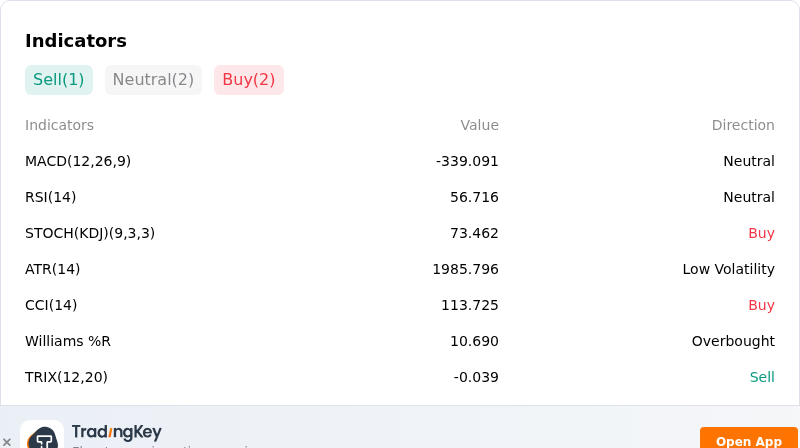
Technically, Bitcoin (BTCUSD) shows a MACD (12,26,9) value of -339.091, indicating a neutral signal. The RSI at 56.716 suggests neutral condition and the Williams %R at 10.690 suggests overbought condition. Please monitor closely.
More details about Bitcoin (BTCUSD)
Recent Events and Risks:
- Persistent Macro Inflation Pressure and High Rate Expectations: Hotter-than-expected U.S. consumer price inflation readings of 3.7% year-over-year have stoked fears of sustained Federal Reserve interest rate hikes. Higher U.S. Treasury yields continue to reduce investor appetite for non-yielding digital assets like Bitcoin, dampening spot market liquidity and capping price action below overhead resistance.
- Leverage Rebuild and Liquidation Cascade Threat: Derivatives data show perpetual futures funding payments surging 49.4% alongside a rebuild in open interest as bullish long positions attempt to establish exposure near overhead resistance. Analysts warn that unbacked leveraged buying leaves the market highly vulnerable to another sharp liquidation wave if spot price breaks below the $79,821 to $80,000 support threshold.
- Escalating Downside Hedging in Options Markets: Glassnode reports that Bitcoin’s 25-delta options skew climbed from 5.2% to 8.6%, reflecting a significant increase in the premium traders are willing to pay for downside put protection relative to upside calls. This growing skew demonstrates heightened risk aversion and defensive positioning among institutional participants facing persistent spot market selling.
- Extreme Volatility Compression and Equity Market Correlation: On-chain research highlights that 28-day realized volatility compressed to 1.2% alongside a re-tightening correlation with the Nasdaq index. Periods of extreme volatility compression historically lead to forceful breakouts, leaving Bitcoin vulnerable to significant downside risk if broader risk-off sentiment hits global equity markets ahead of upcoming monetary policy decisions.
Recommended Articles


