


Ripple and Stellar Outlook: XRP and XLM regain momentum as derivatives activity picks up
- XRP extends its recovery for the second straight day, holding above $1.35 as the 100-day EMA provides support.
- XLM reclaims $0.1800 as immediate support, reinforced by the RSI recovery toward bullish territory.
- Perpetual futures Open Interest rises to 2.23 billion XRP and 1.22 billion XLM, reflecting increased activity in the derivatives market.
Ripple (XRP) and Stellar (XLM) are regaining momentum on Wednesday, mirroring gains across major digital assets. XRP has climbed above $1.36, while XLM has reached $0.1854, reinforcing support levels recently tested. This gradual price increase comes amid sticky inflation in the United States (US) and ahead of the Federal Reserve’s (Fed) monetary decision next week.
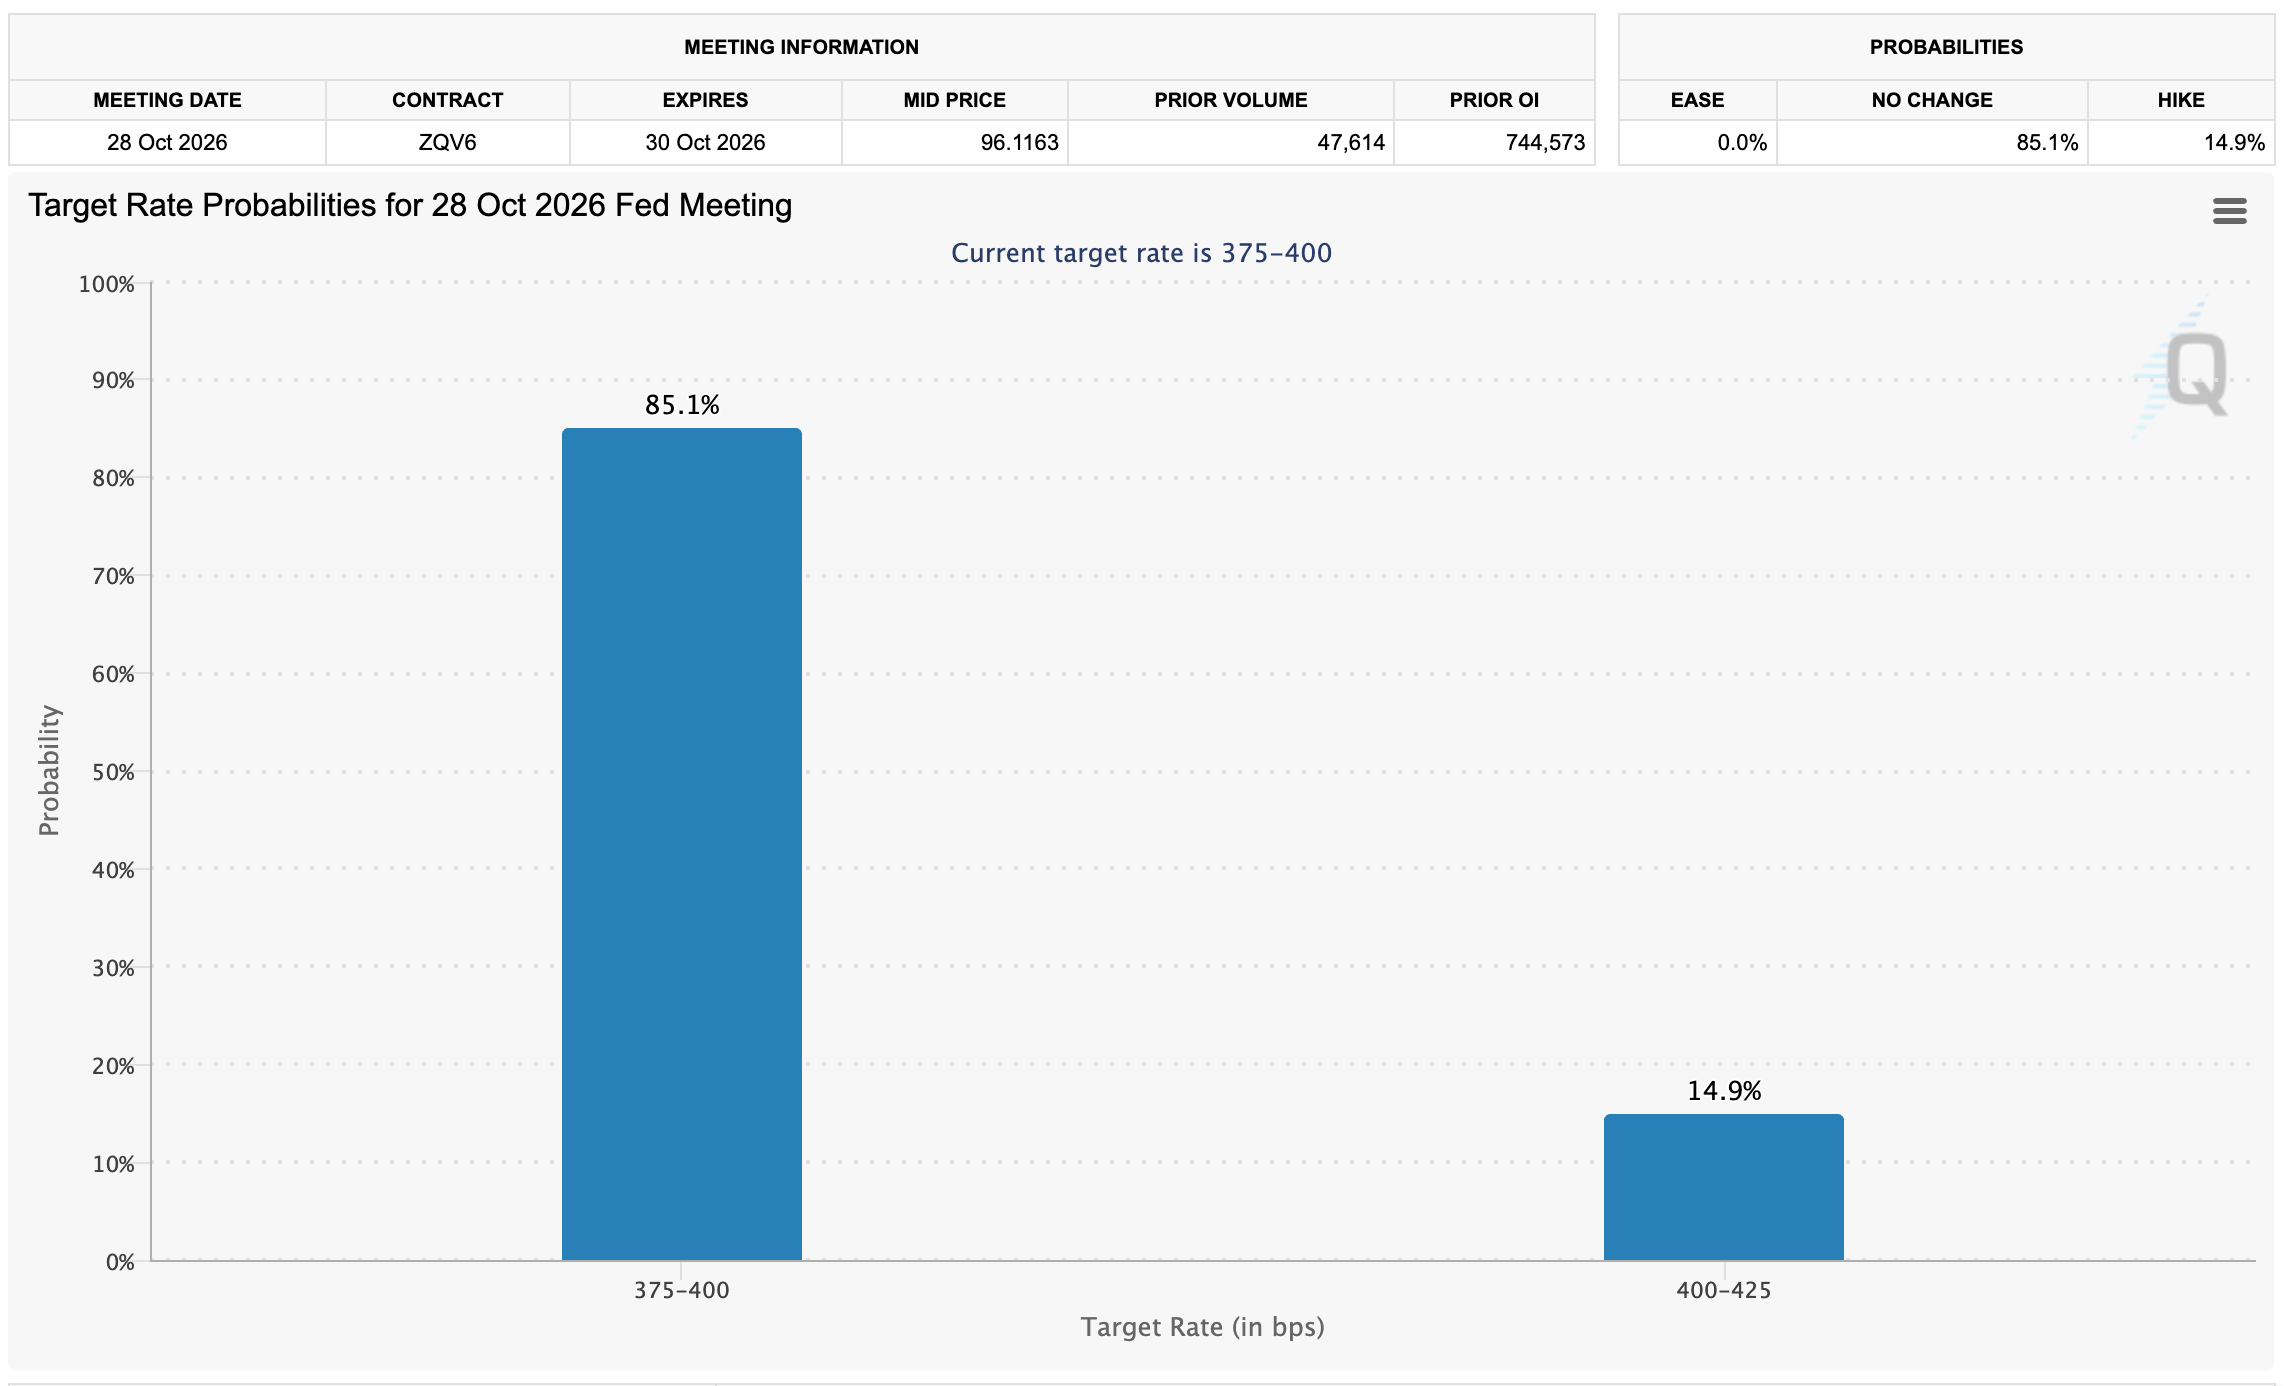
The CME Group’s FedWatch Tool assigns an 85% probability that the central bank will keep interest rates steady in the 3.75-4.00% range. Meanwhile, odds of a 25-basis-point hike stand at 15%. Despite signs of recovery in XRP and XLM, traders appear cautious, limiting risk exposure ahead of the Fed decision.
XRP and XLM retail activity picks up
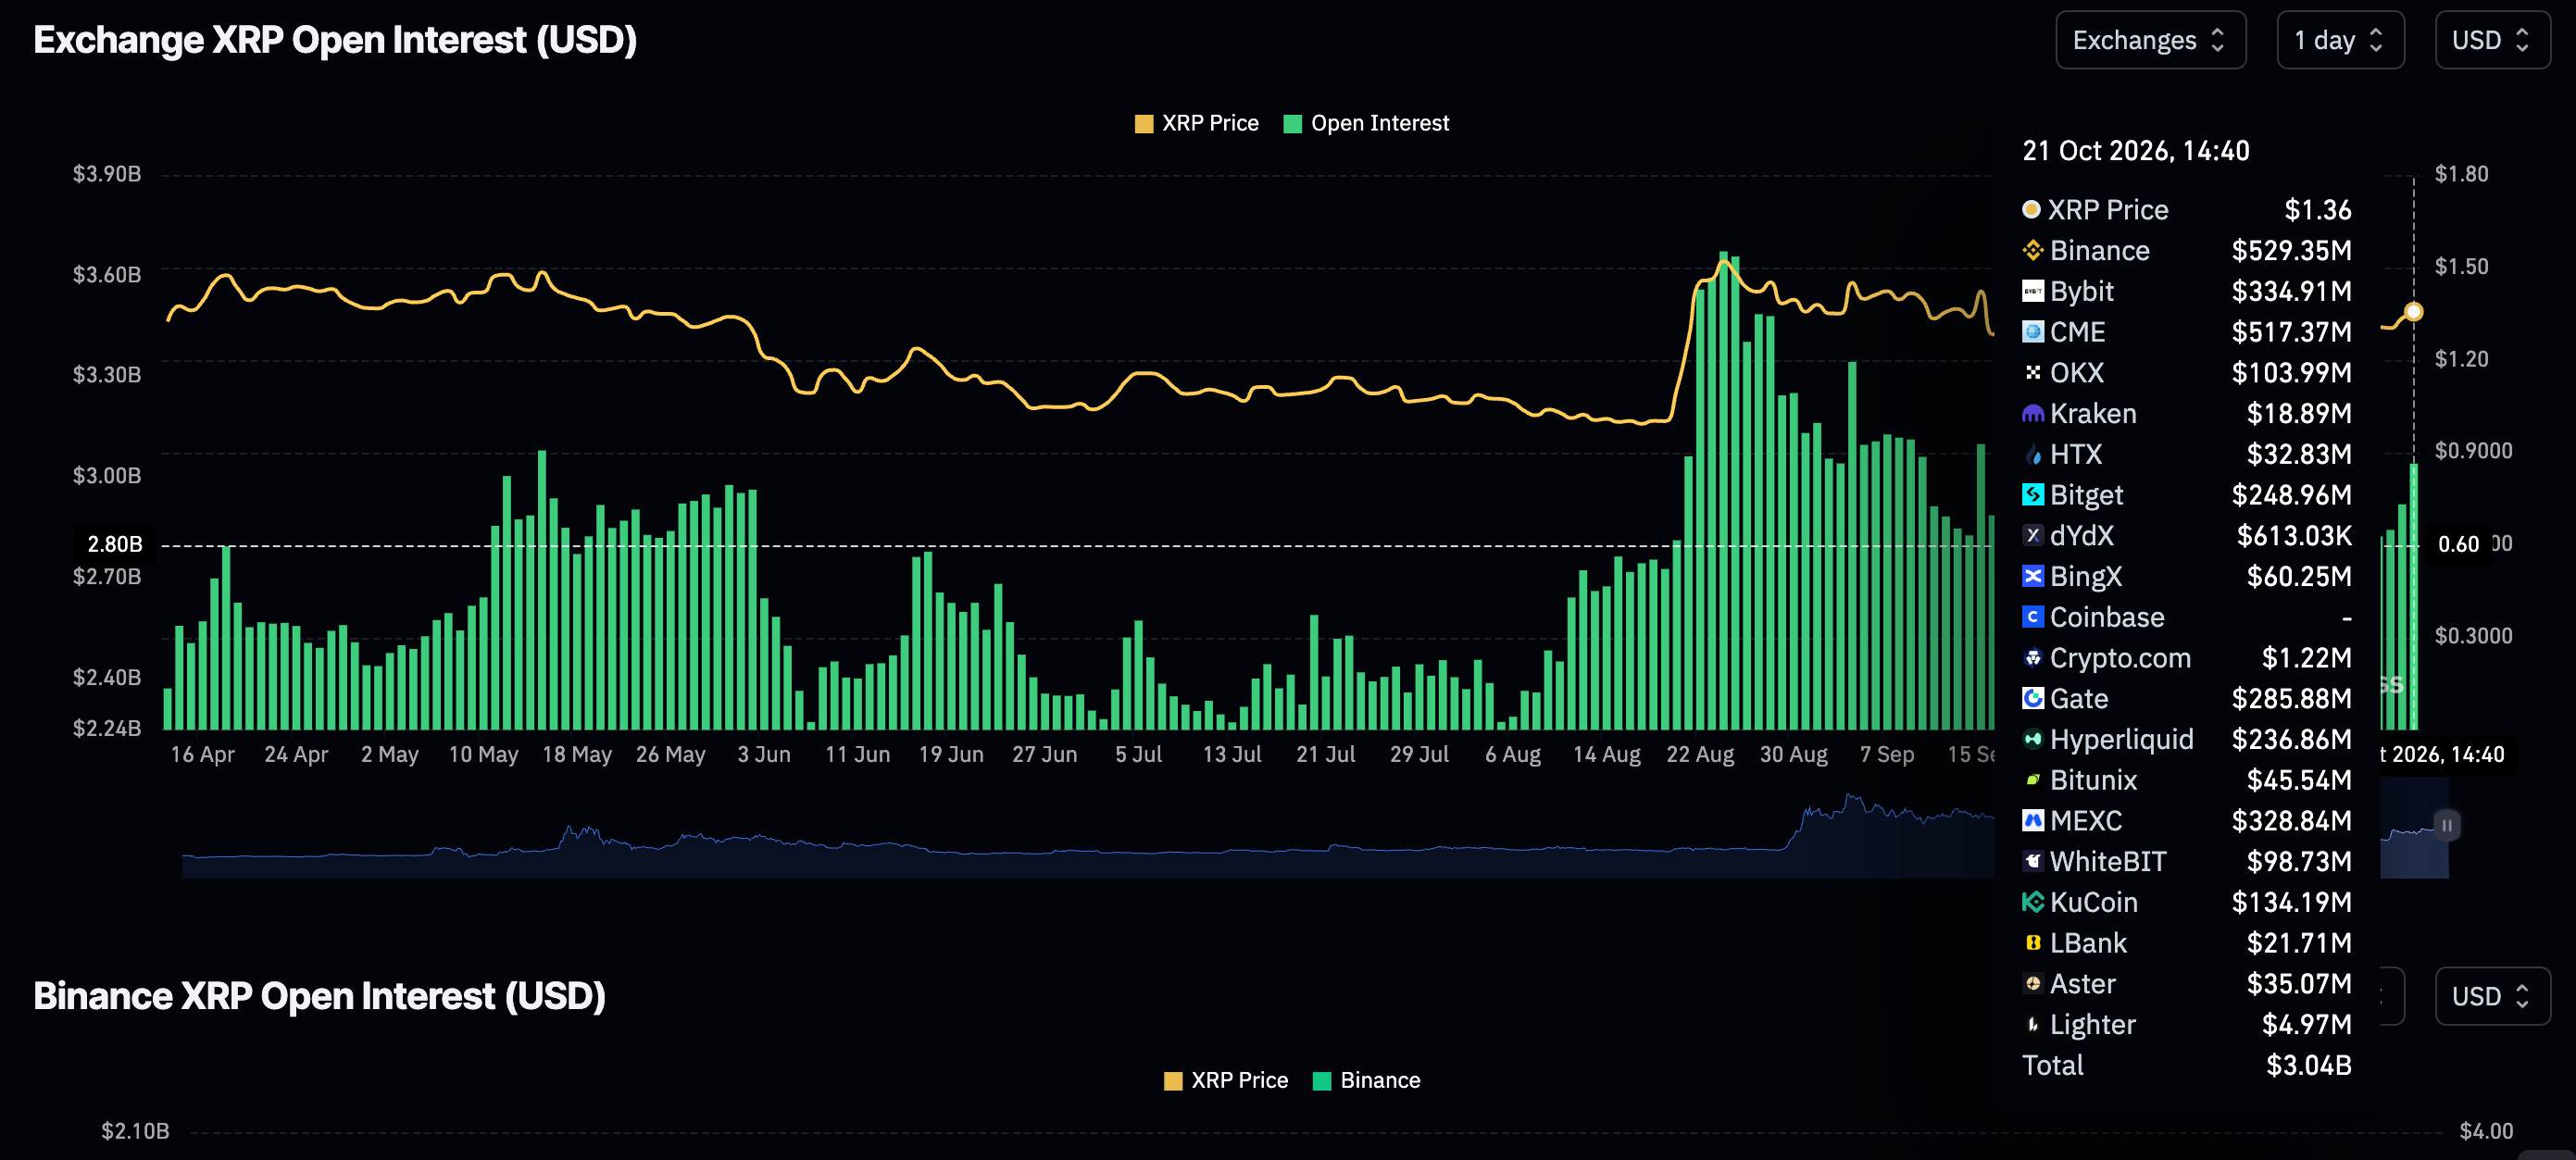
The derivatives market shows trading activity gaining momentum, with perpetual futures Open Interest (OI) at 2.23 billion XRP on Wednesday, up marginally from 2.18 billion XRP the previous day. CoinGlass data shows retail traders are trying to build an uptrend, with OI at 2.12 billion XRP on Sunday.
Still, this is not enough to confirm steady interest, as the current figure sits notably below the September peak of 2.46 billion XRP and the August high of 2.77 billion XRP.
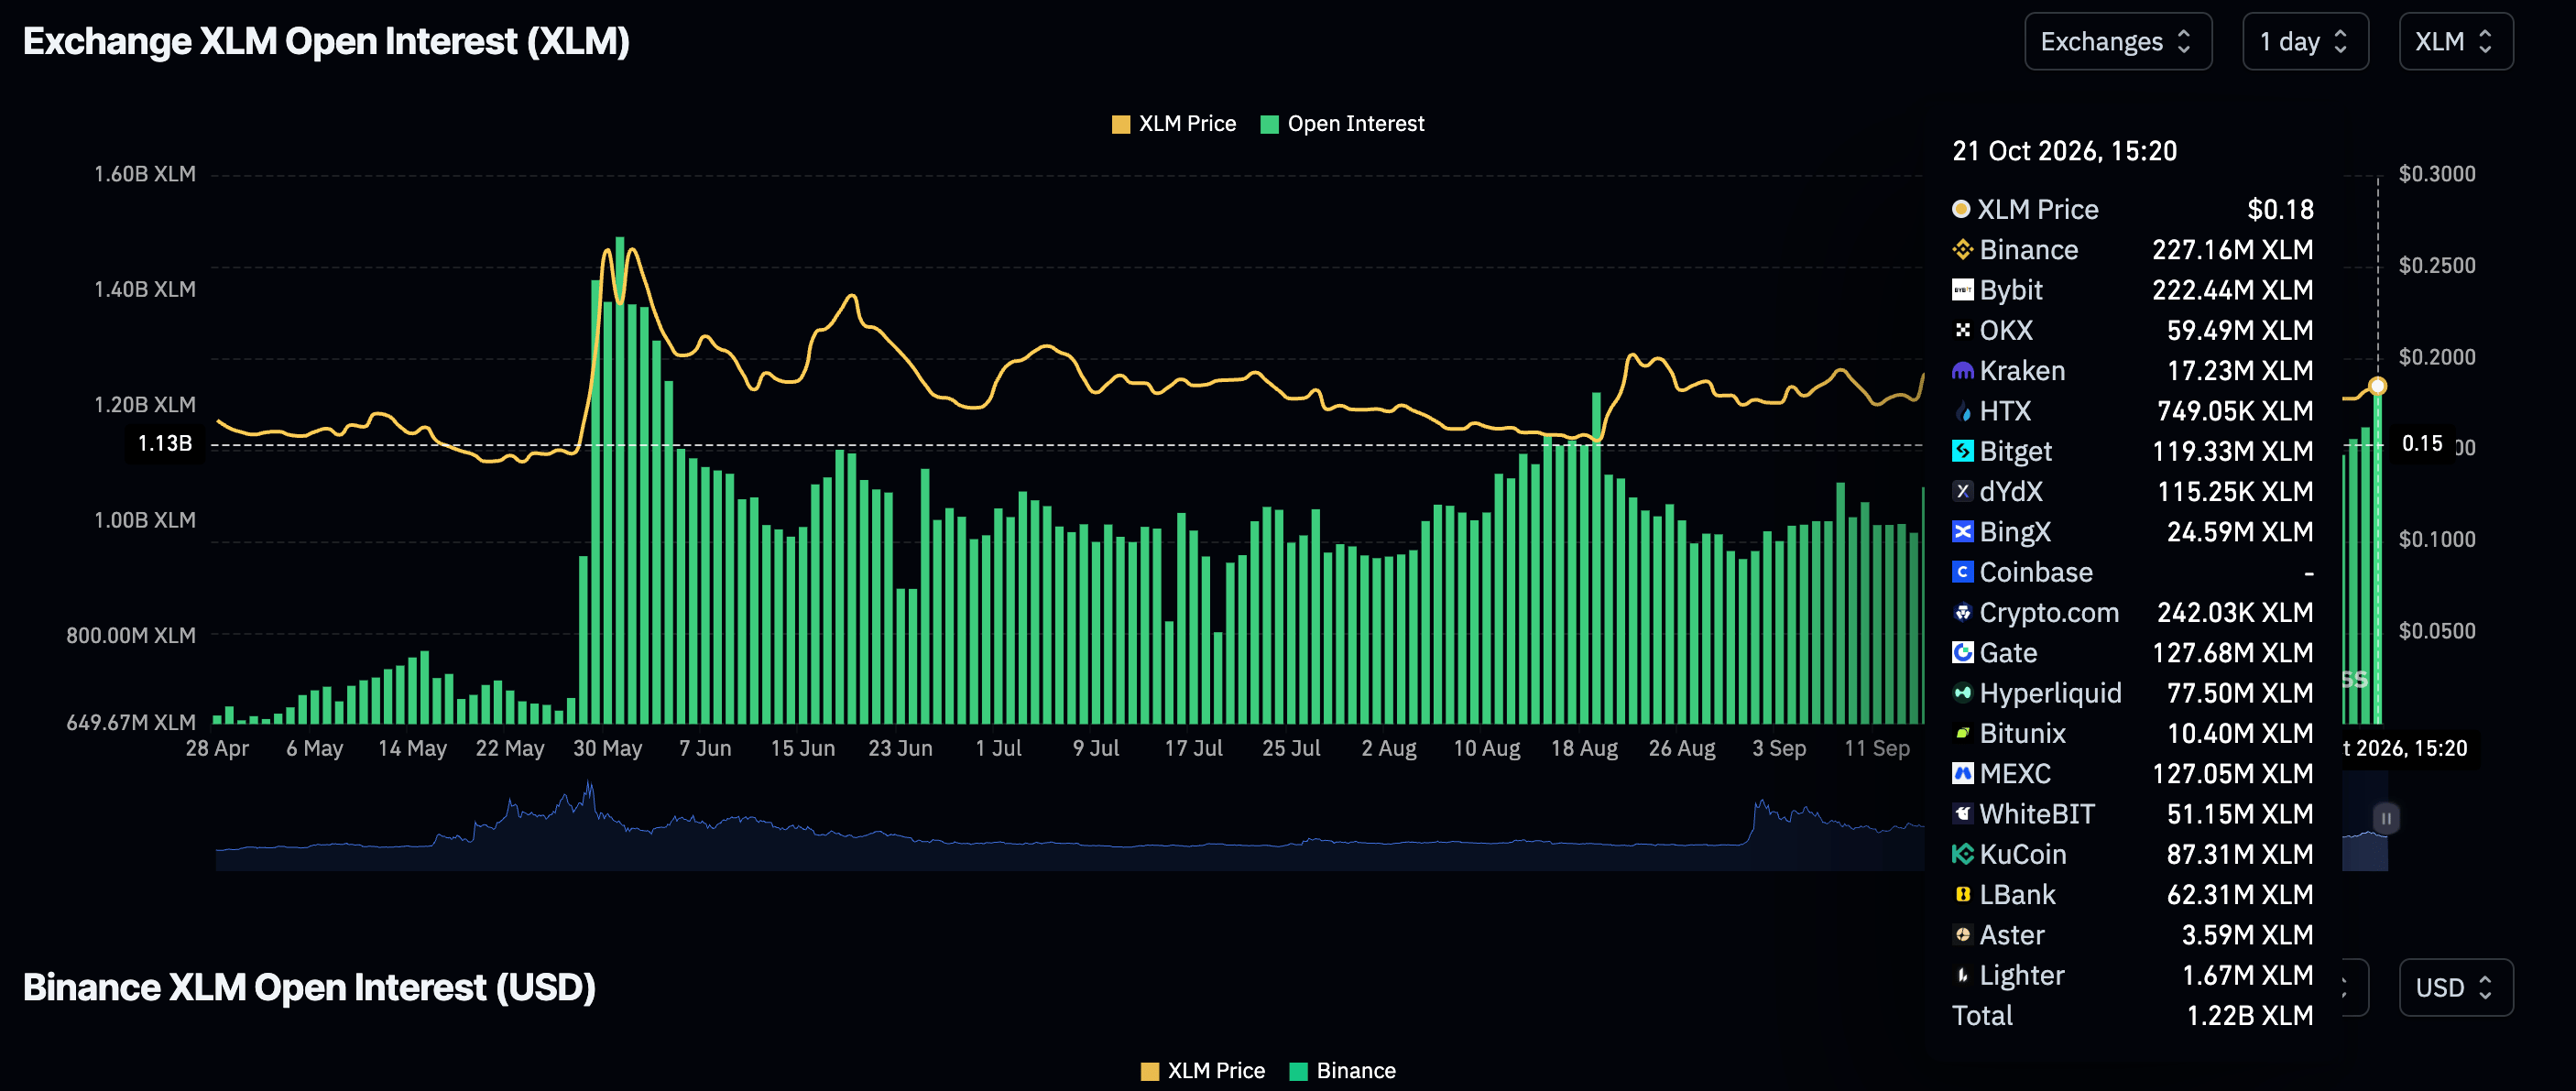
Stellar futures OI totals 1.22 billion XLM on Wednesday, up from 1.14 billion XLM the day before. Binance holds roughly 217 million XLM while Bybit sits on 222 million XLM, with aggregate OI recovering from 1.12 billion XLM on Monday. The rise in leveraged positions aligns with the ongoing price uptick, suggesting speculative interest in the token is improving.
Technical analysis: XRP rises as sell-side pressure eases
XRP trades at $1.36, holding below the 50-day and 200-day Exponential Moving Averages (EMAs) at $1.38 and $1.38, which keeps the near-term bias bearish despite the latest bounce off recent lows.
The pair remains capped by the SuperTrend line at $1.47 and the broader downward resistance trend line projected toward $1.61, while the Relative Strength Index (RSI) around 46 stays in neutral territory and the Moving Average Convergence Divergence (MACD) remains slightly negative, hinting at waning upside momentum rather than a clear bullish reversal.
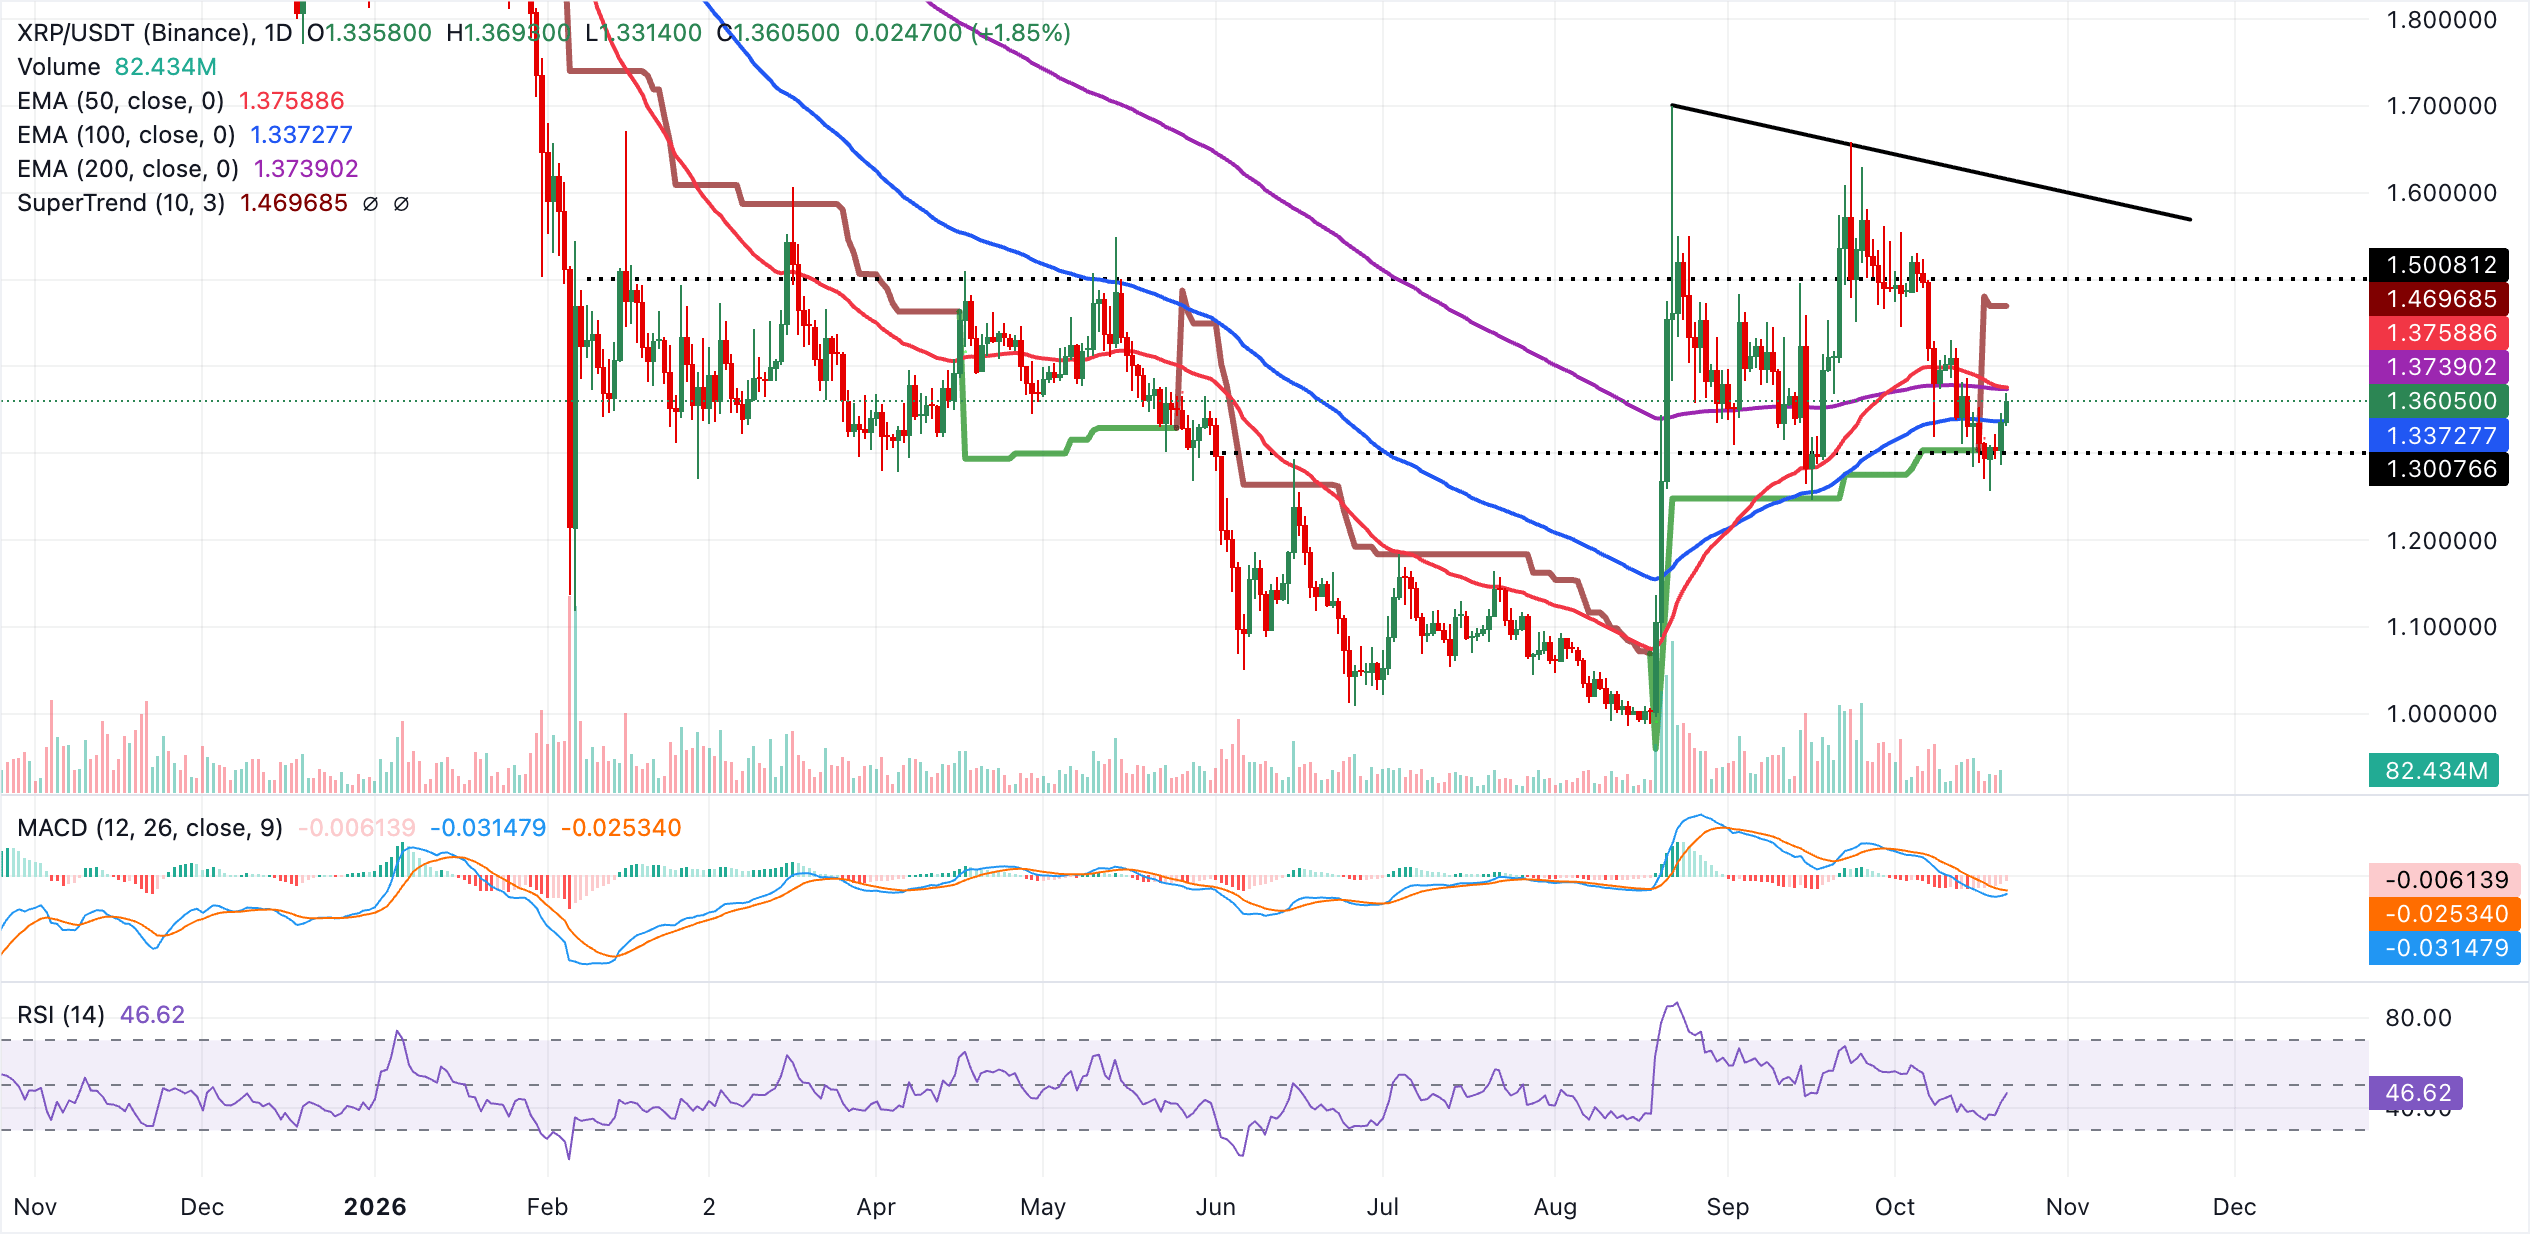
Immediate resistance lies at the 200-day EMA, which coincides with the 50-day EMA near $1.38. A daily close above this cluster would be needed to ease the current downside pressure, with further obstacles at the SuperTrend barrier near $1.47 and the descending trendline region toward $1.62. On the downside, initial support emerges at the 100-day EMA at $1.34, and a break beneath this floor would likely open the way for a deeper pullback toward previous price lows.
Stellar technical analysis: XLM Bulls eye recovery as momentum builds
XLM trades higher at $0.1854 as bulls gather momentum above recently confirmed support near $0.1700. Despite the two-day uptick, the token remains bearish as it sits below the 50-day, 100-day, and 200-day EMAs clustered between roughly $0.1900 and $0.1946, and under the SuperTrend resistance at $0.2060. The MACD is negative and recovering slowly, while the RSI holds near 44, suggesting subdued momentum rather than a strong reversal.
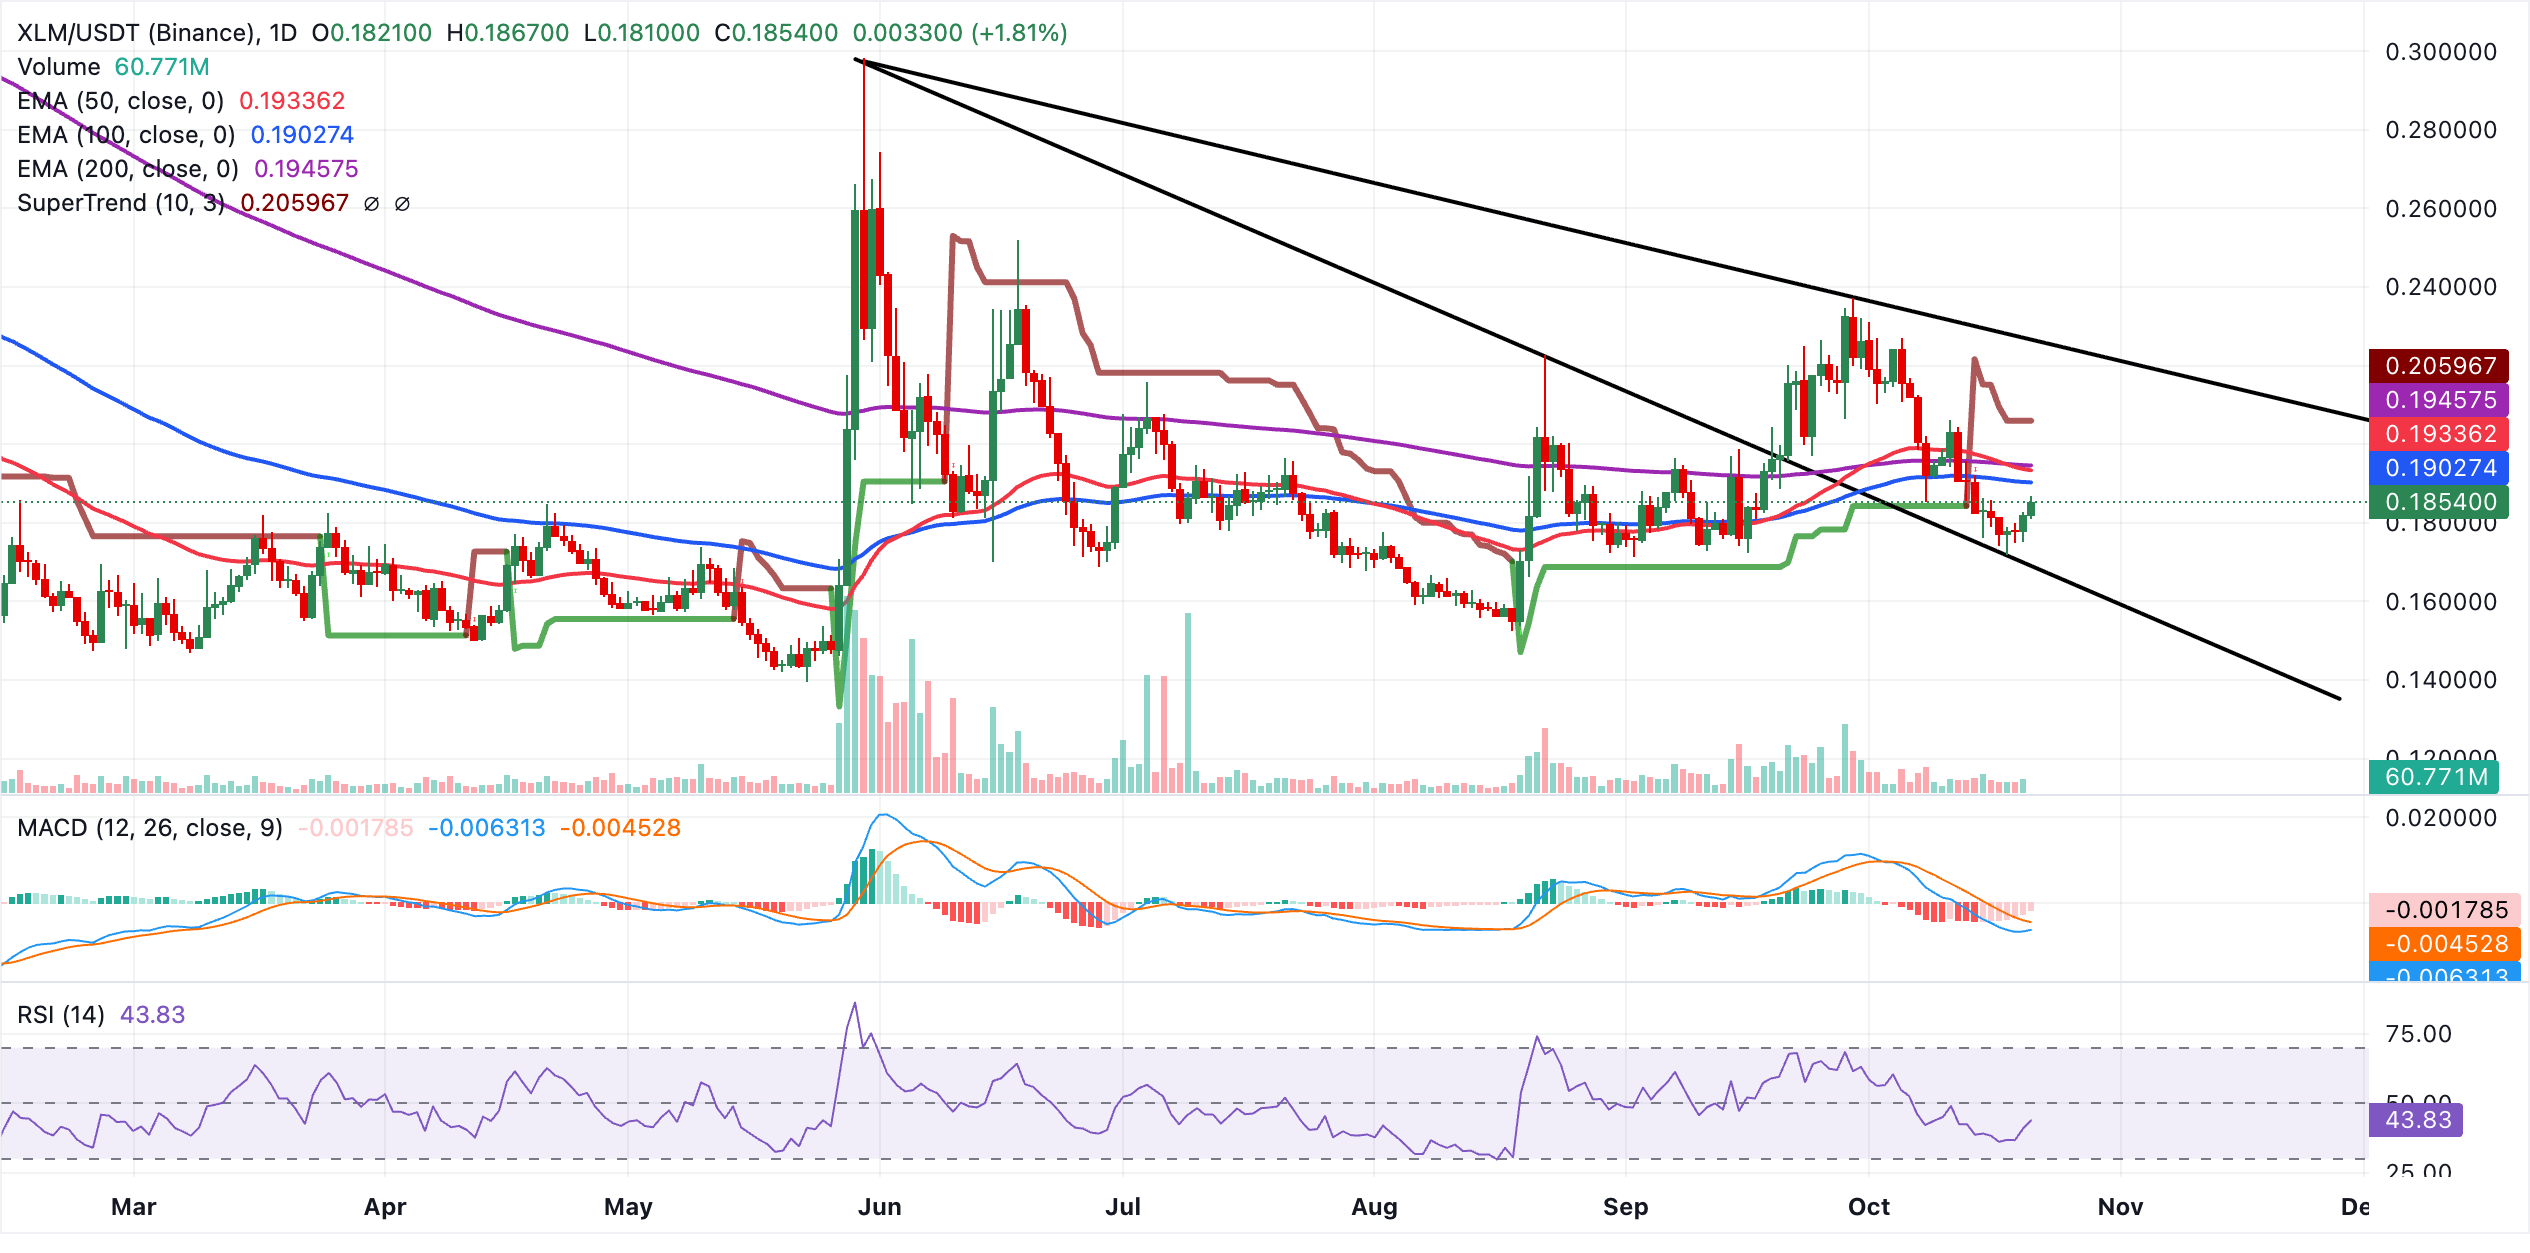
Initial resistance lies at the 100-day EMA at $0.1903, followed by the 50-day EMA at $0.1934 and the 200-day EMA at $0.1946, creating a dense overhead barrier before the SuperTrend level at $0.2060 and a higher descending trendline resistance around $0.2263. On the downside, the immediate focus is the current price pivot at $0.1854. A sustained break below would expose the former descending trendline break zone near $0.1685 as the next notable support.
(The technical analysis of this story was written with the help of an AI tool. Know more.)
Bitcoin, altcoins, stablecoins FAQs
Bitcoin is the largest cryptocurrency by market capitalization, a virtual currency designed to serve as money. This form of payment cannot be controlled by any one person, group, or entity, which eliminates the need for third-party participation during financial transactions.
Altcoins are any cryptocurrency apart from Bitcoin, but some also regard Ethereum as a non-altcoin because it is from these two cryptocurrencies that forking happens. If this is true, then Litecoin is the first altcoin, forked from the Bitcoin protocol and, therefore, an “improved” version of it.
Stablecoins are cryptocurrencies designed to have a stable price, with their value backed by a reserve of the asset it represents. To achieve this, the value of any one stablecoin is pegged to a commodity or financial instrument, such as the US Dollar (USD), with its supply regulated by an algorithm or demand. The main goal of stablecoins is to provide an on/off-ramp for investors willing to trade and invest in cryptocurrencies. Stablecoins also allow investors to store value since cryptocurrencies, in general, are subject to volatility.
Bitcoin dominance is the ratio of Bitcoin's market capitalization to the total market capitalization of all cryptocurrencies combined. It provides a clear picture of Bitcoin’s interest among investors. A high BTC dominance typically happens before and during a bull run, in which investors resort to investing in relatively stable and high market capitalization cryptocurrency like Bitcoin. A drop in BTC dominance usually means that investors are moving their capital and/or profits to altcoins in a quest for higher returns, which usually triggers an explosion of altcoin rallies.
Recommended Articles


