

USD/MXN (USDMXN) Volatility Intensified on Sep 28: Factors to Watch

Source Tradingkey

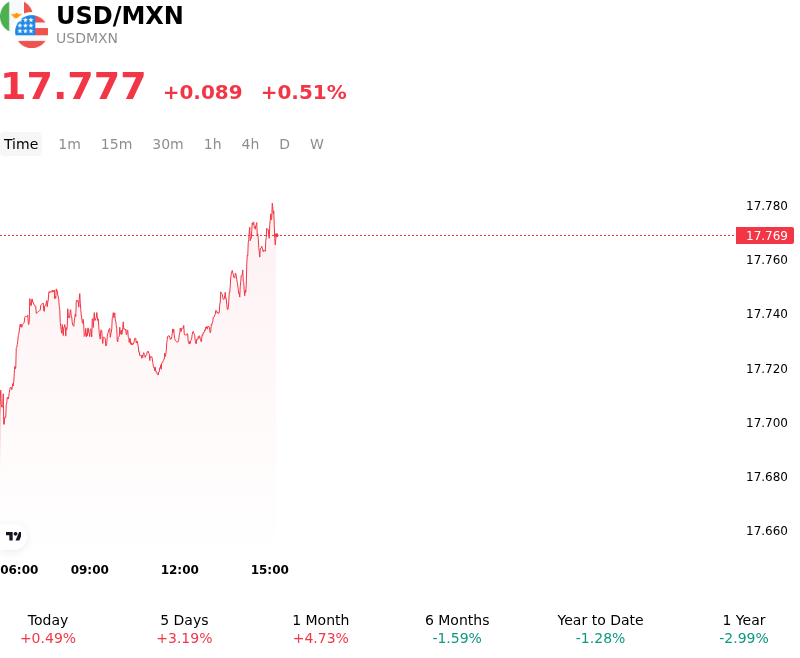
USD/MXN (USDMXN) is up 0.51% at Sep 28 03:15(ET), now at $17.77725, with a 7-day up of 3.27%.
SummaryOverview

What is driving USD/MXN (USDMXN)’s stock price up today?

The advance in USDMXN is primarily driven by the ongoing recalibration of relative monetary policy expectations and interest-rate differentials between the United States and Mexico. Following the Federal Reserve's recent policy tightening and its signal that U.S. borrowing costs could remain elevated, Banco de México chose to keep its benchmark interest rate unchanged at 6.50%. Crucially, Banxico explicitly noted that domestic monetary policy will not react mechanically to Federal Reserve rate decisions, highlighting distinct domestic macroeconomic conditions and persistent slack within the Mexican economy.

This deliberate policy decoupling has accelerated the narrowing of the U.S.-Mexico interest-rate differential, diminishing the attractiveness of the Mexican peso's carry trade. As U.S. Treasury yields press higher on expectations of persistent Fed policy tightness, the diminished yield spread reduces the risk-adjusted premium required by foreign investors to hold MXN-denominated debt. Institutional investors have consequently trimmed long-peso carry positions, channeling liquidity back into the U.S. dollar.

Underlying macroeconomic data in Mexico has reinforced Banxico's inclination to stand ground despite the narrowing spread. Although headline consumer inflation experienced a slight non-core acceleration, core inflation has continued its steady deceleration toward target, providing the central bank sufficient flexibility to avoid defensive rate hikes. Coupled with a broader shift toward risk aversion in emerging market FX and firm U.S. economic momentum, the rally in USDMXN appears supported by a broader macro trend of narrowing rate buffers rather than a short-lived technical impulse.

Technical Analysis of USD/MXN (USDMXN)

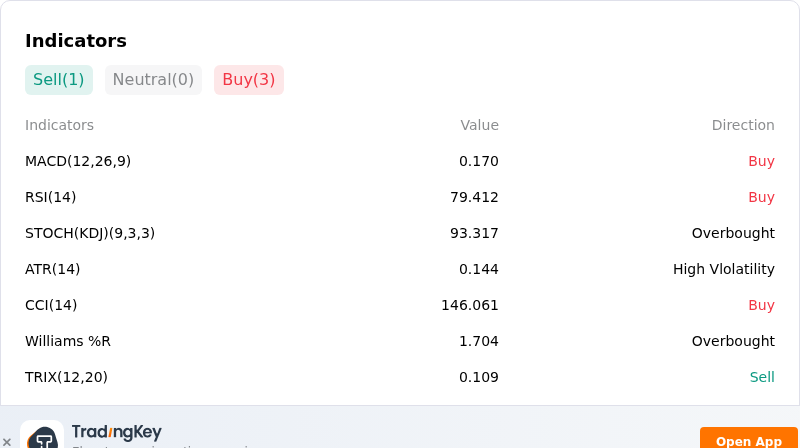
Technically, USD/MXN (USDMXN) shows a MACD (12,26,9) value of 0.170, indicating a buy signal. The RSI at 79.412 suggests buy condition and the Williams %R at 1.704 suggests overbought condition. Please monitor closely.
IndicatorAnalysis

More details about USD/MXN (USDMXN)

Recent Events and Risks:

  • Narrowing U.S.-Mexico Interest Rate Differential: The compression of the U.S.-Mexico benchmark rate spread to 250 basis points—its narrowest margin since 2015—following Federal Reserve rate tightening and Banxico maintaining its 6.50% policy rate has significantly eroded the peso's carry cushion, exposing USD/MXN to sustained upside volatility.
  • Banxico Policy Independence and Domestic Macro Softness: Banco de México's explicit guidance that it will not mechanically follow Fed rate hikes, combined with weaker Mexican retail sales and softer core inflation data, limits Banxico's ability to defend the peso, leaving MXN vulnerable to hawkish U.S. monetary repricing.
  • Vulnerability to Carry Trade Unwinding: Heavy speculative net-long positioning in the Mexican peso creates market structure risk, where any sudden deterioration in global risk sentiment or sharp spike in U.S. Treasury yields could trigger stop-loss liquidations and a fast unwind of long-MXN carry trades.
  • U.S. Data Outperformance and Treasury Yield Pressure: Better-than-expected U.S. PMI activity data and elevated U.S. 10-year yields above 5.00% have boosted the broad U.S. Dollar Index above 101.00, pushing USD/MXN through key technical resistance levels toward 17.70.
Disclaimer: For information purposes only. Past performance is not indicative of future results.
placeholder
Silver Price Forecast: XAG/USD falls like house of cards on Fed’s hawkish narrativeSilver price (XAG/USD) is down 4.3% to near $61.50 during the European trading session on Monday. The white metal nosedives as elevated United States (US) Treasury Yields have diminished its appeal.
Author  FXStreet
10 hours ago
Silver price (XAG/USD) is down 4.3% to near $61.50 during the European trading session on Monday. The white metal nosedives as elevated United States (US) Treasury Yields have diminished its appeal.
placeholder
Gold Falls Below $4,200 in Single-Day Drop of Over $100: Why Are Gold Prices Plunging? As of the Asian session on September 28, international gold prices continued their recent weakness, with spot gold (XAUUSD) falling below $4,200 intraday to a low of $4,179.42, down over
Author  TradingKey
10 hours ago
As of the Asian session on September 28, international gold prices continued their recent weakness, with spot gold (XAUUSD) falling below $4,200 intraday to a low of $4,179.42, down over
placeholder
Four jobs reports in five days: what JOLTS, ADP, claims and the September payrolls mean for the October Fed decisionThe US labour market faces its densest data week of the month. JOLTS job openings land Tuesday (7.2 million expected), ADP on Wednesday (70,000 expected), initial claims on Thursday and the September non-farm payrolls on Friday (100,000 expected, down from 162,000). Markets price a 64%-70% chance of another quarter-point Fed hike on October 28. The dollar index sits at 100.77 and the S&P 500 at 7,729.8.
Author  Mitrade
13 hours ago
The US labour market faces its densest data week of the month. JOLTS job openings land Tuesday (7.2 million expected), ADP on Wednesday (70,000 expected), initial claims on Thursday and the September non-farm payrolls on Friday (100,000 expected, down from 162,000). Markets price a 64%-70% chance of another quarter-point Fed hike on October 28. The dollar index sits at 100.77 and the S&P 500 at 7,729.8.
placeholder
Brent edges toward $99 as Trump rejects Iran's Hormuz proposal — why the war-risk premium won't rebuildBrent crude rose 0.92% to $98.51 and WTI gained 1.15% to $93.51 after President Trump rejected Iran's seven-day proposal to reopen the Strait of Hormuz. But both benchmarks remain about 12% below their early-September highs, because supply never actually stopped. Hormuz flows ran at 33.7 million barrels this week, in line with the prior week, and Saudi Arabia's East-West pipeline restarted on September 22.
Author  Suzie
13 hours ago
Brent crude rose 0.92% to $98.51 and WTI gained 1.15% to $93.51 after President Trump rejected Iran's seven-day proposal to reopen the Strait of Hormuz. But both benchmarks remain about 12% below their early-September highs, because supply never actually stopped. Hormuz flows ran at 33.7 million barrels this week, in line with the prior week, and Saudi Arabia's East-West pipeline restarted on September 22.
placeholder
Middle East War updates: Trump says he expects renewed Iran talks this weekHere’s a brief recap of the key developments in the Middle East war that occurred over the weekend, which are expected to have a significant impact on markets in the upcoming week.
Author  FXStreet
18 hours ago
Here’s a brief recap of the key developments in the Middle East war that occurred over the weekend, which are expected to have a significant impact on markets in the upcoming week.
goTop
quote