


Pershing Square Ord Shs Stock (PS) Moved Up by 7.55% on Sep 25: Drivers Behind the Movement
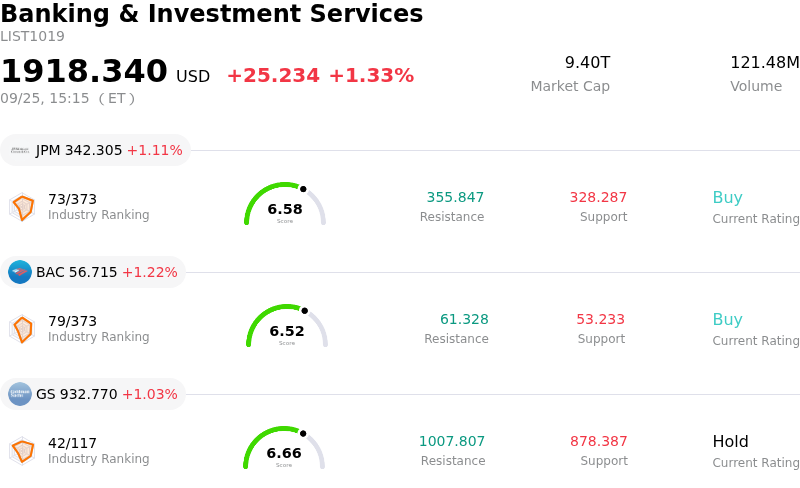
Pershing Square Ord Shs (PS) moved up by 7.55%. The Banking & Investment Services sector is up by 1.33%. The company outperformed the industry. Top 3 stocks by turnover in the sector: JPMorgan Chase & Co (JPM) up 1.11%; Bank of America Corp (BAC) up 1.22%; Goldman Sachs Group Inc (GS) up 1.03%.
What is driving Pershing Square Ord Shs (PS)’s stock price up today?
Pershing Square Inc. experienced strong upward momentum during the trading session, touching new 52-week highs amidst heightened trading volume and pronounced intraday volatility. The sharp gain was propelled by continued investor enthusiasm surrounding the closed-end investment vehicle managed by Bill Ackman, coupled with sustained buying pressure following a wave of positive analyst actions. Market participants have demonstrated strong appetite for high-conviction asset management vehicles, providing robust tailwinds for the stock.
A key catalyst behind the recent rally has been a series of price target increases from several Wall Street research firms, which cited the company's solid quarterly performance and resilient core strategy. The fund's concentrated portfolio strategy, which focuses on high-conviction investments in prominent North American businesses, continues to attract capital from both institutional and retail channels. The influx of trading volume significantly outpaced average levels, contributing to expanded intraday swings as buyers aggressively absorbed available supply.
The upward move also reflects persistent investor optimism surrounding the firm's broader capital market initiatives and long-term asset accumulation. Although valuation debates persist among equity analysts regarding the premium at which the shares trade relative to peer asset managers, strong demand for prominent fund management brands has fueled a powerful technical breakout. Overall market sentiment toward specialized investment management firms remains highly active, reinforcing short-term bullish momentum.
Technical Analysis of Pershing Square Ord Shs (PS)
Technically, Pershing Square Ord Shs (PS) shows a MACD (12,26,9) value of 2.922, indicating a buy signal. The RSI at 72.831 suggests buy condition and the Williams %R at 2.590 suggests overbought condition. Please monitor closely.
Fundamental Analysis of Pershing Square Ord Shs (PS)
Pershing Square Ord Shs (PS) is in the Banking & Investment Services industry. Its latest annual revenue is $348.77M, ranking 86 in the industry. The net profit is $249.78M, ranking 54 in the industry. Company Profile
Over the past month, multiple analysts have rated the company as Hold, with an average price target of $42.78, a high of $53.00, and a low of $36.00.
More details about Pershing Square Ord Shs (PS)
Company Specific Risks:
- Severe Valuation Premium and Analyst Disconnect: Pershing Square trades near $52–$55 per share, representing a steep premium over Wall Street's consensus price target of approximately $41.33 and an average "Hold" consensus rating. Institutional research notes that the stock trades at an inflated multiple of roughly 25x revenue compared to asset management peers averaging ~2.2x, leaving the valuation highly exposed to downward repricing.
- Underlying GAAP Losses and Dividend Coverage Risks: Despite reporting positive distributable fee income, the firm's GAAP financials reveal an operating loss of $90.1 million and net income losses driven by consolidated portfolio revaluations and administrative costs post-IPO. This net earnings drag leaves the current dividend payout ratio significantly elevated relative to GAAP profit levels.
- Concentrated Portfolio Exposure to Rate Headwinds: Surging 10-year Treasury yields pushing toward 5.1% present direct macro risks to Pershing Square's concentrated equity holdings. Reductions in underlying portfolio net asset value (NAV) directly threaten fee-paying assets under management (AUM) and exacerbate earnings volatility.
- Extreme Intraday Volatility and Technical Retracements: Driven by a high 1-year beta of 2.81, the stock has experienced wide intraday swings and high relative trading volume, triggering multi-percentage point sell-offs as traders rapidly take profits following momentum spikes above published analyst targets.
Recommended Articles


