


Bitcoin Weekly Forecast: Is the month-long rally over?


Bitcoin trades slightly lower this week after being rejected by the key 100-week EMA overhead supply around $82,500.
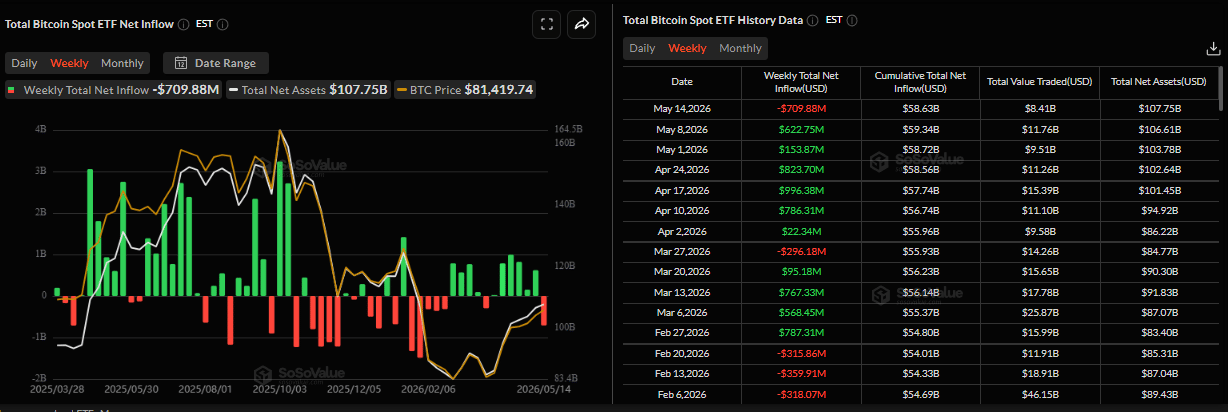
US-listed spot ETFs have recorded an outflow of $709.88 million through Thursday, marking the first weekly withdrawals since the end of March.
Profit-taking among traders fuels the BTC correction.
Bitcoin (BTC) edges slightly lower so far this week, trading at $80,800 on Friday after being rejected around the key overhead supply zone. Institutional investors also show cautious signs, with BTC spot Exchange Traded Funds (ETFs) recording an outflow of over $709 million through Thursday. In addition, traders’ profit-taking fuels the Crypto King price pullback.
Institutional demand shows cautious signs
Institutional demand shows early signs of caution so far this week. SoSoValue data showed that spot BTC ETFs recorded an outflow of $709.88 million through Thursday. If Friday’s flows are negative, BTC would mark the first weekly outflow since the end of March, signaling a cautious stance among institutions.
Profit-taking activity accelerates the selling pressure
CryptoQuant’s weekly report on Wednesday said traders may have started taking profits in a significant way.
The chart below shows that Bitcoin holders realized 14,600 BTC in daily profits on May 4, the highest level since December 10, as the 37% rally from the April lows pushed holders back into profitable territory. Moreover, a similar spike was seen this week, indicating the profit-taking activity continued. Historically, this anticipates lower prices as traders start to sell.
-1778832546421.png)
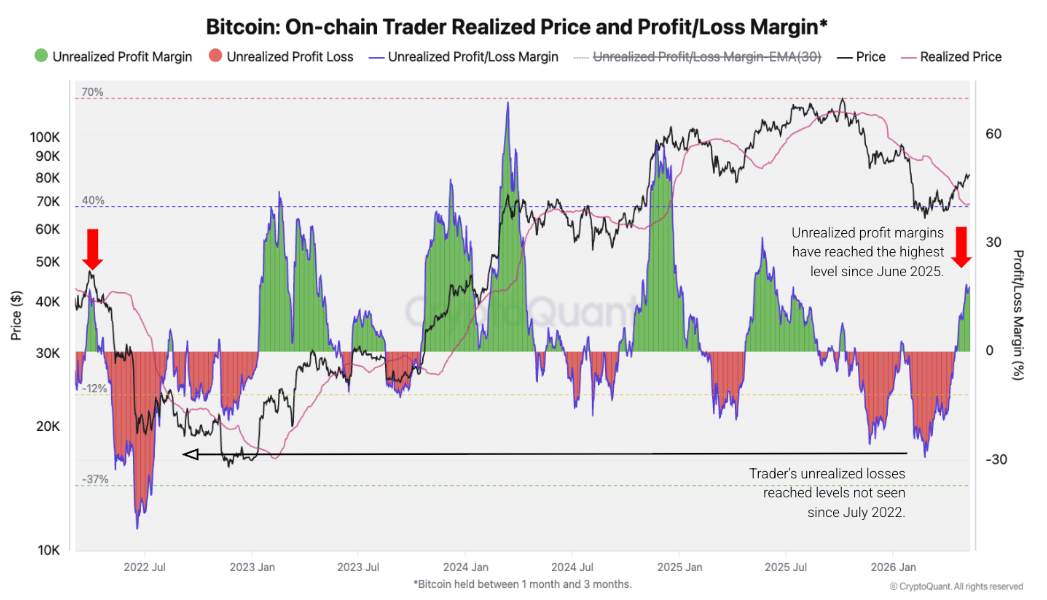
In addition, Traders’ unrealized profits are high after the recent rally, suggesting potential selling pressure to take profits. Unrealized profit margins reached 17.7% on May 5, the highest since June 2025.
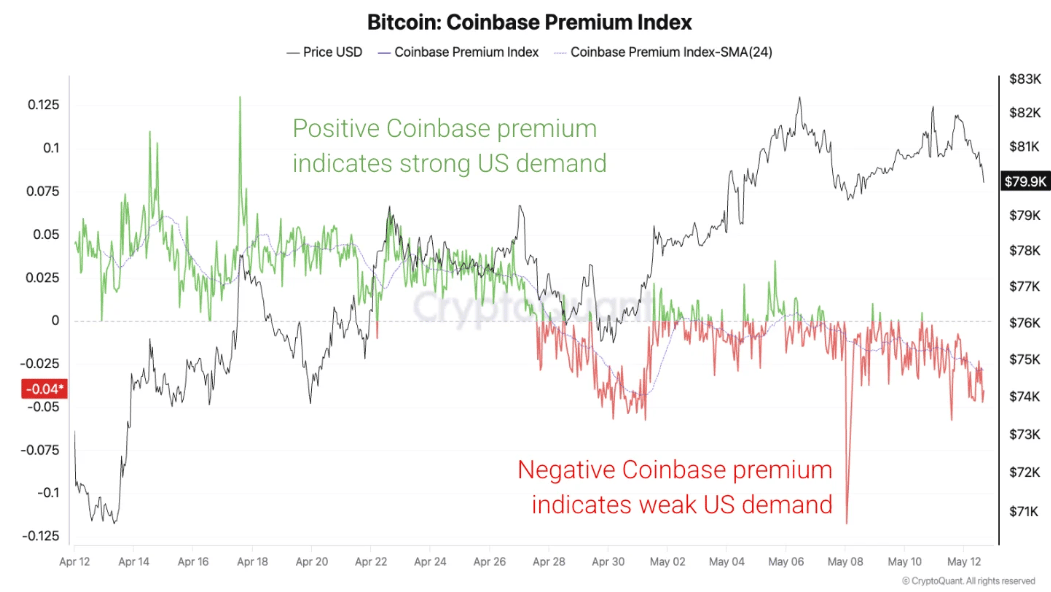
Apart from increased profit-taking, US investor demand eased as Bitcoin’s price approached $80,000. The Coinbase Bitcoin Price Premium chart below has turned negative since late April, indicating that Bitcoin demand in the US has slowed (which also coincides with the ETF outflows discussed above).
Hotter inflation and hawkish Fed caps BTC
The Crypto King’s price pullback so far this week has been supported by the hotter-than-expected US April inflation figures released this week, and Thursday’s US Retail Sales data, which lifted market expectations for a more hawkish US Federal Reserve (Fed) and continues to act as a tailwind for the US Dollar (USD), while weighing on risky assets such as BTC.
The headline US Consumer Price Index (CPI) rose to 3.8% YoY rate in April, and the core gauge climbed to 2.8%. Additionally, the US Producer Price Index (PPI) surged 1.4% last month, pushing the annual rate to 6.0%. Moreover, US Retail Sales expanded for the third consecutive month in April, reflecting still resilient consumer spending amid rising inflationary pressures and reaffirming hawkish bets by the US central bank.
According to the CME Group’s FedWatch Tool, traders are now pricing in a nearly 40% chance that the Fed will raise borrowing costs by the year-end. This, in turn, favors the USD bulls and caps risk appetite among traders, restricting BTC upside momentum.
Geopolitical risks limit BTC’s upside momentum
US-Iran peace talks continue to remain fragile and uncertain on the back of major disagreements over Tehran’s nuclear program and the Strait of Hormuz.
US President Donald Trump said in an interview aired on Thursday night on Fox News that he would not be much more patient with Iran and urged Tehran to reach a deal. Meanwhile, a commercial vessel was reportedly seized by Iranian personnel off the United Arab Emirates (UAE), stoking concerns over the flow of energy supplies through the critical Strait of Hormuz.
This growing wave of uncertainty dampened risk sentiment, causing risky assets such as Bitcoin to correct so far this week. Further escalation or intervention by the US or Iran during the weekend could further dampen risk appetite, leading to a further correction in BTC.
Some signs of optimism
On the regulatory front, the US Senate Banking Committee advanced the CLARITY Act on Thursday in a 15-9 bipartisan vote. This bill provides regulatory certainty for the crypto industry, which it previously lacked, by replacing the prior US Securities and Exchange Commission (SEC) regulation-by-enforcement approach and its resulting legal uncertainty with a clear regulatory framework that protects investors and supports crypto innovation.
The bill has a long way to go before becoming law and needs a full Senate debate before heading to US President Donald Trump’s desk.
Traders should closely watch for any ethics-related amendments and the overall tone of discussions. A smooth committee passage could reinforce the narrative of improving US regulatory clarity, a long-standing positive catalyst for Bitcoin and the broader digital asset sector.
STRC dividend outcome
Friday’s Stretch (STRC) dividend could be a key market driver for Bitcoin, offering investors a near-term signal of market strength and demand.
Bitcoin accumulation through STRC-linked issuance has accelerated in recent months. Strategy (MSTR) purchased 4,467 BTC through STRC-related activity in January. This accumulation rose to 22,131 BTC in March and climbed further to 46,872 BTC in April.
Moreover, both March and April recorded strong Bitcoin gains in the middle of the month. This trend could be linked to the strong accumulation activity in Strategy’s perpetual preferred stock, STRC.
Friday’s dividend could be a key market driver for Bitcoin. As investor demand for STRC continues to rise, Strategy’s dividend obligations grow over time, introducing a longer-term risk tied to its aggressive BTC acquisition model. However, in the near term, the structure remains supportive of Bitcoin prices, as Strategy purchases another lot of BTC supply.
The process is simple. Whenever STRC trades at or above $100, Strategy issues additional shares through its At-the-Market (ATM) program and uses the capital raised to purchase more Bitcoin, which pushes BTC prices upward in the short term.
A solid dividend outcome on Friday could bolster confidence heading into the weekend, while any weakness might highlight reliance on institutional participation for the next leg higher.
“As the STRC dividend record date approaches on Friday, a stable rate would signal market strength and serve as a clear indicator to monitor as the week ends. The key question is whether retail ETF demand can support prices, or if larger corporate buyers must return to sustain the recovery,” said Bitfinex Analyst.
Technical outlook: Overhead supply zone holds strong
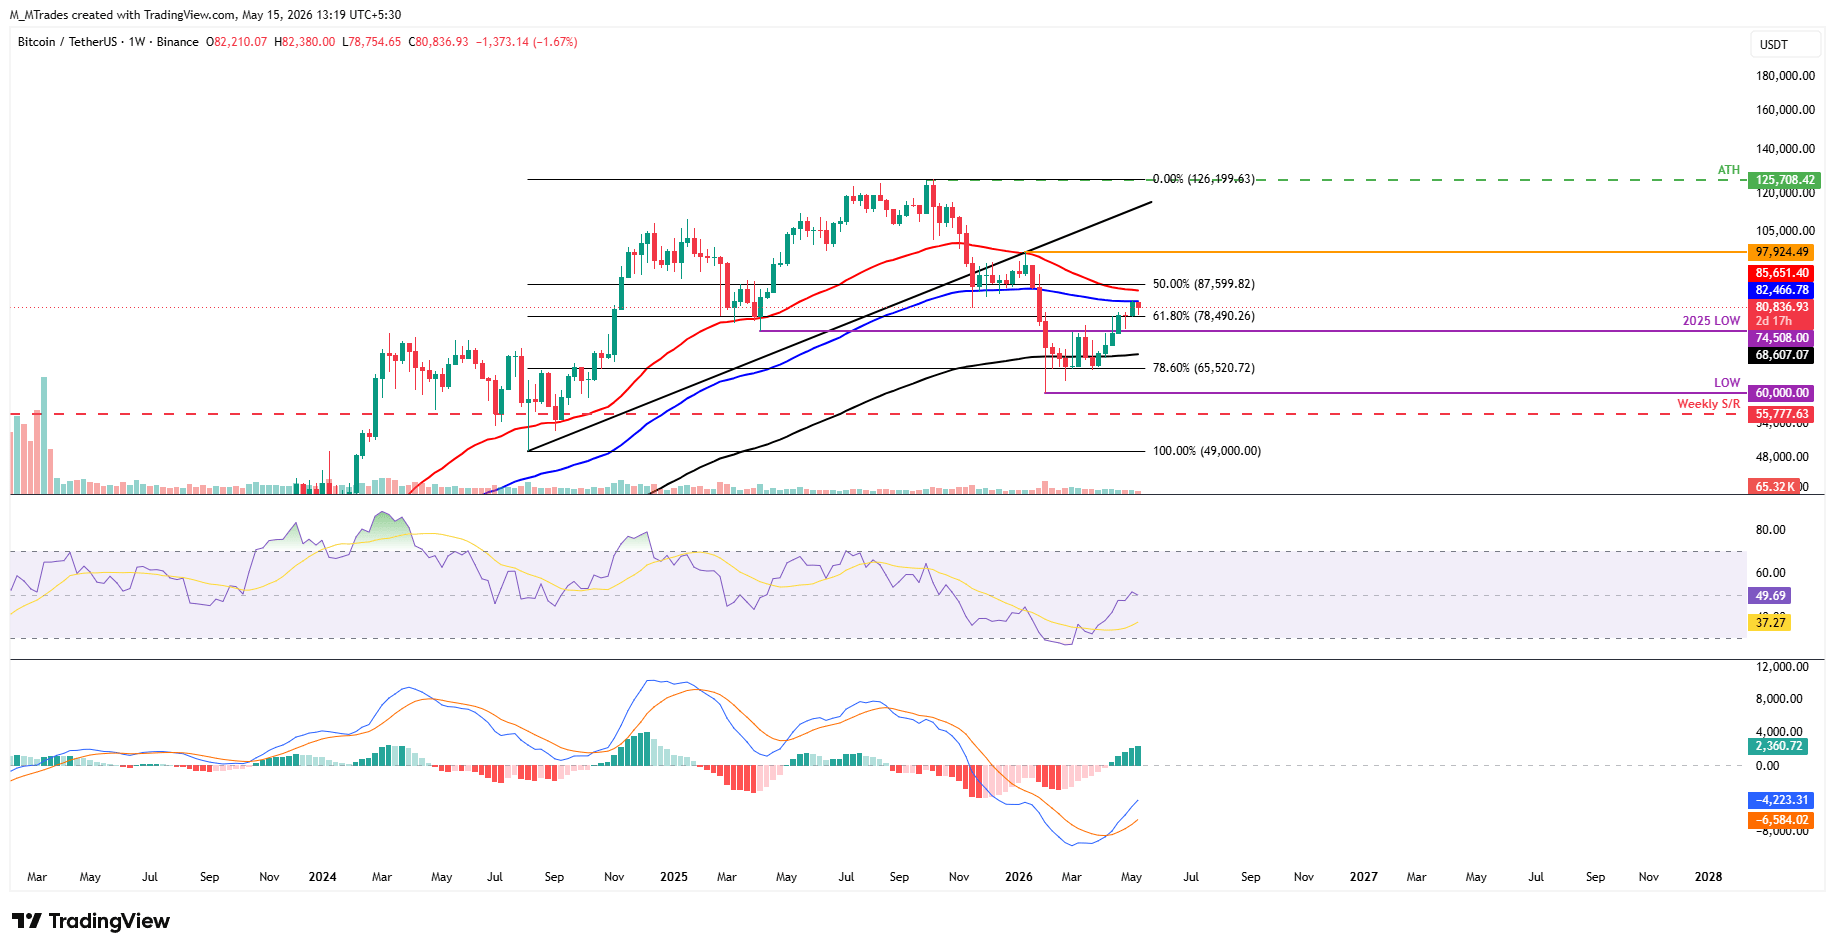
Bitcoin posted its highest weekly close since January at $78,202, up 4.63% last week. However, BTC retested and failed to reclaim the key 100-week Exponential Moving Average (EMA) at $82,466, which remains a strong overhead resistance level.
If BTC continues its correction, it could extend the decline toward the the 61.8% Fibonacci retracement level at $78,490 (drawn from the October all-time high of $126,199 to the February low of $60,000). A close below this level could extend losses toward the key $75,000 psychological support.
Momentum is mixed but improving, with the Relative Strength Index (RSI) on the weekly chart hovering near a neutral 49 while the Moving Average Convergence Divergence (MACD) histogram remains firmly positive, hinting that bullish pressure is attempting to reassert itself despite the recent consolidation.
On the daily chart, the Crypto King is holding a bullish near-term bias as it remains above the 50-day and 100-day EMAs, which are clustered between roughly $76,700 and $76,800, respectively.
BTC has also reclaimed the 50% retracement (drawn from the January high to the February low) at $78,962, which now underpins the advance, while the RSI on the daily chart near 58 suggests constructive but not overbought momentum even as the MACD on the same chart edge stays mildly negative.
On the topside, initial resistance is seen around the 200-day EMA at $82,092 (which roughly coincides with the 100-week EMA as discussed above) and the 61.8% Fibonacci retracement at $83,437, ahead of the horizontal barrier at $84,410.
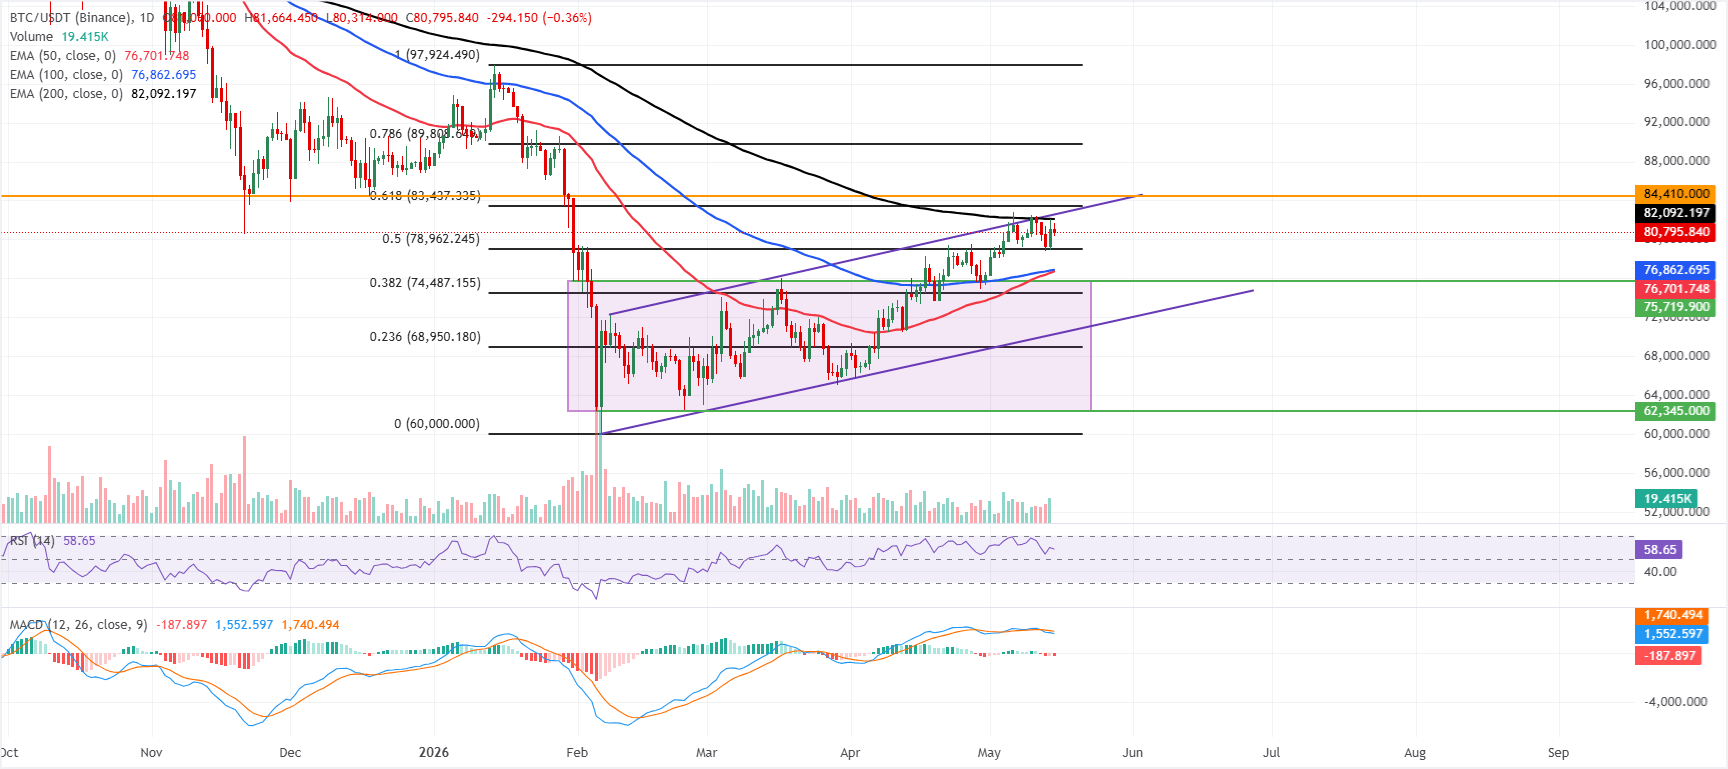
On the downside, immediate support is seen at the reclaimed 50% retracement level at $78,962, with additional layers lower at the 100-day EMA at $76,862 and the 50-day EMA at $76,701, before stronger structural cushions emerge near the 38.2% Fibonacci retracement at $74,487 and the former trendline break area around $70,286.
(The technical analysis of this story was written with the help of an AI tool.)
Read more
* The content presented above, whether from a third party or not, is considered as general advice only. This article should not be construed as containing investment advice, investment recommendations, an offer of or solicitation for any transactions in financial instruments.


