Gold Price Trend Forecast: US-Iran Peace Talks Drive Gold Rebound, Is the Gold Slump Over?

Mitrade
coverImg
Source: DepositPhotos

TradingKey - As of the Asian session on June 12, gold ( XAUUSD) prices oscillated lower near $4,180. Yesterday, gold prices briefly dipped toward $4,000 before rebounding sharply above $4,200 on news of an impending U.S.-Iran agreement, but with the June decline still as high as approximately 8%, the market remains biased toward the short side.

U.S.-Iran situation dominates market trends

From a fundamental perspective, the U.S.-Iran situation continues to dominate market direction.

Latest reports show that on June 12 ET, Trump stated he would cancel a new round of planned airstrikes against Iran, noting that a U.S.-Iran agreement could be signed in Europe as early as this weekend, with the Strait of Hormuz to reopen following the signing. This news directly compressed the Middle East risk premium, sending oil prices to a two-month low and significantly easing market concerns over energy supply disruptions.

However, the situation has not shifted entirely toward peace. Reports indicate that the Iranian Foreign Minister stated that while most of the negotiating text is complete, Tehran has yet to make a final decision and will not compromise on its "red lines"; meanwhile, the U.S. claimed to have shot down two Iranian drones near the Strait of Hormuz, and Iran intercepted a tanker attempting to pass. Israel denied involvement in the agreement and emphasized that Iran's nuclear and missile issues remain unresolved. This suggests that while the market is trading on expectations of de-escalation, the risk of renewed escalation cannot be entirely ruled out.

At the same time, U.S. inflationary and interest rate pressures have not dissipated. Latest PPI data for May showed a 6.5% year-on-year increase, indicating that the Middle East energy shock has already passed through to upstream prices. Previous CPI data also showed U.S. inflation rising to 4.2%. Even if oil prices retreat on expectations of peace, it remains difficult for the Federal Reserve to pivot to a distinctly dovish stance ahead of its June meeting. As long as Treasury yields remain elevated, the room for a rebound in gold, a non-interest-bearing asset, will be limited.

Gold Price Trend Analysis: Bull-Bear Decision Hinges on Weekly Close Above $4,100
gold-28dc3a99576d4f7f8126c9780c4d152f

Gold price daily chart, Source: TradingView

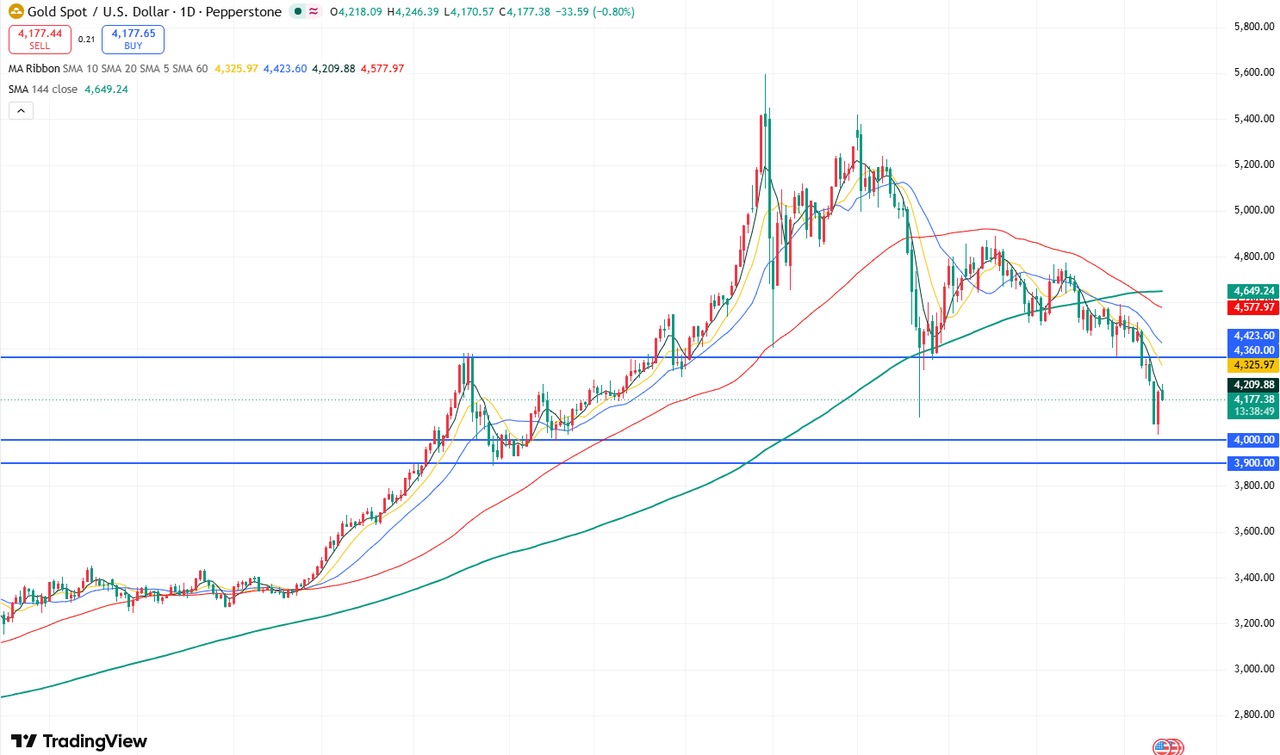
Based on the gold daily chart, prices rebounded sharply after dropping to the $4,000 psychological level yesterday, fueled by expectations of U.S.-Iran peace talks, and briefly broke above $4,200. However, today's price action remains pressured below the 5-day moving average, maintaining a weak intraday decline that could extend the recent downward trend and retest the $4,000 support level.

If the price can effectively break above the 5-day moving average resistance intraday, gold may open up upside potential toward the $4,300-$4,360 range.
goldw-0febad3b42164d27bc2de41e13537b50

Gold price weekly chart, Source: TradingView

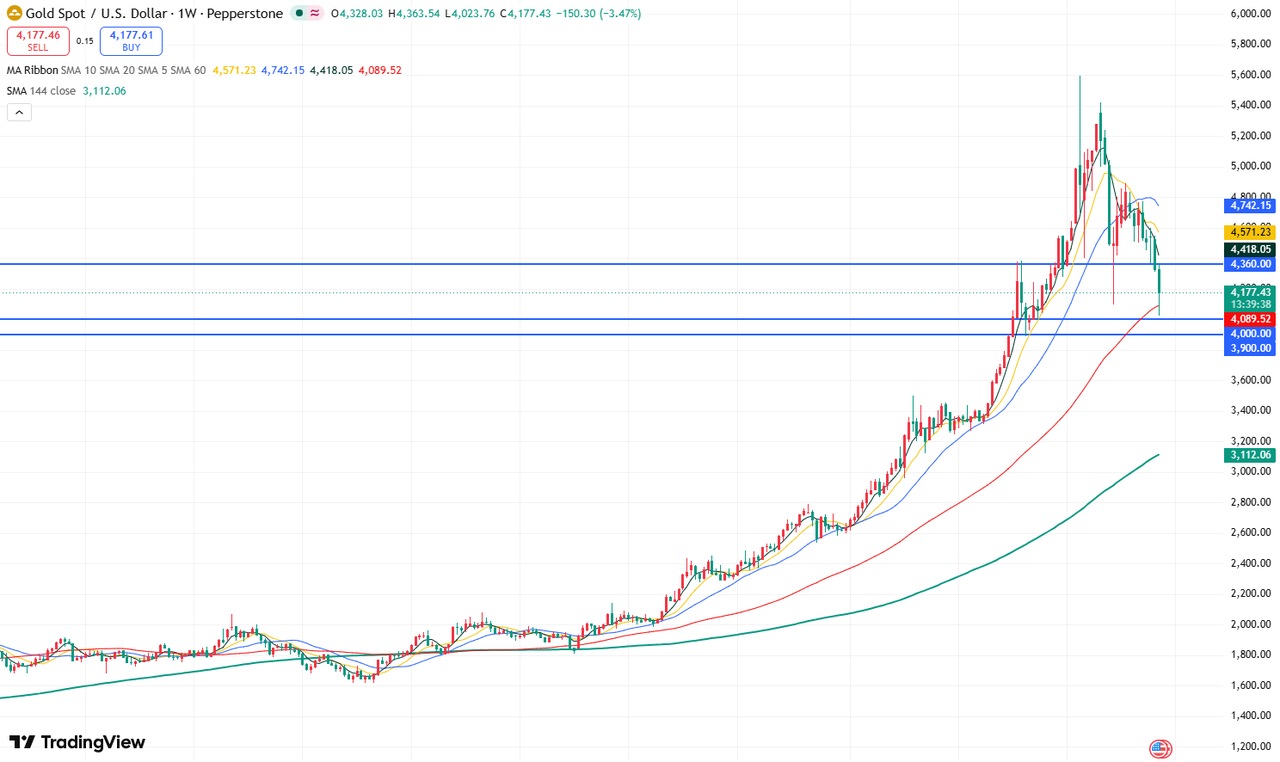
On the gold weekly chart, prices briefly dipped below the $4,100 support level before returning above it. The weekly closing price is expected to hold firm above $4,100 and the 60-period simple moving average (SMA60), potentially forming a support confluence structure.

If the weekly close is confirmed above $4,100 and the SMA60, bullish momentum will strengthen significantly, supporting a rebound to test the $4,360 resistance level, with further resistance at $4,480.

Conversely, if the weekly close falls below $4,100 and breaks the SMA60, gold prices will open up downside room toward $3,900, with a potential further decline toward $3,500.

Read more

  • Gold Price Forecast: Gold Tumbles Below $3,900 as Trump Says No Need for Iran Deal; Can October PPI Spur a Rebound?
  • * The content presented above, whether from a third party or not, is considered as general advice only.  This article should not be construed as containing investment advice, investment recommendations, an offer of or solicitation for any transactions in financial instruments.

    goTop
    quote
    Related Articles
    placeholder
    Gold Price Forecast: Gold Tumbles Below $3,900 as Trump Says No Need for Iran Deal; Can October PPI Spur a Rebound? As of the Asian session on Friday (November 13), gold prices (XAUUSD) rebounded intraday following Thursday's sharp decline, trading near $3,910. Previously, gold tumbled 2.76% on Thursda
    Author  TradingKey
    Nov 13, Fri
    As of the Asian session on Friday (November 13), gold prices (XAUUSD) rebounded intraday following Thursday's sharp decline, trading near $3,910. Previously, gold tumbled 2.76% on Thursda
    placeholder
    Gold hit a one-year low while central banks bought 321 tonnes — the sellers were never the ones you thinkSpot gold closed at 3,876 on Thursday, down 2.8% and its lowest close in more than a year, with an intraday low near 3,852. The dollar is at a 19-month high of 103.21 and the 10-year yield is at 5.10%, so the price move is easy to explain. What is harder to explain is who sold: central banks bought 321 tonnes in Q3, the PBoC added for a 24th straight month, ETF holdings are near a record 4,256 tonnes, and roughly 95% of the futures selling came from non-reportable and sovereign-type accounts rather than hedge funds. This piece separates the two books that have to balance.
    Author  Irene Q.
    Nov 13, Fri
    Spot gold closed at 3,876 on Thursday, down 2.8% and its lowest close in more than a year, with an intraday low near 3,852. The dollar is at a 19-month high of 103.21 and the 10-year yield is at 5.10%, so the price move is easy to explain. What is harder to explain is who sold: central banks bought 321 tonnes in Q3, the PBoC added for a 24th straight month, ETF holdings are near a record 4,256 tonnes, and roughly 95% of the futures selling came from non-reportable and sovereign-type accounts rather than hedge funds. This piece separates the two books that have to balance.
    placeholder
    US October PPI Preview: Fed Rate Hike Expectations Rise, PPI May Be Key Variable; How Will US Stocks, Dollar, and Gold Move?On Friday (Nov. 13) Eastern Time, the U.S. will release the October Producer Price Index (PPI). Following the October CPI once again exceeding expectations, the market will look to the PP
    Author  TradingKey
    Nov 12, Thu
    On Friday (Nov. 13) Eastern Time, the U.S. will release the October Producer Price Index (PPI). Following the October CPI once again exceeding expectations, the market will look to the PP
    placeholder
    Gold closed below $4,000 again — the ETF crowd and central banks stayed, the momentum money leftSpot gold is trading near $3,999, its third consecutive lower daily low, after a 5.00% 10-year yield and a 102.85 dollar index raised the odds of a December hike to 87%. But the selling is not coming from the strategic holders: managed-money net longs fell to 324 tonnes, a 21-week low, and Goldman Sachs attributes roughly 95% of five weeks of selling to non-reportable positions. ETFs still hold a record 4,256 tonnes and central banks bought 321 tonnes in Q3. The table below sets the triggers, directions and levels.
    Author  Irene Q.
    Nov 12, Thu
    Spot gold is trading near $3,999, its third consecutive lower daily low, after a 5.00% 10-year yield and a 102.85 dollar index raised the odds of a December hike to 87%. But the selling is not coming from the strategic holders: managed-money net longs fell to 324 tonnes, a 21-week low, and Goldman Sachs attributes roughly 95% of five weeks of selling to non-reportable positions. ETFs still hold a record 4,256 tonnes and central banks bought 321 tonnes in Q3. The table below sets the triggers, directions and levels.
    placeholder
    Gold Extends Slide Below $4,000 as Rising US Inflation, Fed December Hike Bets Pressure Prices On November 12, gold prices (XAUUSD) extended their recent losses, falling further below $4,000 in early Asian trading to hit an intraday low near $3,968, marking a third consecutive day
    Author  TradingKey
    Nov 12, Thu
    On November 12, gold prices (XAUUSD) extended their recent losses, falling further below $4,000 in early Asian trading to hit an intraday low near $3,968, marking a third consecutive day
    Live Quotes
    Name / SymbolChart% Change / Price
    XAUUSD
    XAUUSD
    0.00%0.00
    XAGUSD
    XAGUSD
    0.00%0.00

    Gold Related Articles

    • 10 Best Day Trading Platforms for Beginners and Active Traders in 2026: A Practical Guide
    • What is Gold CFD? How to Trade Gold CFD With Mitrade Example
    • ​5 Best Paper Trading Platforms for 2026 (Free Demo Accounts for Beginners & Traders)
    • XAU/USD Gold Price Trend Analysis 2026: Will It Keep Rising?
    • Is Mitrade Right for You? A Complete Guide on How to Start Trading CFDs in 5 Steps
    • How and Where to Buy Gold in Australia? A Complete Guide for Beginners

    Click to view more