


Gold Price Analysis Today | Forex Gold Analysis | XAU/USD Analysis - November 6, 2026


Today's Gold Price
Gold price chart for today
*0% Commission and Low Spreads 0️⃣
*$50,000 in Free Virtual Funds 💰
*$100 New Customer Bonus 🎁
Gold (XAU/USD) traded around $4,098 this morning (November 6, 2026) after Wall Street plunged on a technology-stock selloff, driving funds into bonds and sending the 10-year Treasury yield down to 4.82%. The odds of a Federal Reserve rate hike in December fell to 66–69%, while stronger labor productivity helped contain inflation. Today, watch resistance at $4,145–4,157 and tonight's nonfarm payrolls (NFP) data.
Today's Key Points
| Key Takeaways |
|
|
|
Wall Street Technology Selloff Sends 10-Year Yield to 4.82%, Lowers December Fed-Hike Expectations and Supports Gold
U.S. equities faced heavy selling in technology shares amid concerns over funding costs and scrutiny of AI infrastructure. The Philadelphia Semiconductor Index plunged 12%, pushing global investment sentiment into risk-averse mode.
The selloff drove funds into bonds, sending the 10-year yield down to 4.82%, its lowest in two months, and reducing the chance of a December Fed rate hike to 66–69%. Gold rebounded to $4,148 before pulling back to trade around $4,098.
U.S. Labor Productivity Rises 3.6% and Unit Labor Costs Fall 0.7%, Containing Inflation; Jobless Claims Hit More Than Three-Month Low
Third-quarter nonfarm productivity expanded strongly by 3.6%, above expectations of 2.8%, while unit labor costs fell 0.7% after rising 1.9% in the prior quarter. The figures show that productivity is absorbing wage costs without passing them through into inflation.
Meanwhile, initial jobless claims fell by 6,000 to 189,000, the lowest in more than three months, signaling continued labor-market strength. However, easing labor costs reduced inflation concerns, leaving the Fed under less pressure to raise interest rates aggressively and supporting gold.
Strait of Hormuz Tensions Lift Oil to $98 and Renew Inflation Concerns; Markets Watch NFP Tonight
An attack on a commercial vessel near the Strait of Hormuz lifted Brent crude to $98.29 and WTI to $90.52. While this renewed concerns over energy inflation, it also raised the risk premium and prompted safe-haven gold buying, helping gold remain firm.
Markets are also watching tonight's nonfarm payrolls (NFP) report, expected to show an increase of 65,000 jobs and unemployment at 4.2%. If the data slow as expected, it would reinforce a slower Fed tightening path, push yields lower and support gold's test of key resistance.



Technical Analysis of Gold (XAU/USD)
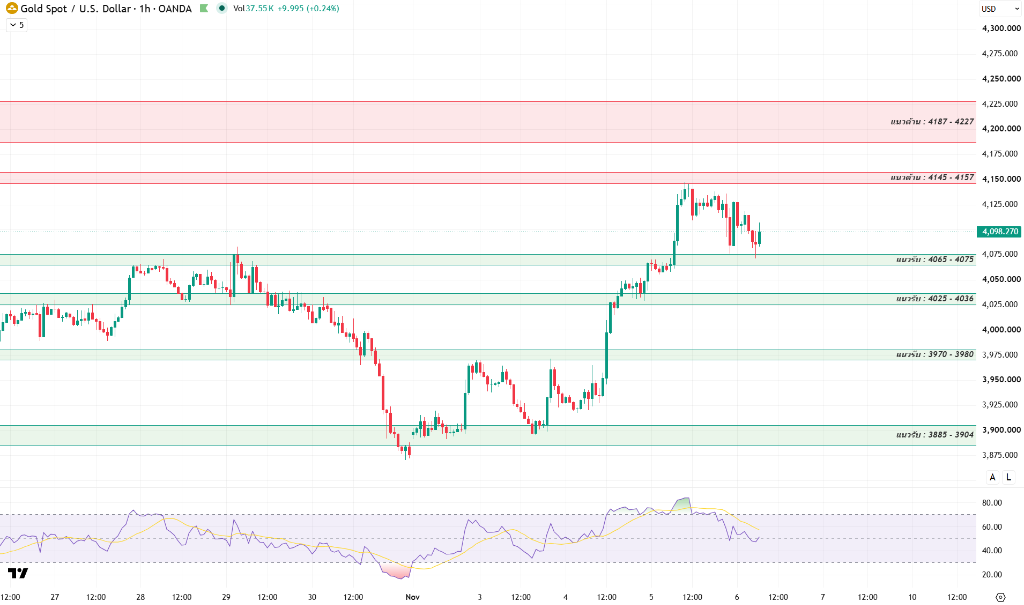
On the 1-hour chart, gold is consolidating around $4,098 after testing resistance at $4,145–4,157 and reaching a high of $4,148 before encountering short-term profit-taking alongside equities. However, the broader structure continues to hold initial support at $4,065–4,075 and maintains a stable higher-low pattern.
The RSI (14), which reached overbought territory near 78 when gold tested $4,148, has eased to 53. This reflects absorption of profit-taking, reduces technical overheating and gives price room to consolidate above key support before its next directional move.
Today's key decision point is holding above support at $4,065–4,075. If gold stabilizes and reclaims $4,157, further upside could open up. If it fails, watch for a bull trap that could push price back toward the next support.
If gold can reclaim resistance at $4,145–4,157, it could rise toward $4,187–4,227 and then $4,285–4,300. However, a break below $4,065 support would open downside toward $4,025–4,036 and the key base at $3,970–3,980.
Today's Gold Price Outlook
| Scenarios |
|
|
|
Today's Trading Strategy
For short-term traders, trade the range cautiously. Wait for selling pressure to be absorbed near $4,065–4,075 support, or for a reclaim above $4,157 resistance before following the move higher. Always set a stop loss.
- Buy setup: Wait for a pullback to test $4,065–4,075 or $4,025–4,036 support with clear buying support, or follow a break above $4,157. The profit target is $4,187–4,227, with a stop loss below $4,055.
- Sell setup: Consider opening a short position if price rebounds to test $4,145–4,157 or $4,187–4,227 resistance and shows rejection, or follow a break below $4,065. The target is around $4,025–4,036, with a stop loss above resistance.
For longer-term holders, support from a slower tightening path and safe-haven buying remains strong. Consider accumulating on pullbacks around $4,025–4,036 support or the $3,970–3,980 zone.
Daily Support and Resistance Levels
| Type | Price Level |
| Support #1 | $4,065–4,075 |
| Support #2 | $4,025–4,036 |
| Support #3 | $3,970–3,980 |
| Resistance #1 | $4,145–4,157 |
| Resistance #2 | $4,187–4,227 |
| Resistance #3 | $4,285–4,300 |
Today's Questions (FAQ)
Why did Wall Street's plunge become a positive factor for gold prices?
The Wall Street technology-stock selloff prompted investors to move into safe-haven assets, sending the 10-year yield to 4.82% and reducing the chance of a December Fed rate hike to around 66–69%. Lower bond yields reduce gold's opportunity cost and directly support buying.
How do labor productivity rising 3.6% and jobless claims of 189,000 affect gold?
Labor productivity rising 3.6% helped reduce unit labor costs by 0.7%, showing that businesses can absorb wage costs without accelerating inflation. Although jobless claims of 189,000 point to a still-strong labor market, easing wage-inflation pressure means the Fed does not need to accelerate rate hikes, supporting gold.
Read more
The above content was completed with the assistance of AI and has been reviewed by an editor.


