


Gold's $250 week runs into the last payrolls before December


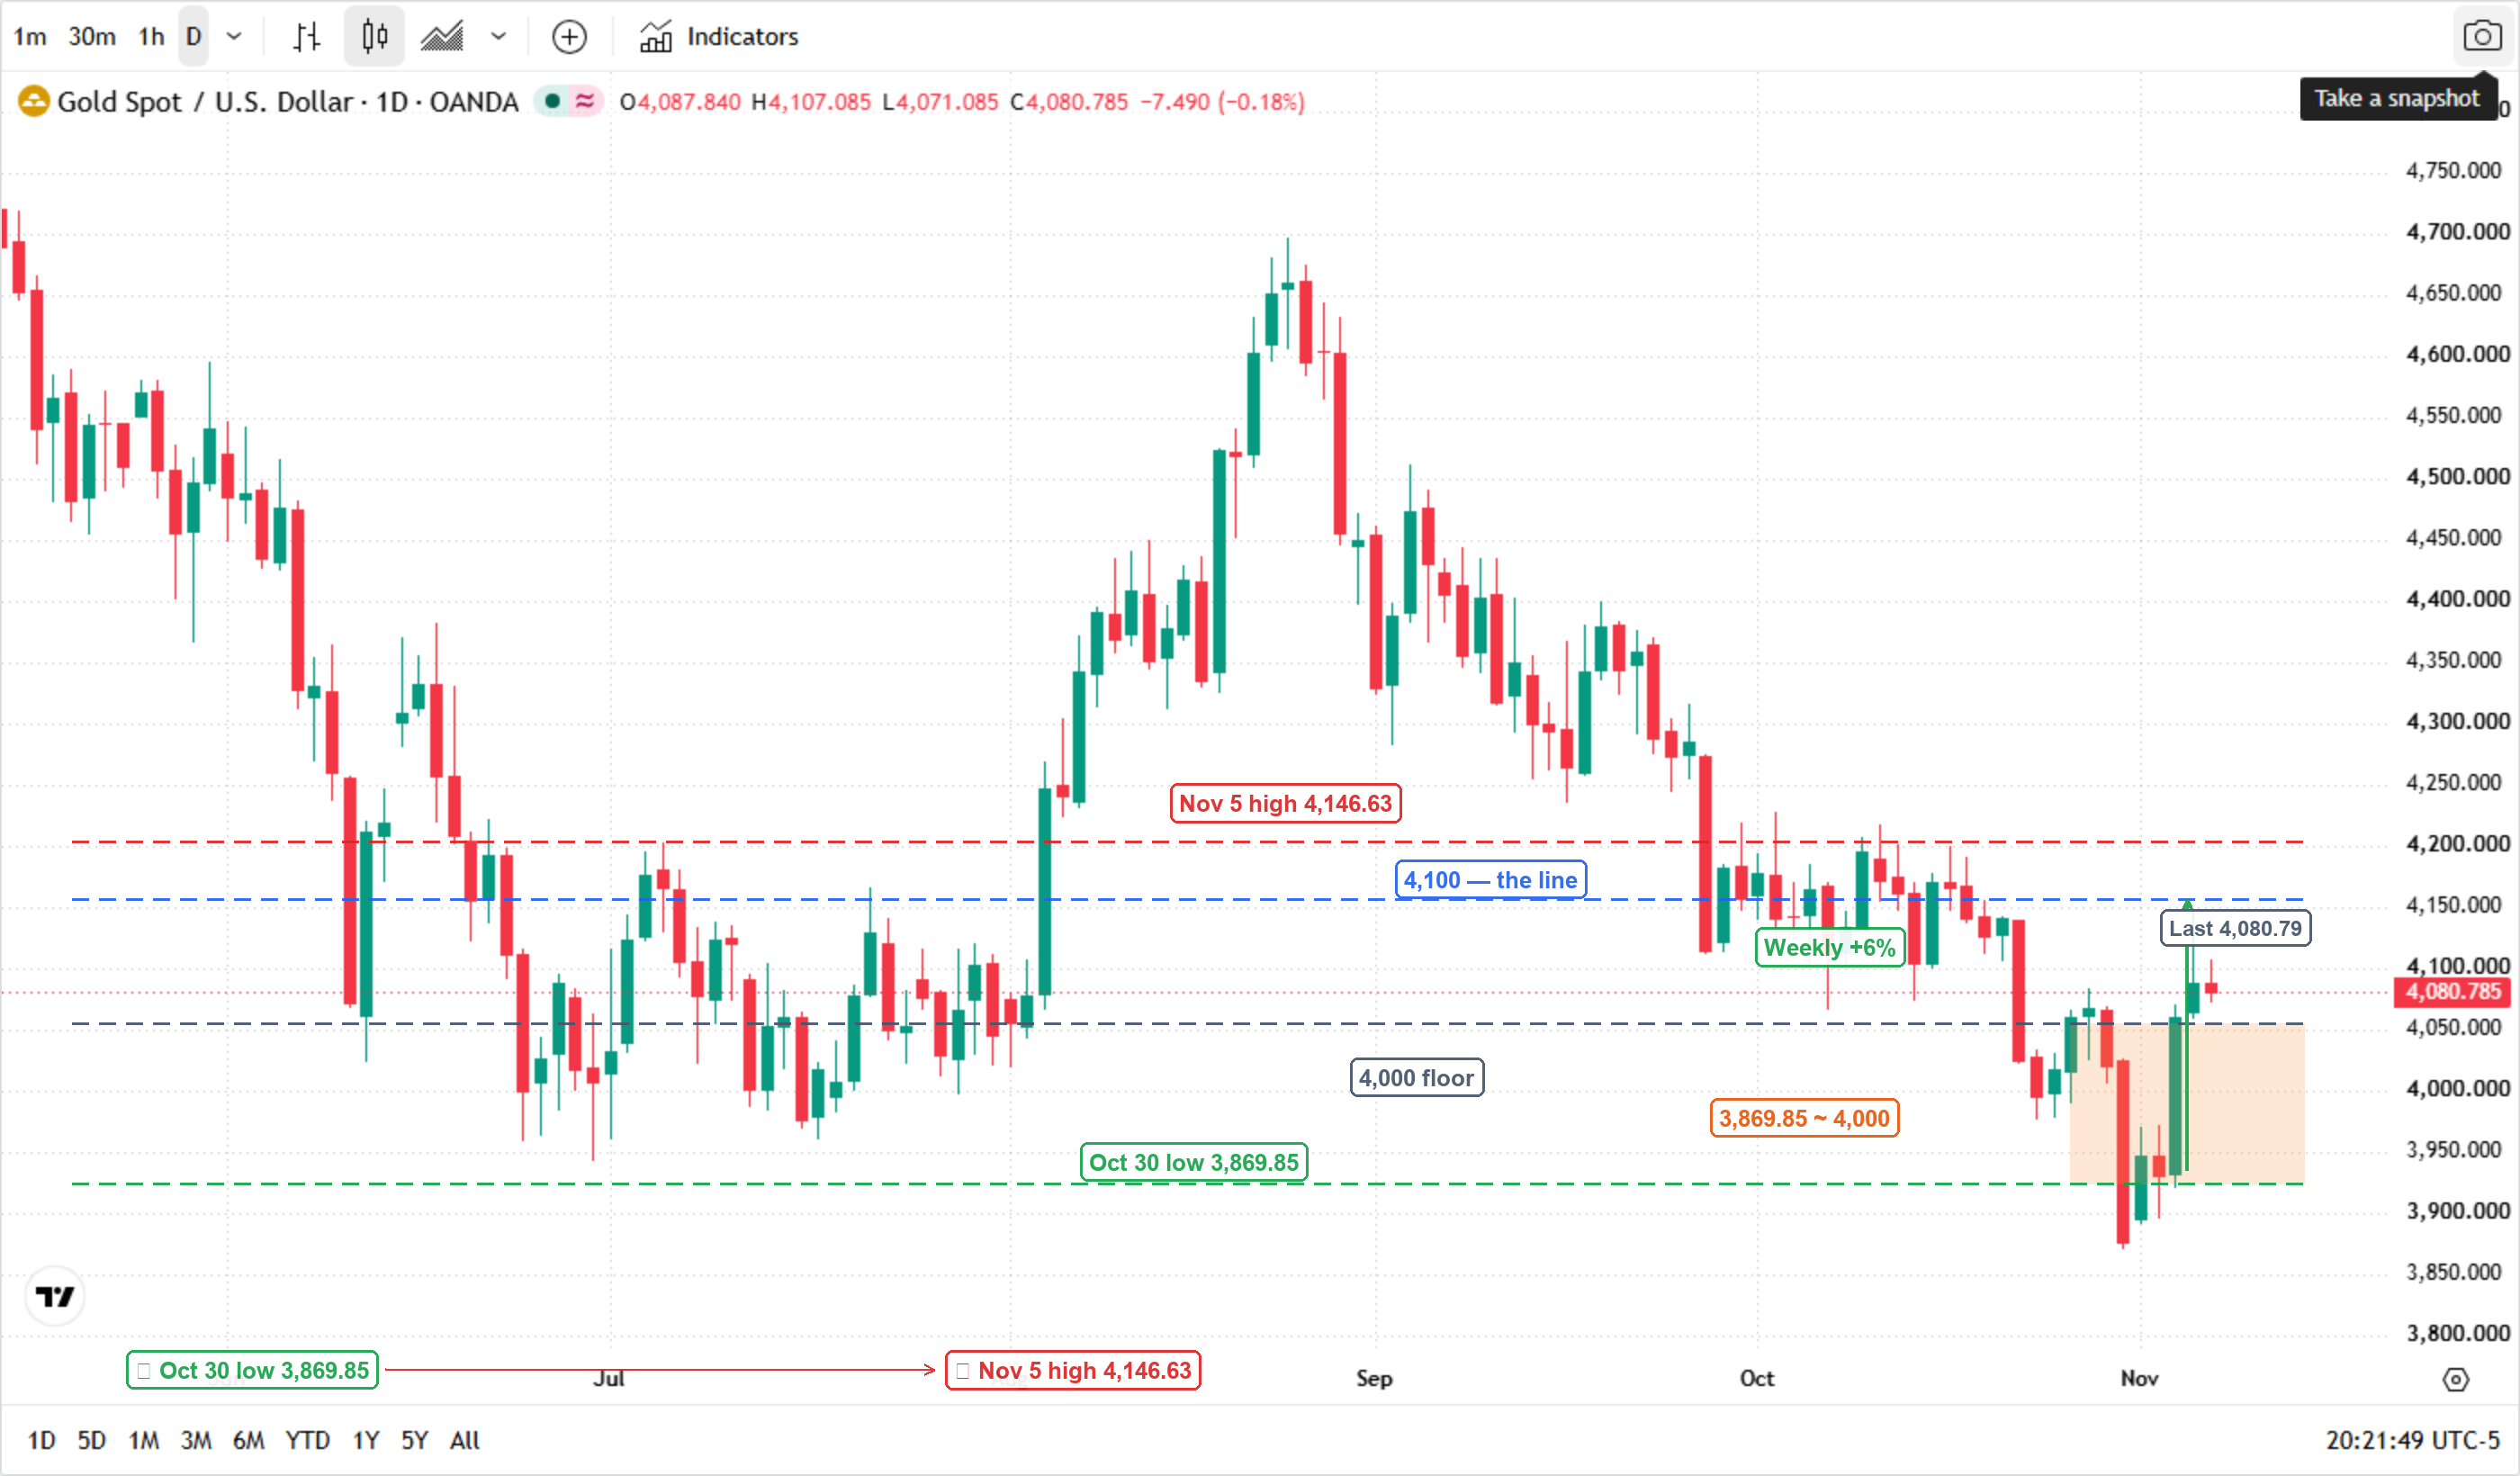
Mitrade Insights — Spot gold traded at $4,080.79 on Nov 6, after a roughly $250, or 6%, weekly rally from the Oct 30 low of $3,869.85. It touched $4,146.63 on Nov 5, the highest since Oct 20. The move looks like a classic safe-haven bid, but it is really three separate bids stacked on top of each other — and only one of them is fragile enough to break on a single payrolls print.
* Chart source: TradingView (XAU/USD, daily)
Three bids are stacked into $4,100
The first bid is real-rate relief. The 10-year Treasury yield has fallen from an October high of 5.36% to 4.837%, a two-month low. The dollar index is at 101.60, its lowest since late September. Gold pays no coupon, so when real yields fall, the opportunity cost of holding it falls too.
The second bid is the official sector. Central banks bought 321 tonnes in Q3, up 42% year over year and the strongest quarter since Q4 2024. Year-to-date purchases are 675 tonnes, up 6% from a year earlier. China bought 63 tonnes in Q3, its largest quarter since 2022, lifting its reserves to 2,410 tonnes.
The third bid is the geopolitical premium. The Middle East supply risk has not gone away, and the oil market’s 8% round trip this week shows how quickly a risk premium can be added and removed. Gold is the cleanest place to park that uncertainty while the headlines are noisy.
The real-rate bid is the fragile one
Of the three, the real-rate bid is the most sensitive to tonight’s data. The 10-year yield has fallen more than 50 basis points from its October high, but the market still prices a 66% chance of a 25-basis-point hike in December, down from roughly 82% a day earlier. That is not a market pricing cuts; it is a market pricing a slower hiking cycle.
If payrolls come in above 100,000 with average hourly earnings at 0.3% or higher, the yield and the dollar can retrace part of that move, and the real-rate bid weakens. If payrolls come in below 30,000, or unemployment rises to 4.3%, the December hike odds fall further and the real-rate bid gets another leg.
The official sector is still buying
The official-sector bid is slower and less sensitive to one data point. Q3 central-bank purchases of 321 tonnes were the strongest quarter since Q4 2024, and the World Gold Council has raised its full-year forecast to at least 848 tonnes, matching 2025. ETF holdings hit a record 4,256 tonnes in Q3, with net inflows of 211 tonnes. SPDR Gold Trust holdings rose 2.851 tonnes to 1,040.513 tonnes on Nov 4.
321 tonnes vs a 17% drop in jewellery
The interesting part is the two-speed demand. While central banks and ETFs were buying, physical consumer demand was weakening. Bar and coin demand fell 19% year over year to 268 tonnes; jewellery demand fell 17% to 313 tonnes. That is not a demand story that supports a vertical price move — it is a demand story that supports a floor.
That distinction matters for how you read $4,100. The official sector is price-insensitive and strategic; it does not need a payrolls print to justify buying. The consumer is price-sensitive and has already stepped back. The marginal buyer at $4,100 is therefore the macro fund, not the jeweller — and macro funds trade the next data point.
Tonight's payrolls decide which bid stays
The October report lands at 8:30 a.m. ET on Nov 6, the last full employment report before the Dec 8–9 FOMC. Consensus is +65,000, unemployment at 4.2%, and average hourly earnings at +0.3% month over month, or 2.9% year over year. The leading indicators are mixed but mostly firm: ADP +86,000, JOLTS openings up 333,000 to 7.523 million, initial claims at 189,000, and Challenger layoffs down 71% year over year.
| Scenario | Payrolls / unemployment | Gold read | Key level |
|---|---|---|---|
| Goldilocks | +50K to +70K / 4.2% | Range holds; real-rate bid intact | $4,000 – $4,146.63 |
| Hot | Above +100K / 4.2% or lower | Yields and dollar up; real-rate bid weakens | Test $4,000, then $3,975 |
| Cold | Below +30K / 4.3% or higher | December hike odds fall; real-rate bid extends | $4,146.63, then $4,200 |
The line between $4,000 and $4,200
The technical map is simple. $4,000 is the floor the market reclaimed after the Oct 30 low of $3,869.85 and held on Nov 2; a close below $3,975 would open $3,900 and then the Oct 30 low of $3,869.85. On the upside, $4,146.63 is the Nov 5 high; a clean break opens $4,200, the next round-number resistance.
The intraday high of $4,146.63 is also the first test of whether the rally is more than a short squeeze. The move from $3,869.85 to $4,146.63 is 7.1% in five sessions, which is fast enough to be a positioning squeeze and large enough to need a fundamental anchor. Tonight’s data is that anchor.
The bull case and the bear case
The bull case is straightforward. Citi’s 0–3 month target is $4,500, cut from $4,800, with a 6–12 month target of $5,000. FxPro sees $4,400–$4,500 within weeks if the dollar keeps weakening. Central banks are buying 321 tonnes a quarter, ETF holdings are at a record, and the real-rate bid has room to run if the Fed pauses after December.
The bear case is equally specific. Citi assigns a 30% probability to a prolonged Middle East conflict that pushes gold to $3,500. StoneX’s Fawad Razaqzada says $4,100 is a significant support zone but doubts the correction is over. MarketGauge’s Michele Schneider argues the “real support” has not appeared yet and prefers Treasuries as the safe haven. If payrolls are hot, the real-rate bid — the most fragile of the three — is the first to go.
The market is not short of targets; it is short of agreement on which bid is doing the buying. That is why $4,000 and $4,200 matter more than any single forecast.
Read more
Before making any trading decisions, it is important to equip yourself with sufficient fundamental knowledge, have a comprehensive understanding of market trends, be aware of risks and hidden costs, carefully consider investment targets, level of experience, risk appetite, and seek professional advice if necessary.
Furthermore, the content of this article is solely the author's personal opinion and does not necessarily constitute investment advice. The content of this article is for reference purposes only, and readers should not use this article as a basis for any investment decisions.
Investors should not rely on this information as a substitute for independent judgment or make decisions solely based on this information. It does not constitute any trading activity and does not guarantee any profits in trading.
If you have any inquiries regarding the data, information, or content related to Mitrade in this article, please contact us via email: insights@mitrade.com. The Mitrade team will carefully review the content to continue improving the quality of the article.


