

USD/JPY Price Forecast: Bullish pin bar faces 200-day SMA wall

Source Fxstreet
  • USD/JPY forms potential bullish pin bar below 200-day SMA resistance.
  • RSI remains bullish but turns lower, signaling fading buying momentum.
  • Break above 159.00 exposes 159.16, while losing 157.39 threatens 156.08.

The USD/JPY edges lower but trims some of its earlier losses, down 0.20% in the aftermath of the US midterm election results. However, the pair seems to form a tilted bullish ‘pin bar ’, yet it remains consolidated within the 50- and 200-day SMAs, each at 157.39 and 158.62. At the time of writing, the pair trades at 158.41.

USD/JPY Price Forecast: Technical outlook

The USD/JPY remains subdued, with no clear bias. The market structure of lower highs and lower lows remains intact, but if buyers reclaim 159.00, a move to the 100-day SMA at 159.16 is on the cards, with buyers eyeing a test of 160.00.

From a momentum standpoint, that move seems remote. The Relative Strength Index (RSI), although bullish, is aiming downwards. Still, if USD/JPY clears 160.00, buyers could negate the bearish market structure on a breakout of the September 2 high of 160.39.

On the other hand, for a bearish continuation, sellers must drag the USD/JPY below 158.00 and clear the 50-day SMA at 157.39. A breach of the latter will expose 157.00, with sellers setting their sights on the October 23 low of the day (LOD) at 156.08.

USD/JPY Price Chart – Daily
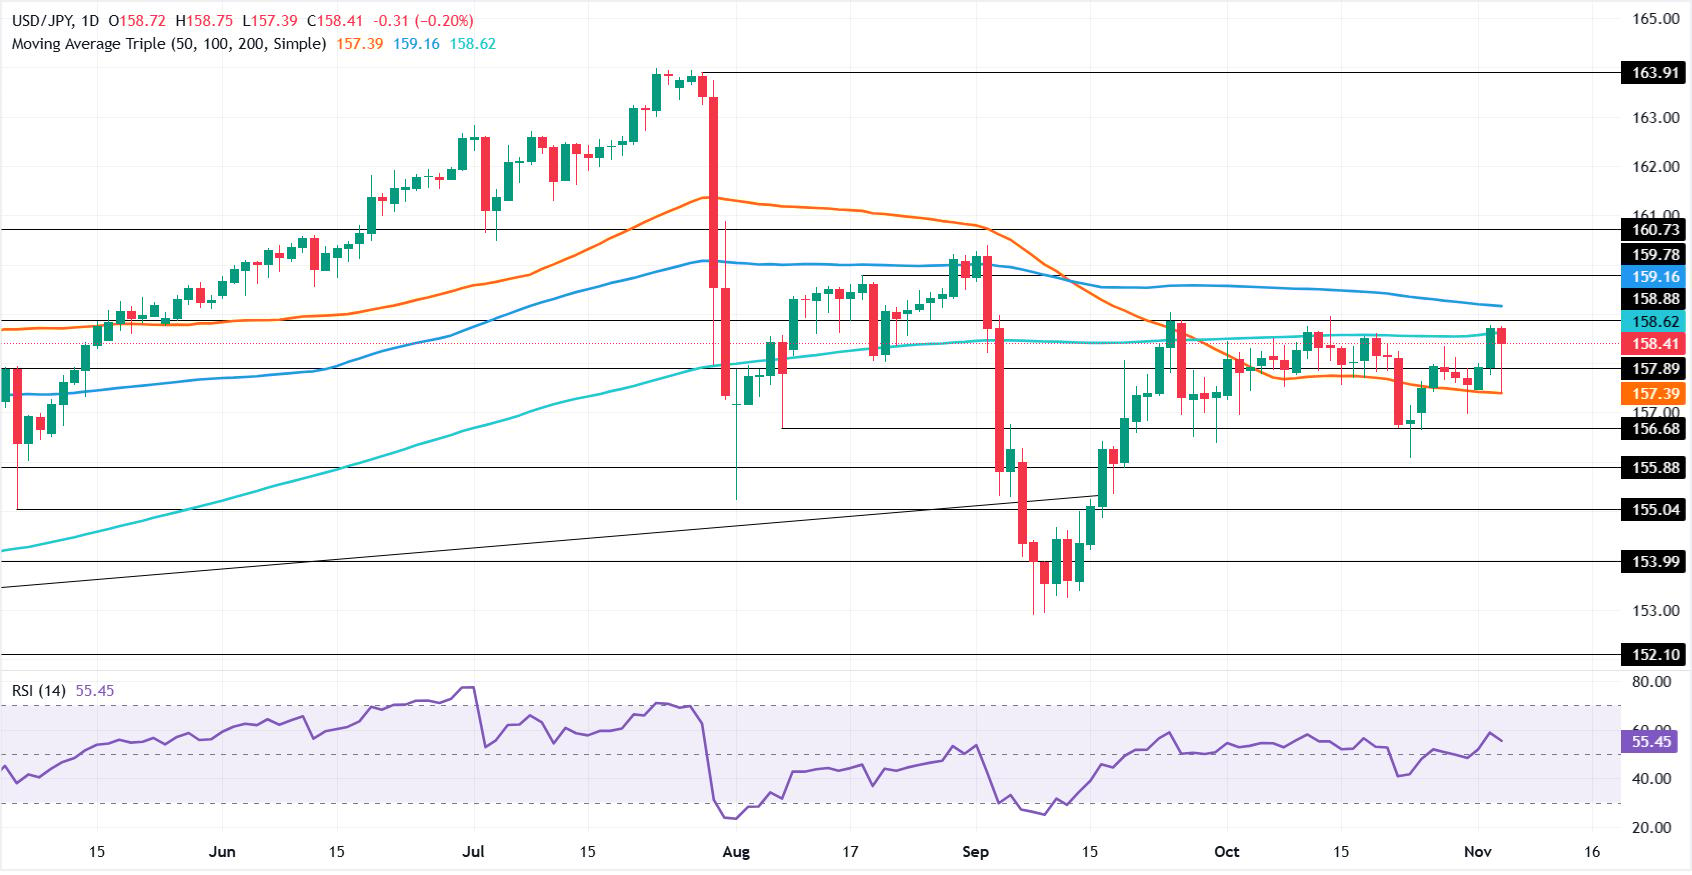
USD/JPY daily chart

Japanese Yen Price Today

The table below shows the percentage change of Japanese Yen (JPY) against listed major currencies today. Japanese Yen was the strongest against the US Dollar.

USD EUR GBP JPY CAD AUD NZD CHF
USD -0.37% -0.44% -0.21% -0.27% -0.54% -0.22% -0.52%
EUR 0.37% -0.06% 0.20% 0.13% -0.16% 0.20% -0.15%
GBP 0.44% 0.06% 0.23% 0.17% -0.10% 0.23% -0.09%
JPY 0.21% -0.20% -0.23% -0.07% -0.34% -0.03% -0.33%
CAD 0.27% -0.13% -0.17% 0.07% -0.27% 0.04% -0.26%
AUD 0.54% 0.16% 0.10% 0.34% 0.27% 0.32% 0.02%
NZD 0.22% -0.20% -0.23% 0.03% -0.04% -0.32% -0.29%
CHF 0.52% 0.15% 0.09% 0.33% 0.26% -0.02% 0.29%

The heat map shows percentage changes of major currencies against each other. The base currency is picked from the left column, while the quote currency is picked from the top row. For example, if you pick the Japanese Yen from the left column and move along the horizontal line to the US Dollar, the percentage change displayed in the box will represent JPY (base)/USD (quote).

Disclaimer: For information purposes only. Past performance is not indicative of future results.
placeholder
Gold Price Forecast: Gold Falls Below $4,100, Can October Nonfarm Payrolls Fuel Another Rally?As of the Asian session on Friday (November 6), gold prices (XAUUSD) pulled back following consecutive rebounds, dropping about 0.85% intraday to trade near $4,050. Earlier, gold climbed
Author  TradingKey
9 hours ago
As of the Asian session on Friday (November 6), gold prices (XAUUSD) pulled back following consecutive rebounds, dropping about 0.85% intraday to trade near $4,050. Earlier, gold climbed
placeholder
Micron's $4.5 billion Taiwan fab won't make a chip until 2028 — the market sold it as a 2026 problemMicron fell 17.46% to $656.39 after Bloomberg reported construction at its $4.5 billion Taoyuan Fab 11E had all but halted over a labor dispute. The plant was not due online until 2028, so no 2026 output is lost. With FY27 EPS consensus near $160 and 2027 HBM sold out, the selloff is a peak-cycle multiple reset, not a demand collapse — and $650 is the line that separates the two.
Author  Irene Q.
14 hours ago
Micron fell 17.46% to $656.39 after Bloomberg reported construction at its $4.5 billion Taoyuan Fab 11E had all but halted over a labor dispute. The plant was not due online until 2028, so no 2026 output is lost. With FY27 EPS consensus near $160 and 2027 HBM sold out, the selloff is a peak-cycle multiple reset, not a demand collapse — and $650 is the line that separates the two.
placeholder
Gold's $250 week runs into the last payrolls before DecemberSpot gold traded at $4,080.79 after a roughly 6% weekly rally from the Oct 30 low of $3,869.85, touching $4,146.63 on Nov 5. Three bids are stacked into the move: real-rate relief, record official-sector buying, and a geopolitical premium. Tonight's October payrolls (+65K consensus, 4.2% unemployment) decide which bid survives, with $4,000 and $4,200 as the two lines.
Author  Irene Q.
15 hours ago
Spot gold traded at $4,080.79 after a roughly 6% weekly rally from the Oct 30 low of $3,869.85, touching $4,146.63 on Nov 5. Three bids are stacked into the move: real-rate relief, record official-sector buying, and a geopolitical premium. Tonight's October payrolls (+65K consensus, 4.2% unemployment) decide which bid survives, with $4,000 and $4,200 as the two lines.
placeholder
TradingKey Daily Market Brief: Nasdaq Falls Over 5%, AI Stocks Plunge as Nvidia Drops Over 9%, Micron Falls Over 17%, SanDisk Drops Over 22% During the Asian trading session on November 6, the three major U.S. stock indices tumbled across the board overnight as the sell-off across the AI data center suppl
Author  TradingKey
16 hours ago
During the Asian trading session on November 6, the three major U.S. stock indices tumbled across the board overnight as the sell-off across the AI data center suppl
placeholder
Gold Price Analysis Today | Forex Gold Analysis | XAU/USD Analysis - November 6, 2026Get the latest gold price analysis, forex gold insights, and XAU/USD analysis for November 6, 2026. Read on for the details.
Author  Mitrade
16 hours ago
Get the latest gold price analysis, forex gold insights, and XAU/USD analysis for November 6, 2026. Read on for the details.
Related Instrument
goTop
quote