


Gold Price Analysis Today | Forex Gold Analysis | XAU/USD Analysis - November 5, 2026


Today's Gold Price
Gold price chart for today
*0% Commission and Low Spreads 0️⃣
*$50,000 in Free Virtual Funds 💰
*$100 New Customer Bonus 🎁
Gold (XAU/USD) rose above $4,064 this morning (November 5, 2026) after Democrats won the midterm elections and took control of both chambers of Congress. The resulting legislative gridlock could curb new borrowing plans, sending the 10-year Treasury yield down to 4.88% and weakening the dollar sharply. Slower ISM services activity also eased inflation concerns. Today, watch whether gold can clear resistance at $4,074–4,083.
Today's Key Points
| Key Takeaways |
|
|
|
Democrats Win Midterm Elections and Take Both Chambers, Curbing Tax-Cut and Borrowing Plans; Falling Yields Lift Gold Above $4,000
The 2026 U.S. midterm elections shifted the balance of power after Democrats won majorities in both chambers of Congress, ending Republican unified control. This is expected to produce legislative gridlock, which markets believe could curb Trump's tax-cut plans and large-scale spending.
The outcome eased concerns about new Treasury issuance, sending the 10-year yield down to 4.88%, its lowest in nearly two months, while the dollar weakened. Buying returned to precious metals, lifting spot gold by more than $136, or 3.47%, to $4,065.90 in a strong rebound from October.
ISM Services Index Slows to 54.5 While ADP Employment Rises by 86,000, Signaling Balanced Growth
The Institute for Supply Management said the October services PMI fell to 54.5, below expectations of 54.8. New orders slowed to 55.9, indicating that growth is beginning to cool while remaining in expansion territory. The prices-paid index fell to 73.0, pointing to a modest easing in costs.
Meanwhile, ADP reported that private-sector employment increased by 86,000, above expectations of 67,000, although down from 90,000 in September. The figures suggest the labor market remains resilient despite high interest rates, but investors view them as signaling balanced, noninflationary growth, helping gold hold firm.
Signs of U.S.-Iran Talks Reduce Risk Premium as Crude Oil Pulls Back, Supporting Gold; Markets Watch NFP Later This Week
Geopolitical conditions began to ease after talks between Washington and Tehran showed signs of promise, reducing tensions around the Strait of Hormuz. That pushed crude oil lower, reducing the war-risk premium and easing concerns over energy inflation that had weighed on financial markets.
Meanwhile, gold's move above $4,000 was supported by a risk-on mood on Wall Street and lower yields. Investors are focusing on tonight's unemployment-claims data and Friday's nonfarm payrolls (NFP) report to closely assess the direction of Federal Reserve interest rates.



Technical Analysis of Gold (XAU/USD)
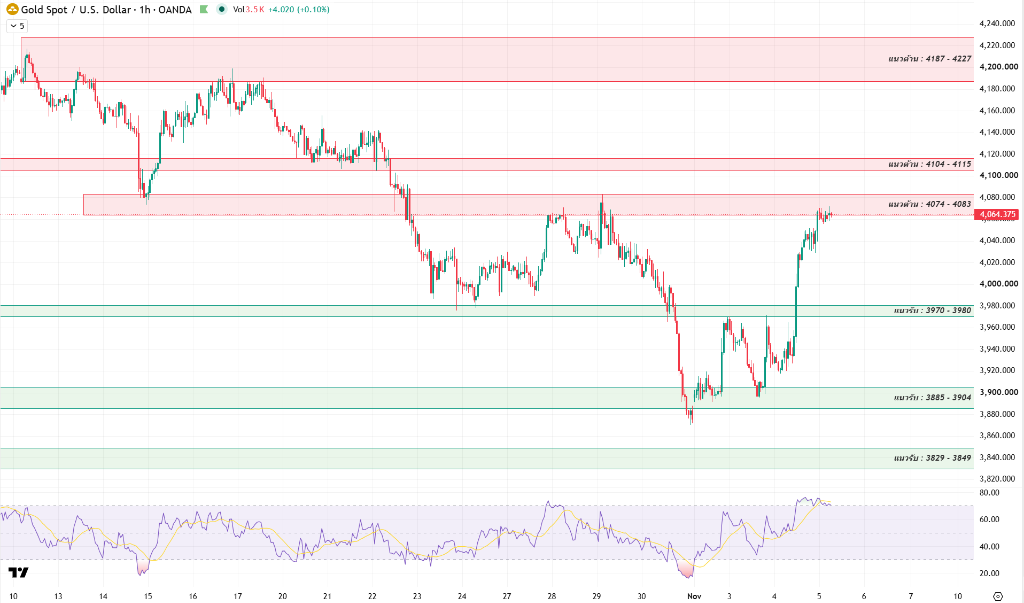
On the 1-hour chart, gold rebounded strongly from the $3,885–3,904 support base, broke above the psychological $4,000 level and cleared former resistance at $3,970–3,980, trading around $4,064.37. It is now approaching the first resistance zone at $4,074–4,083. The short-term structure has recovered strongly as liquidity-absorption buying continues to provide support.
The RSI (14) has climbed to 73, entering overbought territory, reflecting heavy buying and strong positive momentum. However, the elevated reading cautions against short-term profit-taking or a consolidative pullback before the market chooses its next direction.
Today's key decision point is resistance at $4,074–4,083. If gold can reclaim and close above $4,083, further upside could open up. If it fails to break through, watch for a bull trap that could push price back to test initial support at $3,970–3,980.
If price holds above $3,970–3,980 and clears $4,074–4,083, it could recover toward $4,104–4,115 and then $4,187–4,227. However, a break below $3,970 would confirm profit-taking pressure, with the next supports at $3,885–3,904 and $3,829–3,849.
Today's Gold Price Outlook
| Scenarios |
|
|
|
Today's Trading Strategy
For short-term traders, trade the range cautiously because the 1-hour RSI is in overbought territory. Wait for selling pressure to be absorbed near support at $3,970–3,980, or for a break above $4,083 before following the move higher. Always set a stop loss.
- Buy setup: Wait for price to pull back and test support at $3,970–3,980 with clear buying support, or follow a break above $4,083. Profit targets are $4,104–4,115 and $4,187–4,227, with a stop loss below $3,960.
- Sell setup: Consider opening a short position if price rebounds to test resistance at $4,074–4,083 or $4,104–4,115 and shows rejection, or follow a break below $3,970. Targets are around $3,885–3,904, with a stop loss above resistance.
For longer-term holders, the positive support from divided power in Congress remains in place. Consider accumulating on pullbacks near support at $3,970–3,980, or in tranches around $3,885–3,904.
Daily Support and Resistance Levels
| Type | Price Level |
| Support #1 | $3,970–3,980 |
| Support #2 | $3,885–3,904 |
| Support #3 | $3,829–3,849 |
| Resistance #1 | $4,074–4,083 |
| Resistance #2 | $4,104–4,115 |
| Resistance #3 | $4,187–4,227 |
Today's Questions (FAQ)
Why did Democrats' midterm-election victory support gold's move above $4,000?
Democratic control of both chambers creates gridlock, curbing tax-cut and new borrowing plans. That eased investor concerns over Treasury issuance, pushed the 10-year yield down to 4.88% and weakened the dollar, supporting gold's immediate move above $4,000.
How do the slower ISM services index and ADP employment growth of 86,000 affect gold?
The ISM services index falling to 54.5 indicates that growth is beginning to cool, while ADP's increase of 86,000 shows that the labor market remains well supported. Together, these figures point to balanced economic growth and reduce the risk that the Federal Reserve will raise interest rates aggressively, supporting gold.
Read more
The above content was completed with the assistance of AI and has been reviewed by an editor.


