


NVIDIA Stock Rallied 8%, But 3 Signals Point to a Reversal


NVIDIA (NVDA) stock price surged roughly 8% between March 30 and April 1, reclaiming $175.75 after weeks of selling pressure.
The rally had clear catalysts. However, underneath the optimism, institutional money flow, options positioning, and a historic macro correlation all point to fading strength. For a high-valuation growth stock like NVIDIA, the combination could turn an 8% gain into a setup for a sharper move lower.
NVIDIA Stock Rallied 8%, but Institutional Money Disagreed
NVIDIA stock jumped 5.6% on March 31 alone after the company announced a $2 billion strategic investment in Marvell Technology.
Want more insights like this? Sign up for Editor Harsh Notariya’s Daily Newsletter here.
Broader market sentiment added fuel as hopes of de-escalation in the Iran conflict pushed equities higher, with the S&P 500 gaining and the Nasdaq climbing on the same day.
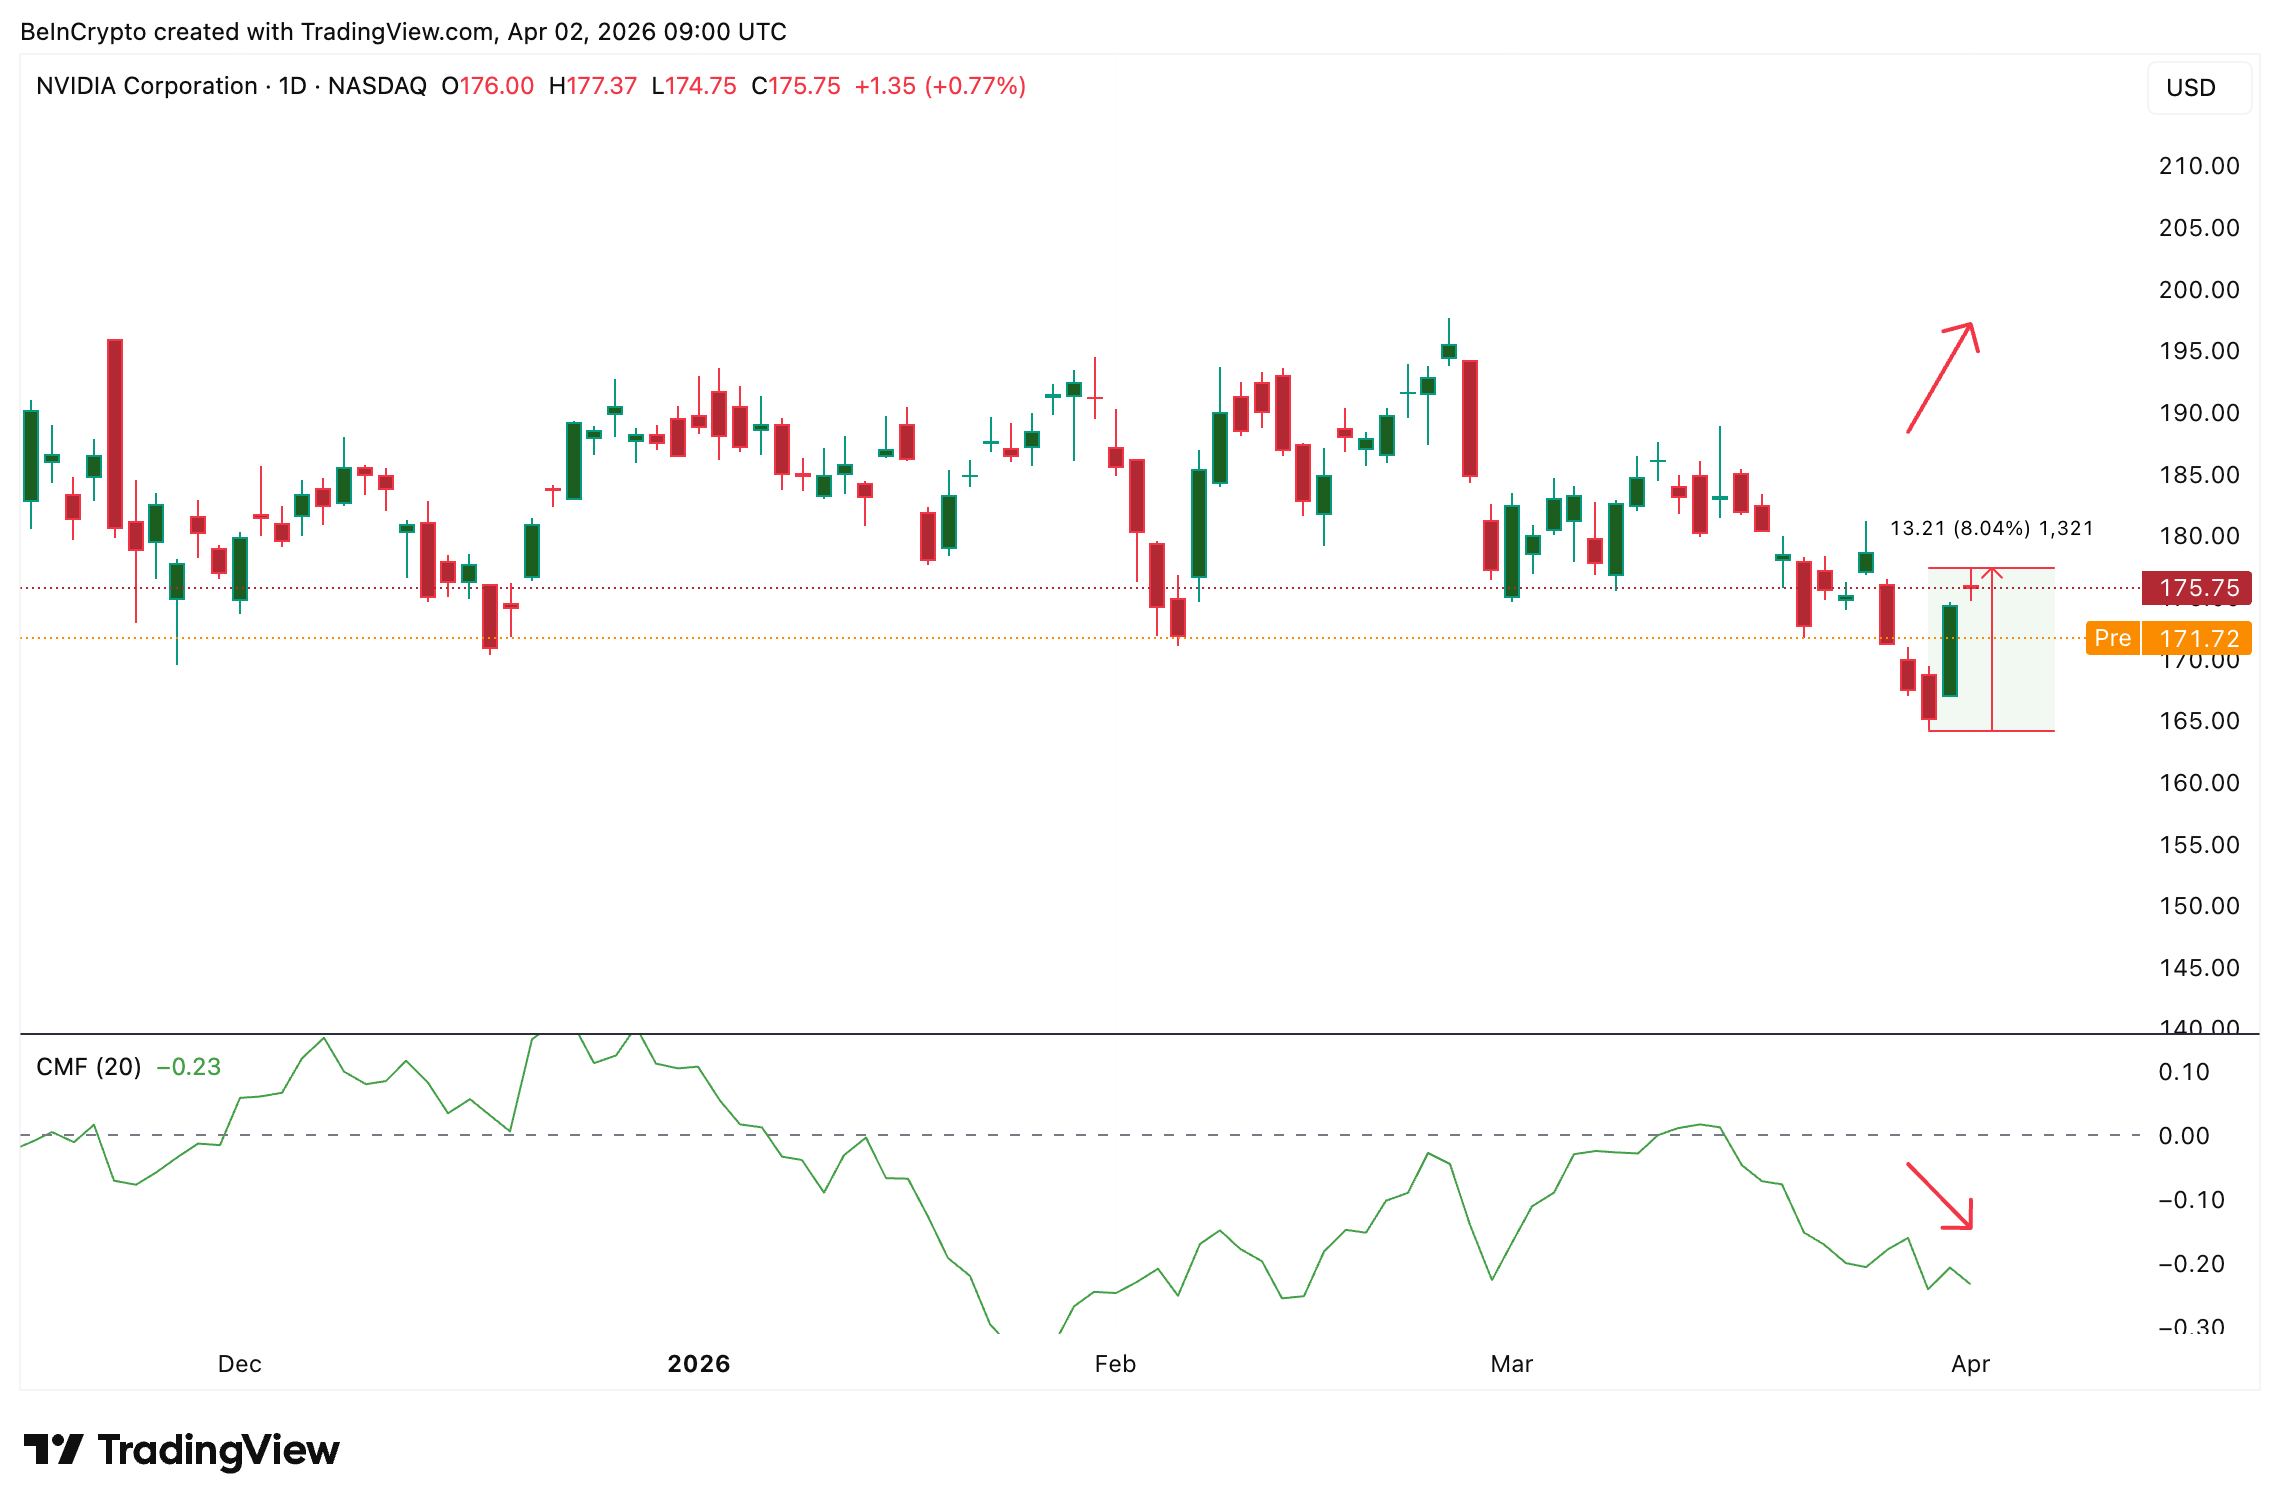
The chart that tracks this 8% move, however, reveals a problem underneath. Chaikin Money Flow (CMF), a proxy for institutional buying and selling pressure, diverged sharply from the price action. Between March 27 and April 1, while NVDA stock price trended higher, CMF trended lower, deepening further below the zero line to -0.23.
A rising price paired with falling CMF creates a bearish divergence, suggesting the rally was driven by short covering or retail momentum rather than sustained institutional accumulation.
The macro backdrop explains why institutions stayed on the sidelines. Over the last 50 trading sessions, the S&P 500 ETF (SPY) and the United States Oil ETF (USO) have moved in opposite directions in 38 sessions. That 76% inverse correlation rate is the highest in at least 20 years. During this window, crude oil surged over 72% while the S&P 500 declined 4%.
The economic logic hits NVIDIA shares harder than most. Rising oil feeds directly into consumer price inflation through transport and logistics costs. Higher inflation makes the Federal Reserve less likely to cut rates, which pressures expensive growth stocks that depend on cheap capital and future earnings expectations.
A single $2 billion partnership cannot offset a macro force that has been reshaping equity flows for 50 consecutive sessions. The question then becomes whether the options market agrees with the skepticism.
Options Traders Used the Strength to Bet Against It
The NVDA put-call ratio confirms what CMF already flagged. On March 31, when the Marvell deal drove the strongest session of the rally, the put-call volume ratio sat at 0.67, meaning call activity dominated as traders chased the move higher. By April 1, the volume ratio had climbed to 0.77 as significantly more bearish bets entered the market.
The open interest ratio shifted in the same direction, slipping from 0.88 to 0.87. While the move appears small, the direction matters. A rising volume ratio combined with declining open interest suggests that long positions were being closed while new short positions were being opened.
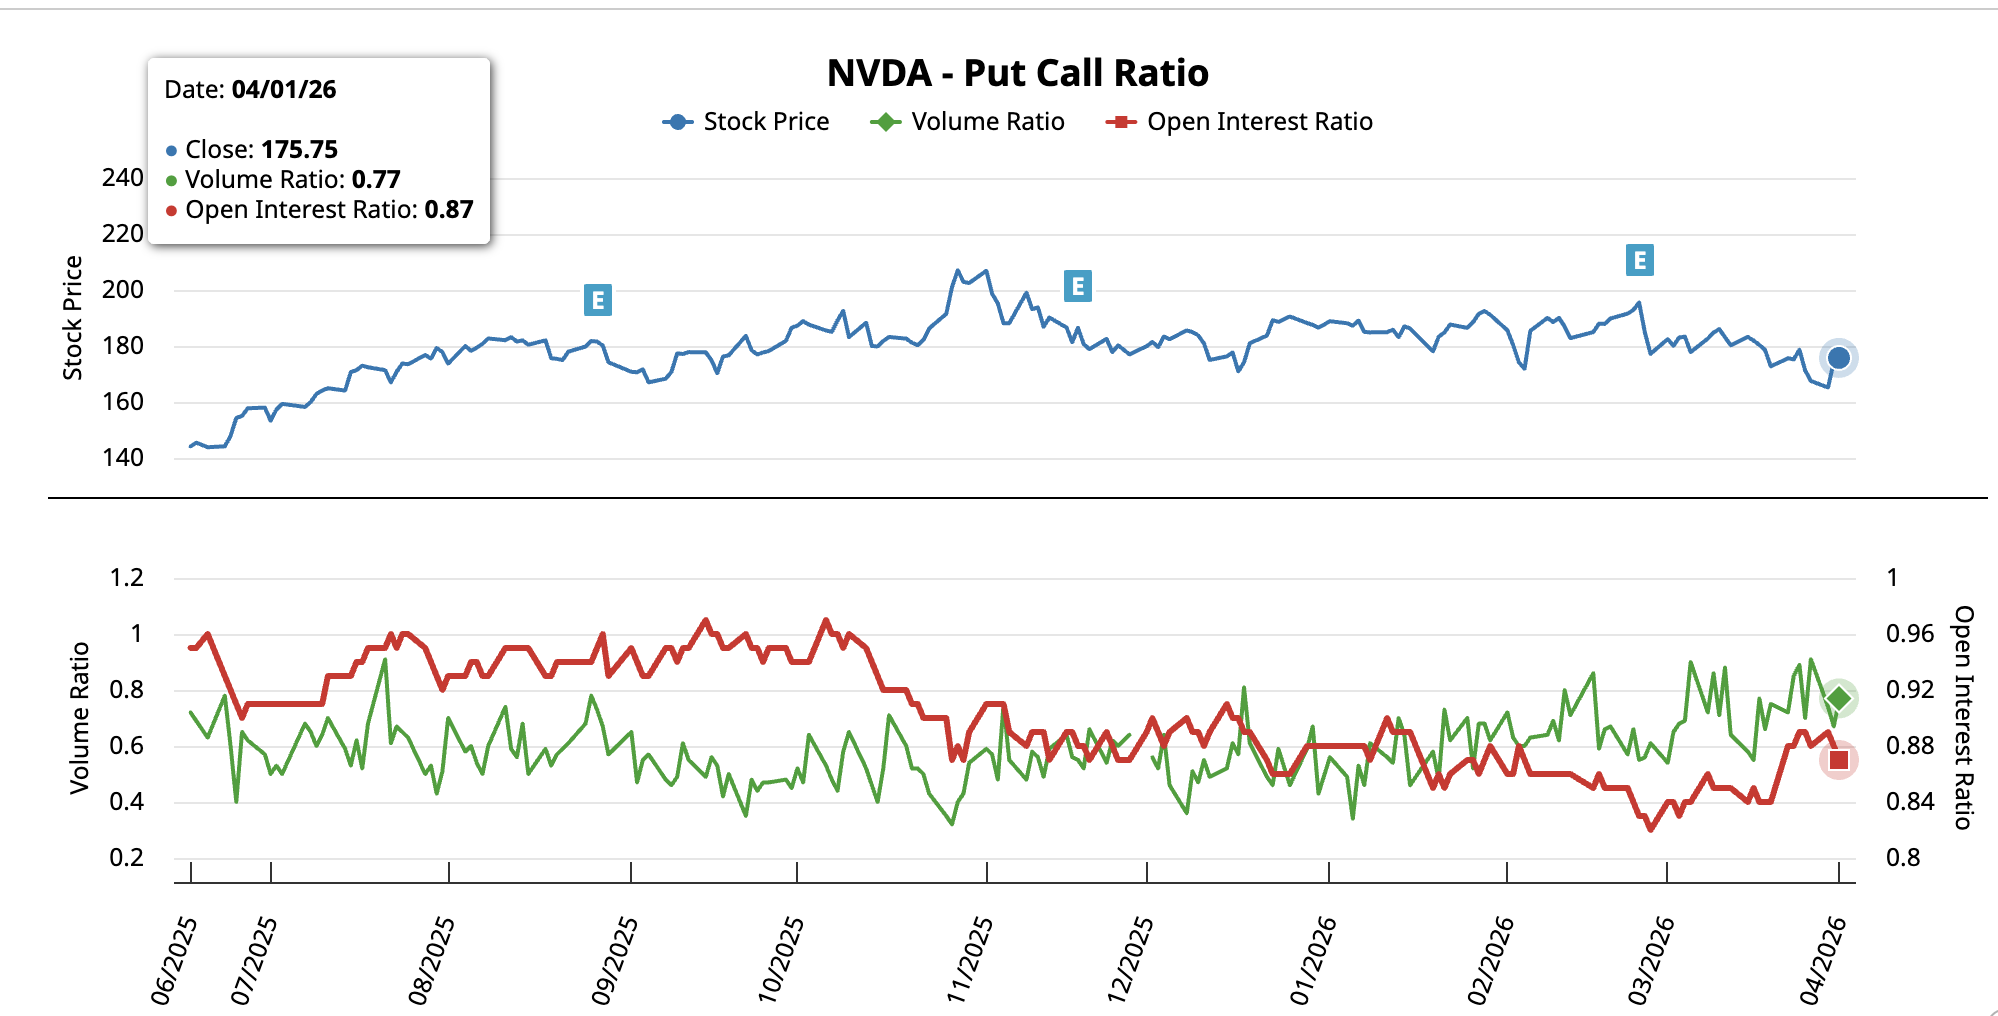
In practical terms, traders who had been positioned for upside took profits during the rally, while a new wave of participants used the elevated price to initiate downside bets.
That behavioral shift, happening within 24 hours of the rally’s peak session, is consistent with what the CMF divergence showed. Institutional capital did not back the 8% move, and now options traders are actively positioning against its continuation.
NVIDIA Stock Price Faces a Pattern With 15% Downside
The daily NVDA chart reveals a head and shoulders pattern forming since late 2025, a bearish reversal pattern. On April 1, NVIDIA stock price attempted to reclaim the 20-day Exponential Moving Average (EMA), a short-term trend indicator that gives greater weight to recent price action, at $176 but failed to close above it. That rejection adds technical validation to the right shoulder and aligns with the institutional skepticism identified in the previous sections.
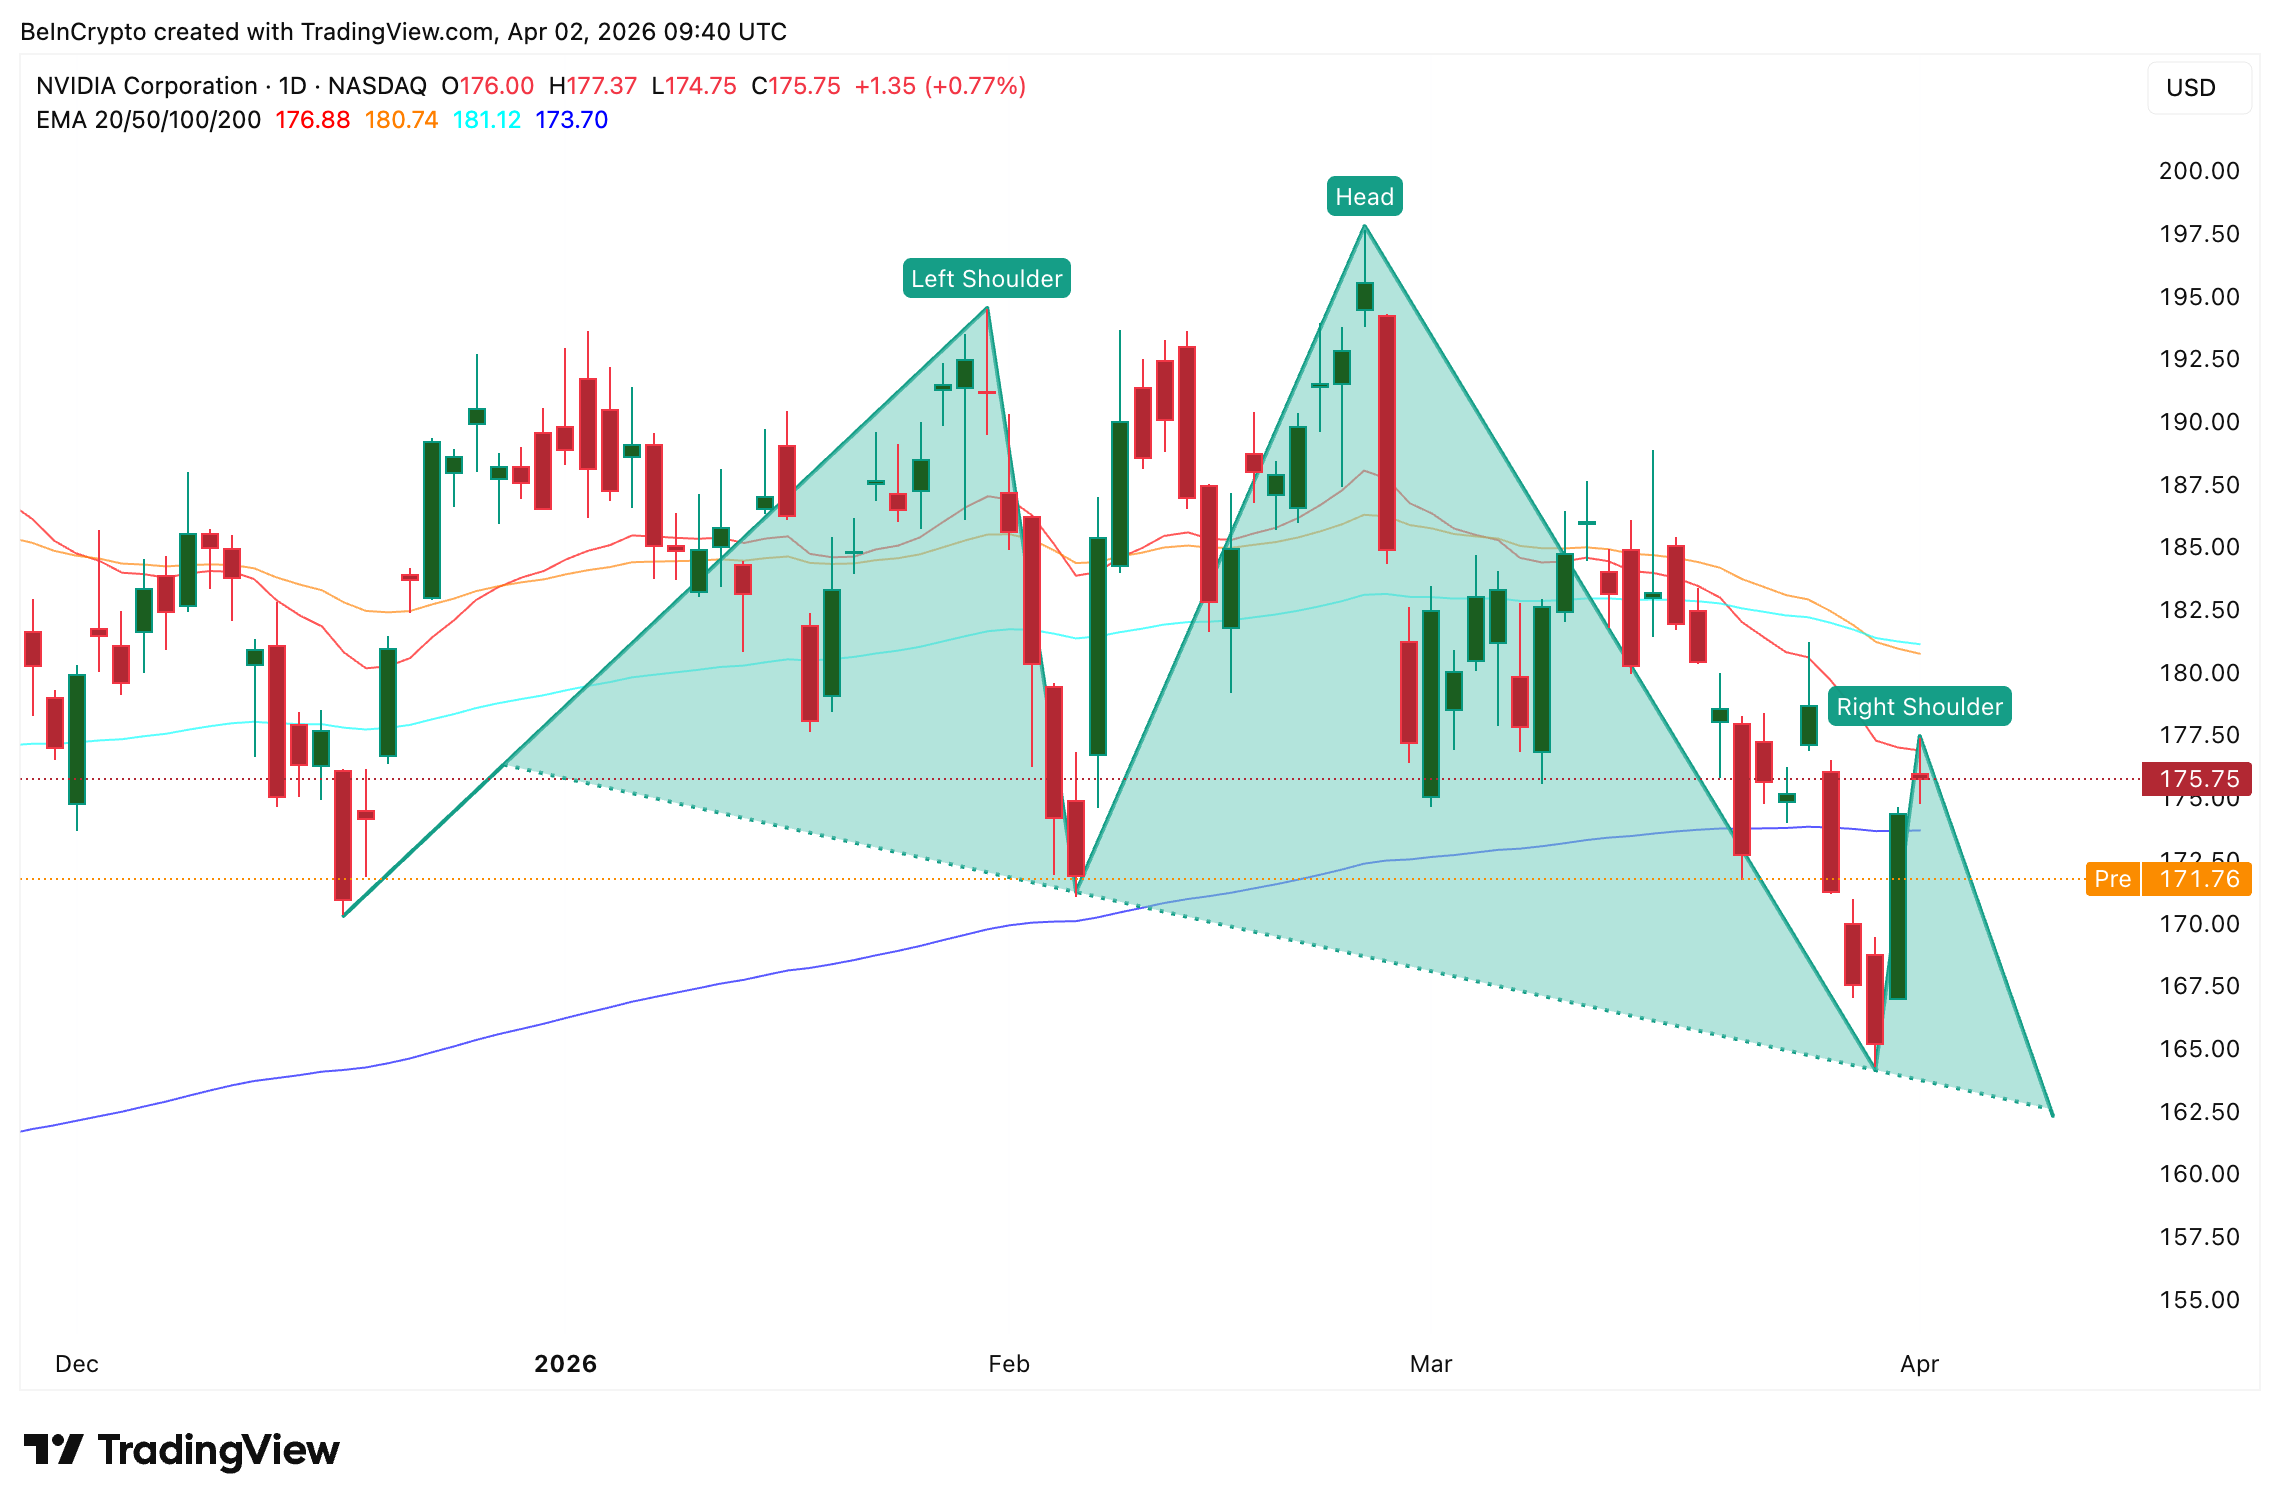
The 50-day EMA at $180 and the 100-day EMA at $181 sit just above, creating a dense resistance cluster. For the bearish thesis to fail, NVIDIA stock needs a clean daily close above $177 to reclaim the 20-day EMA. A push through the $180-$181 zone would weaken the right shoulder and shift momentum.
On the downside, losing $169, the 0.236 Fibonacci level, on a daily closing basis could accelerate selling toward $164. The $164 to $160 zone represents the critical support band. A close below $160 confirms the neckline break, which could then activate a measured move target of approximately 15% downside to $138.
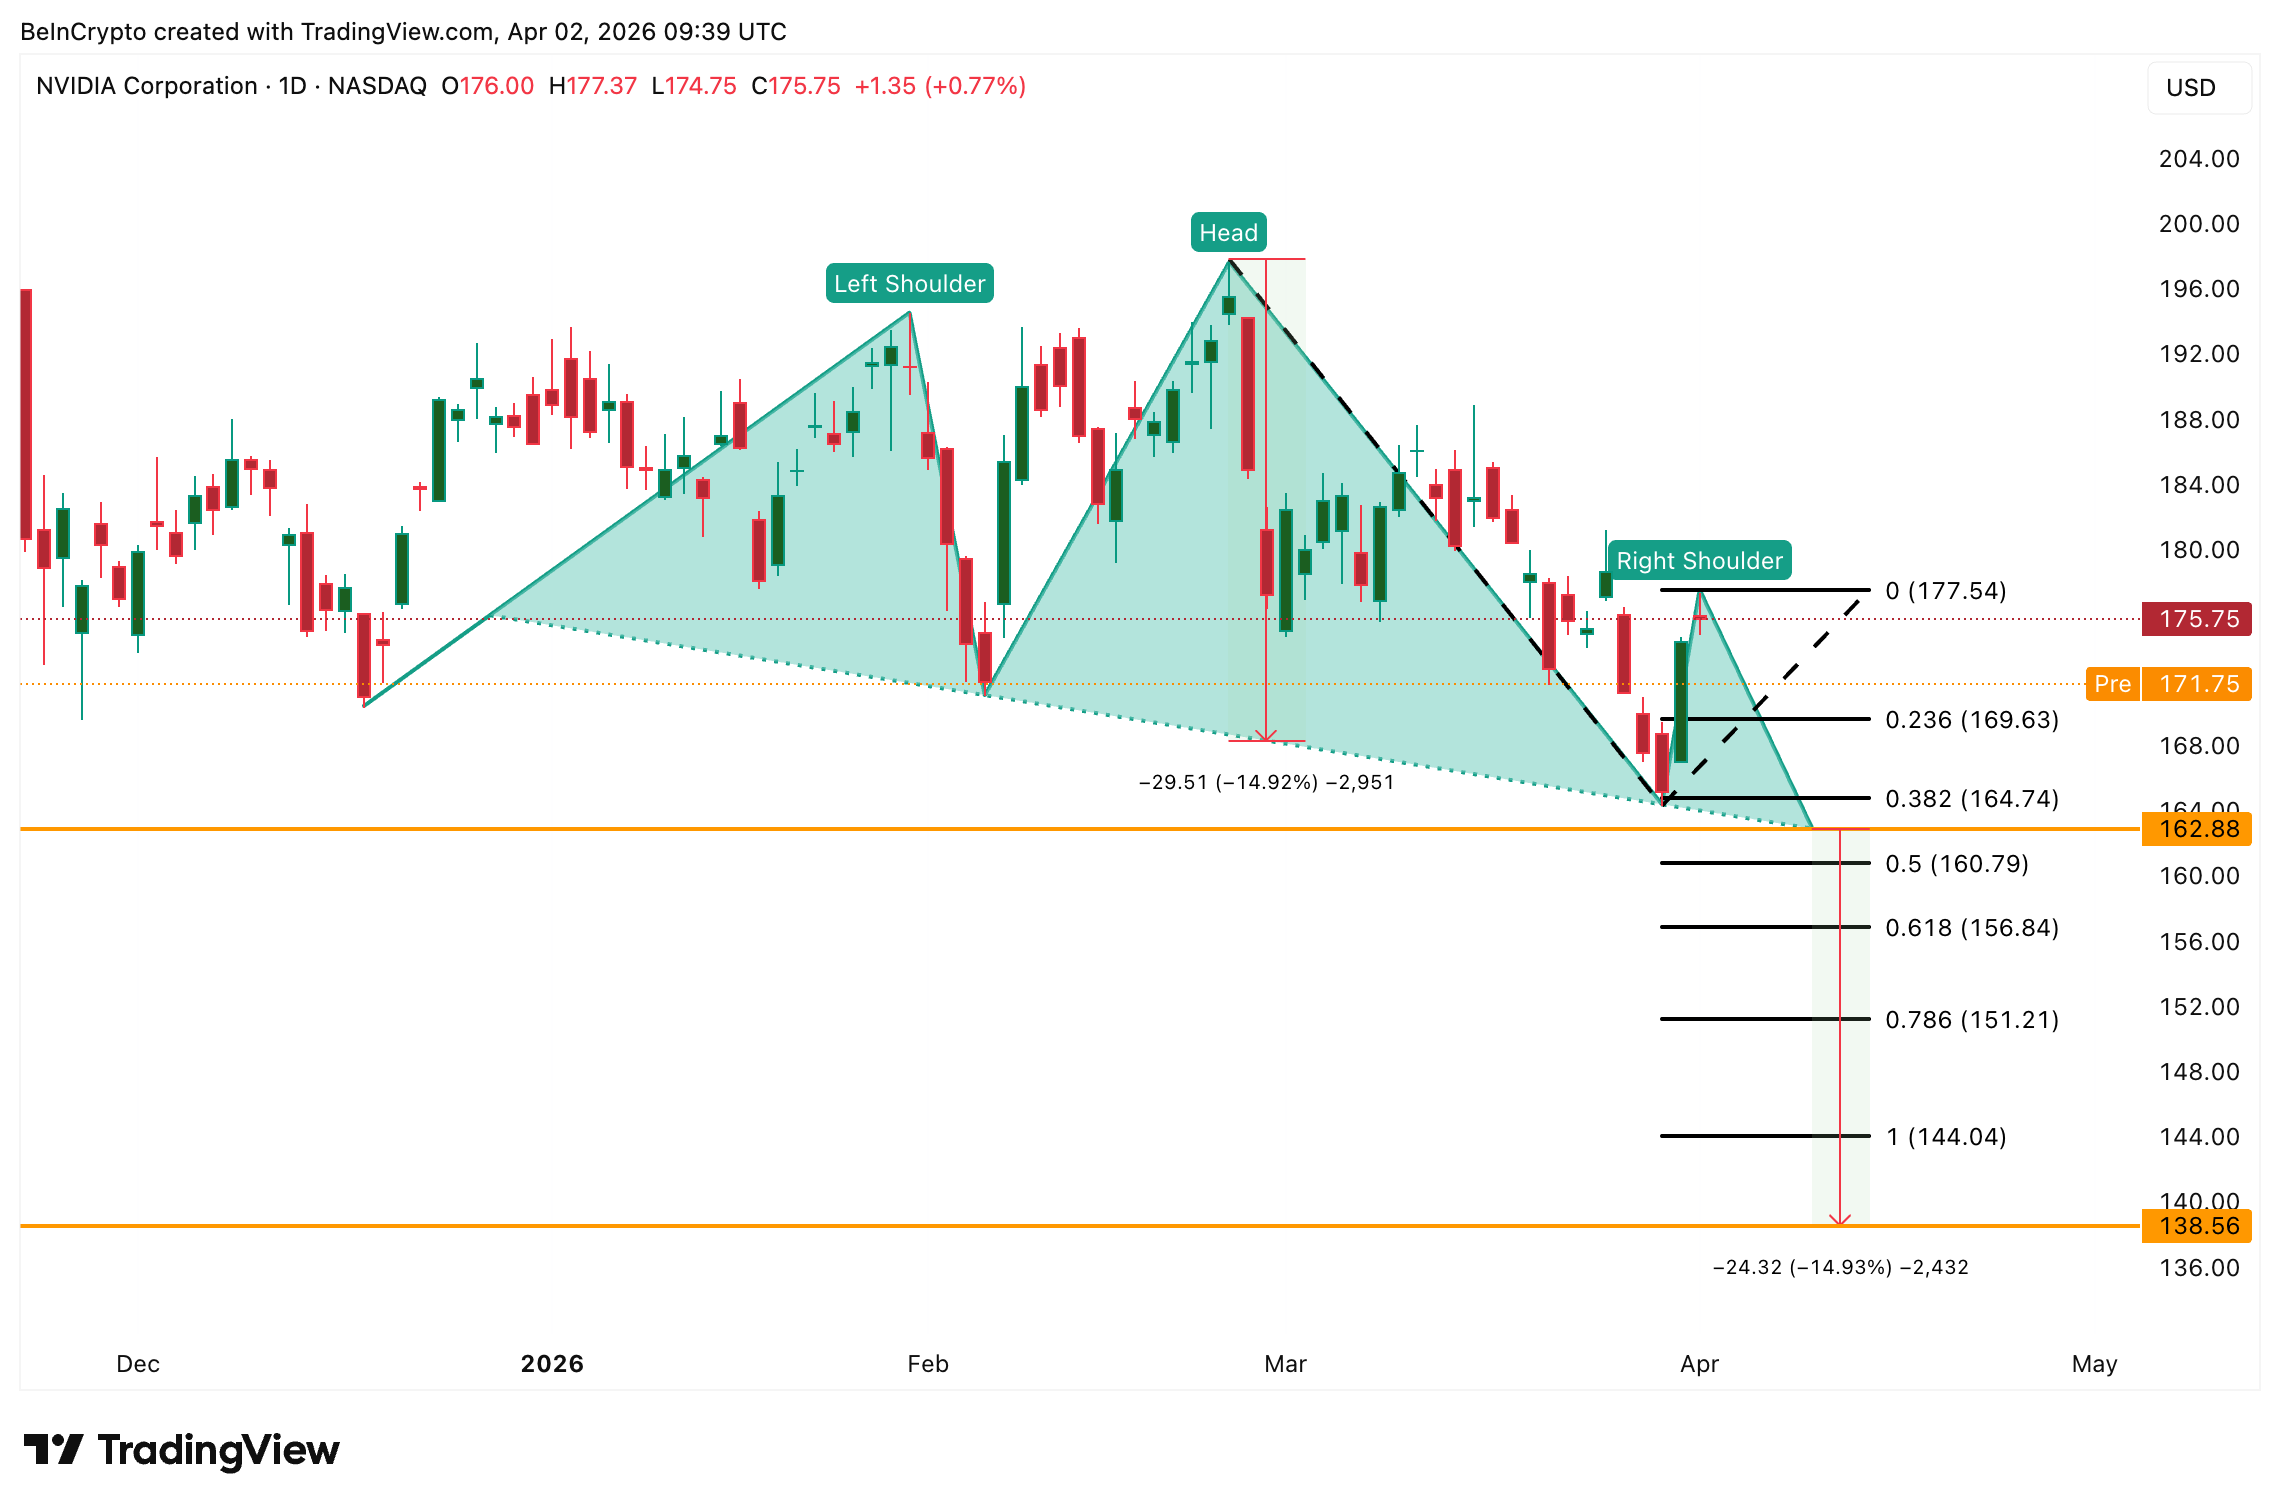
Head and shoulders patterns do not always resolve in the expected direction. De-escalation in the Iran conflict remains the most likely catalyst for invalidation. If oil prices pull back, the inverse grip on equities loosens, inflation expectations ease, and rate-sensitive growth stocks like NVIDIA benefit disproportionately. The $164 to $160 zone could act as a floor if diplomatic progress arrives.
* The content presented above, whether from a third party or not, is considered as general advice only. This article should not be construed as containing investment advice, investment recommendations, an offer of or solicitation for any transactions in financial instruments.


