




Ethereum Price Forecast: ETH Falls Below $2,100 as US Inflation Exceeds Expectations, $2,000 Mark Faces Test
TradingKey - As of the Asian trading session on Wednesday (November 11), Ethereum (ETH) extended its recent decline, with the latest price fluctuating around $2,060. Earlier, Ethereum fell 3.84% on Tuesday, touching an intraday low of $2,006. As the latest U.S. inflation data came in higher than expected, driving the U.S. dollar and Treasury yields higher, while the cryptocurrency market continued to see capital outflows, Ethereum faces significant short-term corrective pressure.
US Inflation Tops Expectations, Fueling Fed Hike Bets as ETH Liquidity Faces Pressure
Ethereum has continued to decline recently, primarily driven by a combination of shifting expectations for U.S. monetary policy, declining risk appetite across the cryptocurrency market, and ETF capital outflows.
On the macroeconomic front, U.S. October CPI data exceeded market expectations. Coupled with recent hawkish signals from Federal Reserve officials, the market has further raised expectations for a year-end interest rate hike. According to CME FedWatch data, the probability of a 25-basis-point rate hike by the Fed in December has climbed to 91.9%, up from approximately 84% the previous day. Meanwhile, the 10-year U.S. Treasury yield rose to 4.996%, pushing the U.S. Dollar Index toward 102.22, near its highest level since October 28.
A stronger U.S. dollar and rising Treasury yields suggest that financial market liquidity conditions could tighten further, putting pressure on risk assets such as Ethereum. Higher interest rates enhance the relative appeal of holding U.S. dollar assets while dampening investors' willingness to allocate to highly volatile crypto assets. Bitcoin (BTC) and Ethereum are both currently trading near three-month lows, reflecting broad-based pressure across the cryptocurrency market.
In terms of capital flows, U.S. spot Ethereum ETFs have also experienced noticeable outflows recently. According to CoinGlass data, U.S. spot Ethereum ETFs recorded net outflows of approximately $184.6 million on November 9, signaling weakening institutional demand. Continued ETF outflows could increase market selling pressure, while also reflecting that some investors are reducing their allocations to Ethereum-related assets.
In addition, deleveraging across the derivatives market has exacerbated price volatility. CoinGlass data shows that liquidations in the Ethereum futures market totaled approximately $258 million over the past 24 hours, with long liquidations accounting for roughly $194 million. The concentrated liquidation of long positions further amplified Ethereum's decline.
Ethereum Price Technical Analysis
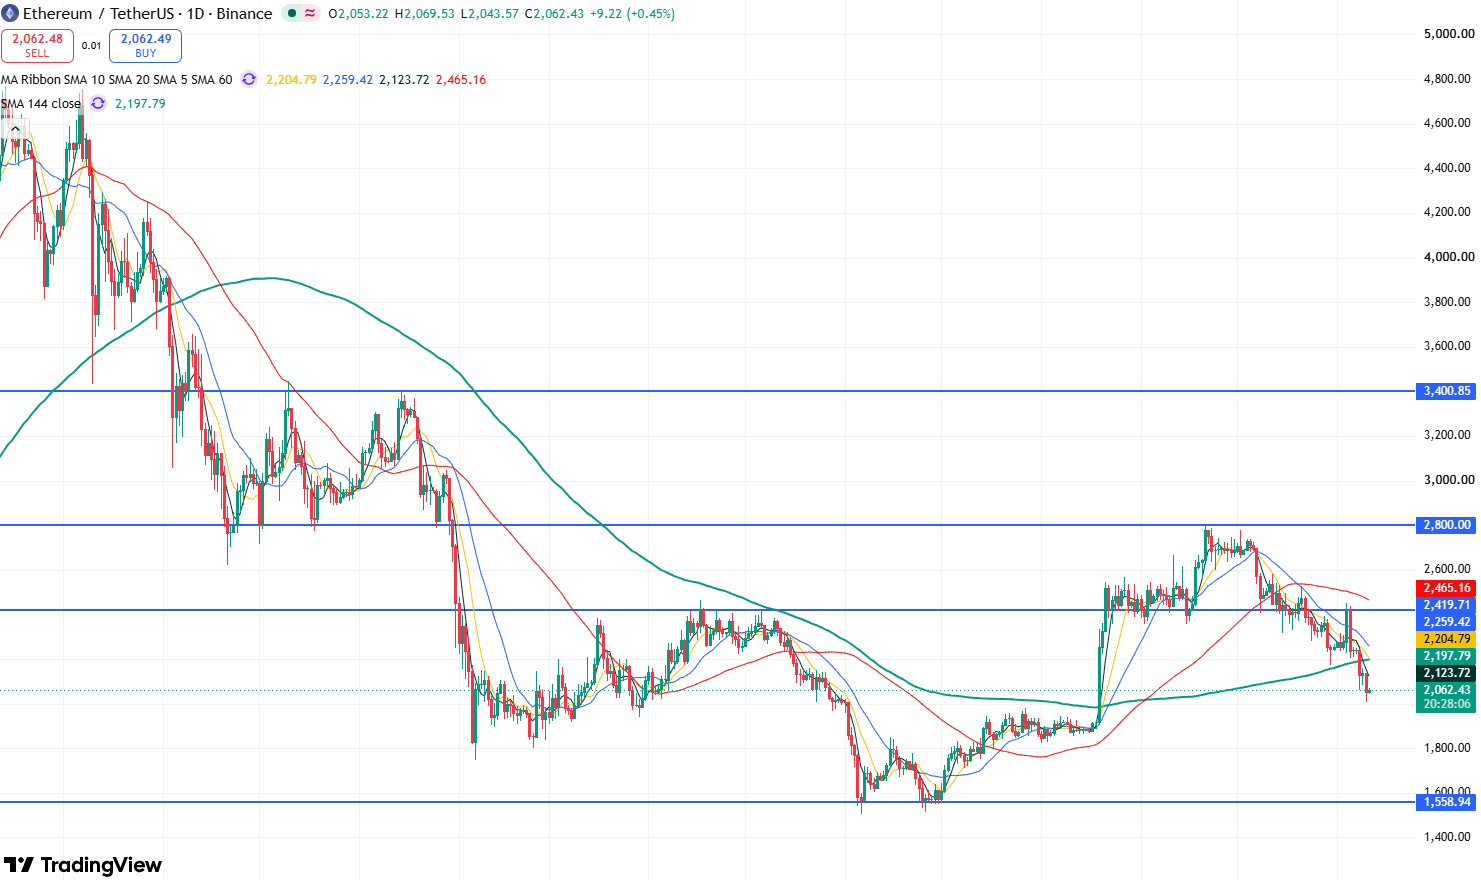
Ethereum daily price chart, Source: TradingView
Judging from Ethereum's daily chart, it has recently formed a relatively distinct downward structure. After rebounding to $2,800 in September, Ethereum came under pressure and continued to decline, successively breaking below support levels at $2,500, $2,400, and $2,200, and is currently nearing the $2,000 round-number level.
In terms of technical indicators, the Relative Strength Index (RSI) stands at 30.77, approaching oversold territory; the MACD is below the zero line and beneath its signal line, indicating that downward momentum remains strong. Meanwhile, Ethereum's recent price action has been consistently capped by the 5-day and 10-day moving averages, leaving the short-term structure distinctly bearish.
Currently, Ethereum may extend its decline in the short term, with the primary downside target continuing to test the $2,000 psychological mark. If this level fails to hold, Ethereum will test support near $1,850; if the decline continues, it could fall further toward around $1,550.
On the upside, the primary resistance zone to watch is between $2,080 and $2,100. If Ethereum can break out and hold above $2,100, it may test resistance near $2,150; a further breakthrough above this level would open up room for a rebound toward $2,200.
Recommended Articles


