


Bitcoin’s 40% Correction Could Still Get Worse: 4 Reasons Why
Bitcoin (BTC) price is trading near $68,500 after correcting roughly 40% from the mid-January high of $98,000, and the rebound since February’s $60,000 low is showing signs of exhaustion.
The ascending channel that formed after the crash may look like a recovery. However, a hidden RSI divergence, declining hodler conviction, minimized short-term holder losses, and a hopeful liquidation map all point in the same direction.
Hidden Divergence Flashes Inside an Ascending Channel
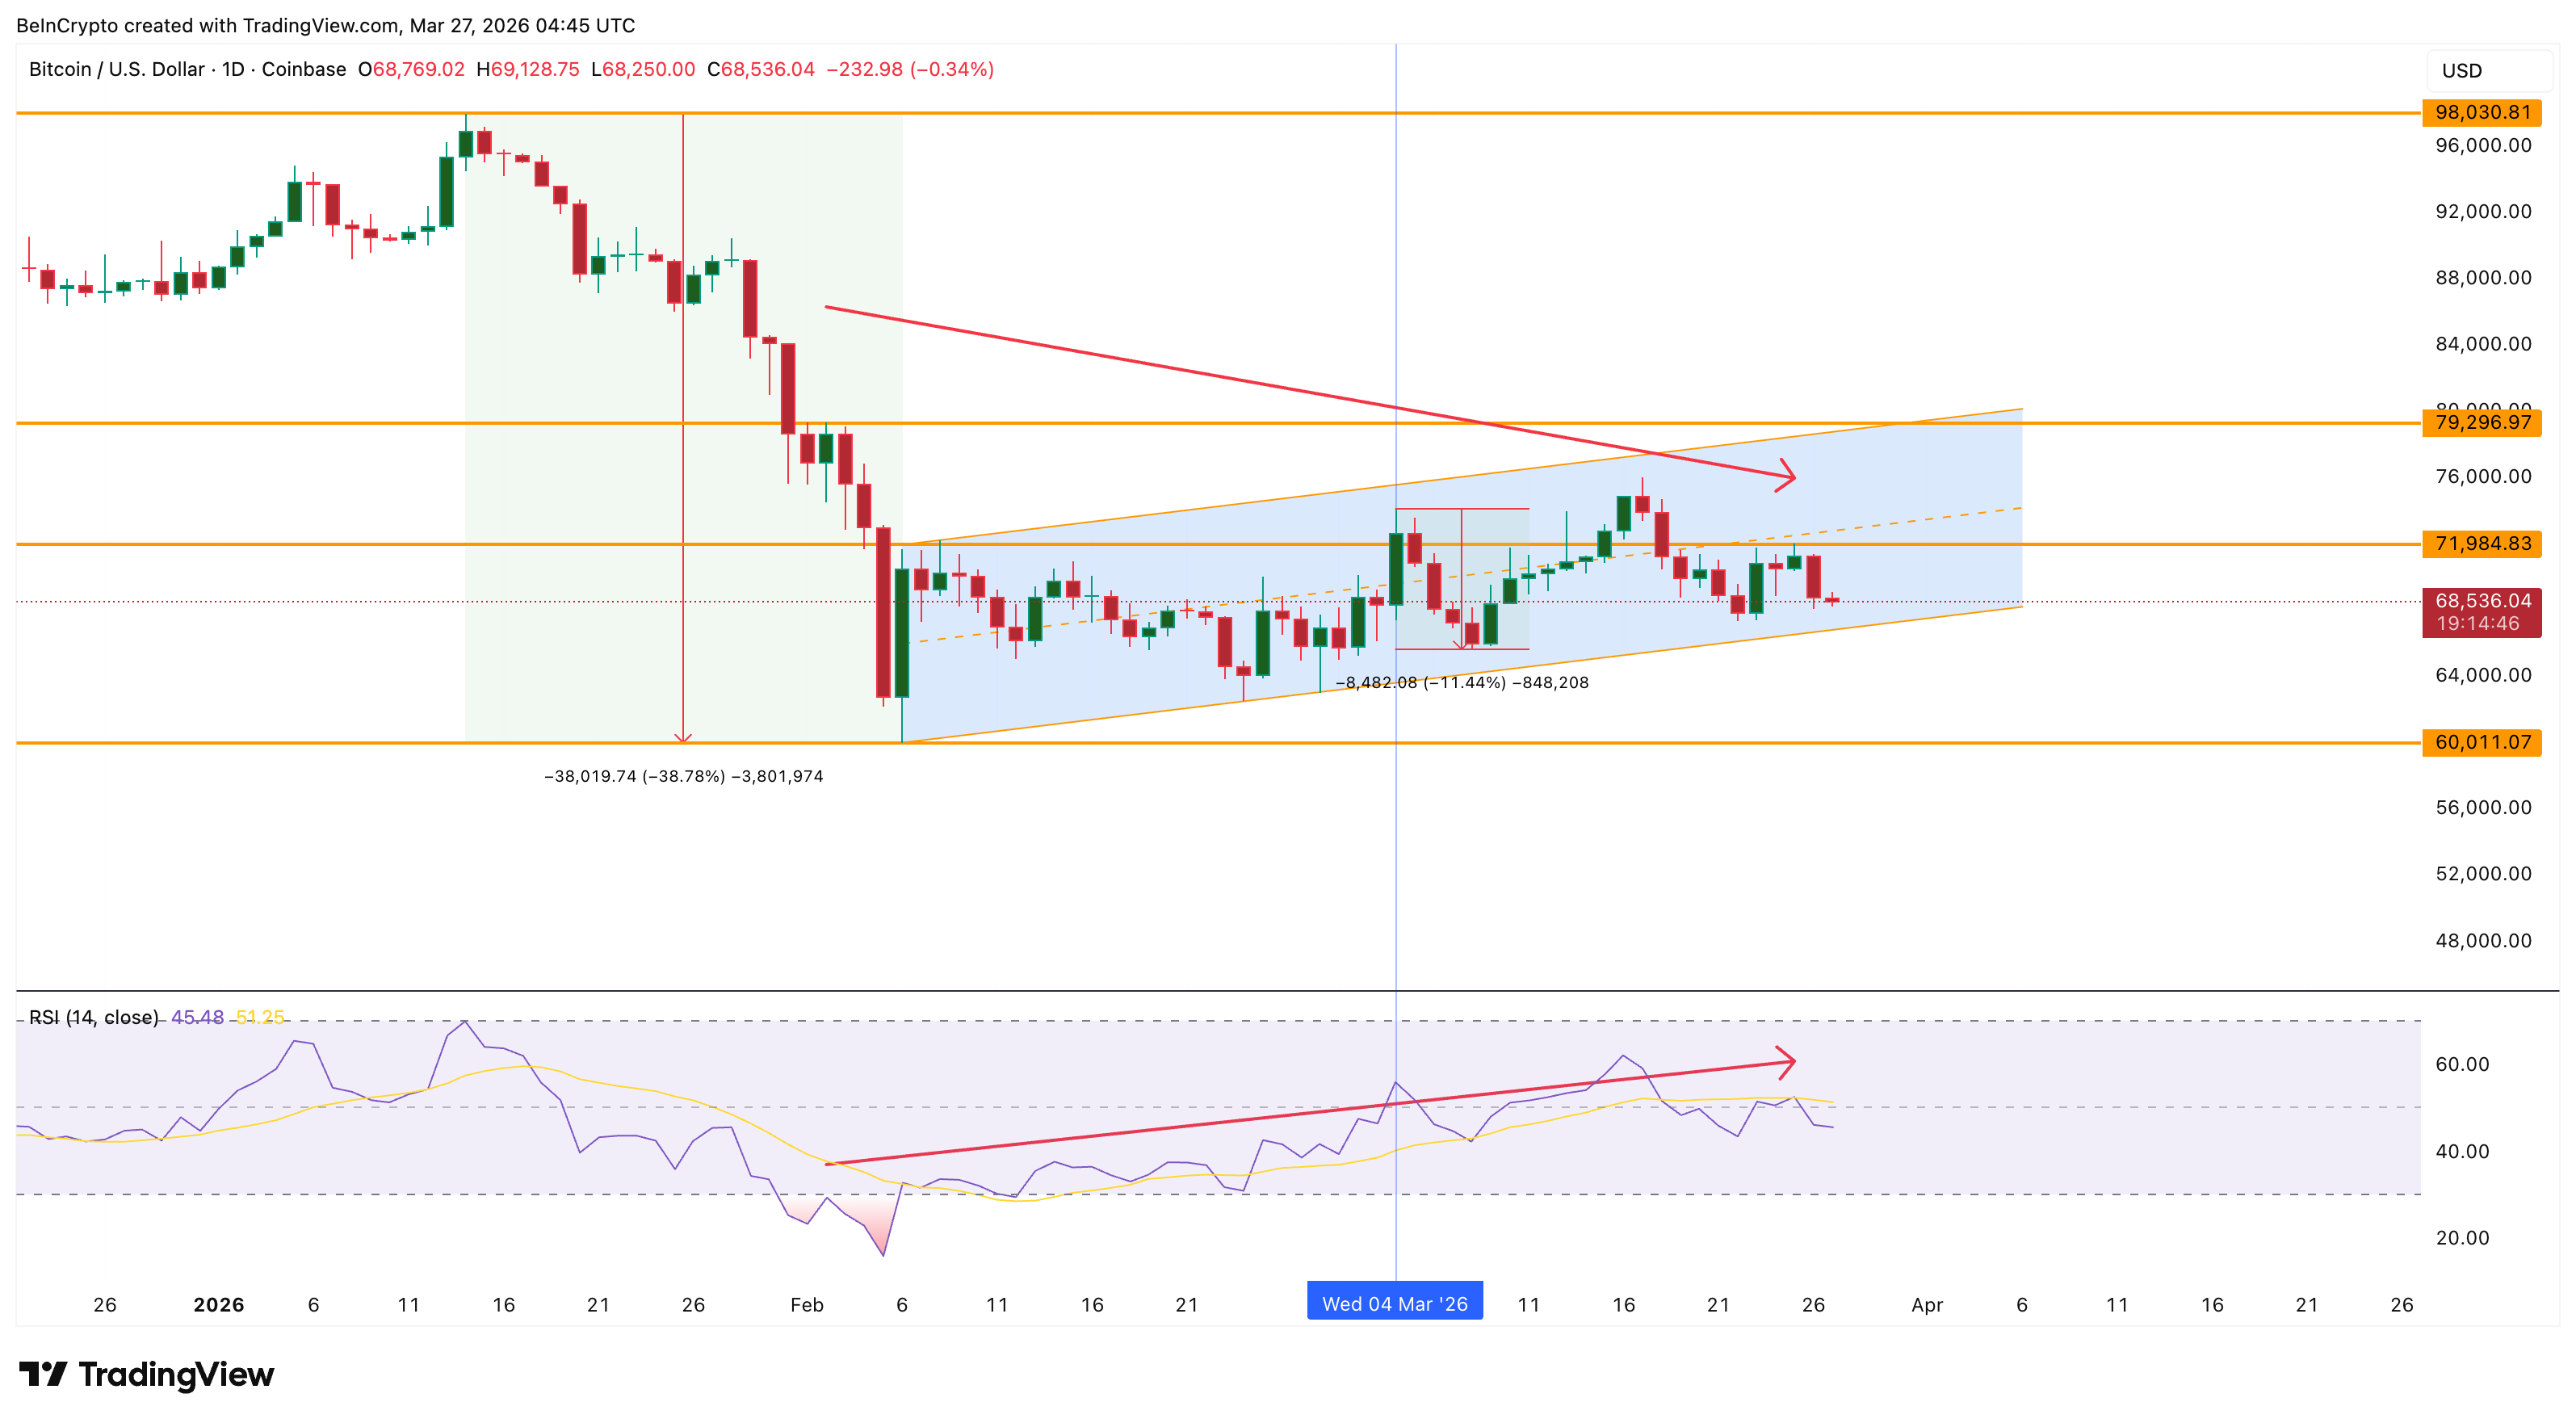
Bitcoin price has been trading inside an ascending parallel channel on the daily chart since early February, a pattern that formed after the near 40% decline from $98,000 to the $60,000 level. Ascending channels that develop after steep corrections often function as continuation patterns, which means the consolidation phase resolves lower rather than higher.
The Relative Strength Index (RSI), a momentum oscillator, has formed a hidden bearish divergence on the daily timeframe. Between Feb. 2 and March 25, the price made a lower high while the RSI made a higher high. Hidden bearish divergence signals that the dominant trend, in this case the broader downtrend, is likely to resume despite the apparent recovery.
A similar divergence formed between Feb. 2 and March 4. After that signal was confirmed, the BTC price corrected by 11% over the following sessions. The current divergence was confirmed on March 25, and Bitcoin has already dropped since then.
 RSI Hidden Bearish Divergence: TradingView
Want more token insights like this? Sign up for Editor Harsh Notariya’s Daily Crypto Newsletter here.
The channel’s lower trendline isn’t far. A daily close below that level would break the ascending structure and validate the bearish thesis. However, the RSI signal alone does not confirm whether this pullback has the depth to reach the channel floor. On-chain conviction data provides that context.
Conviction Is Fading While Short-Term Losses Stay Shallow
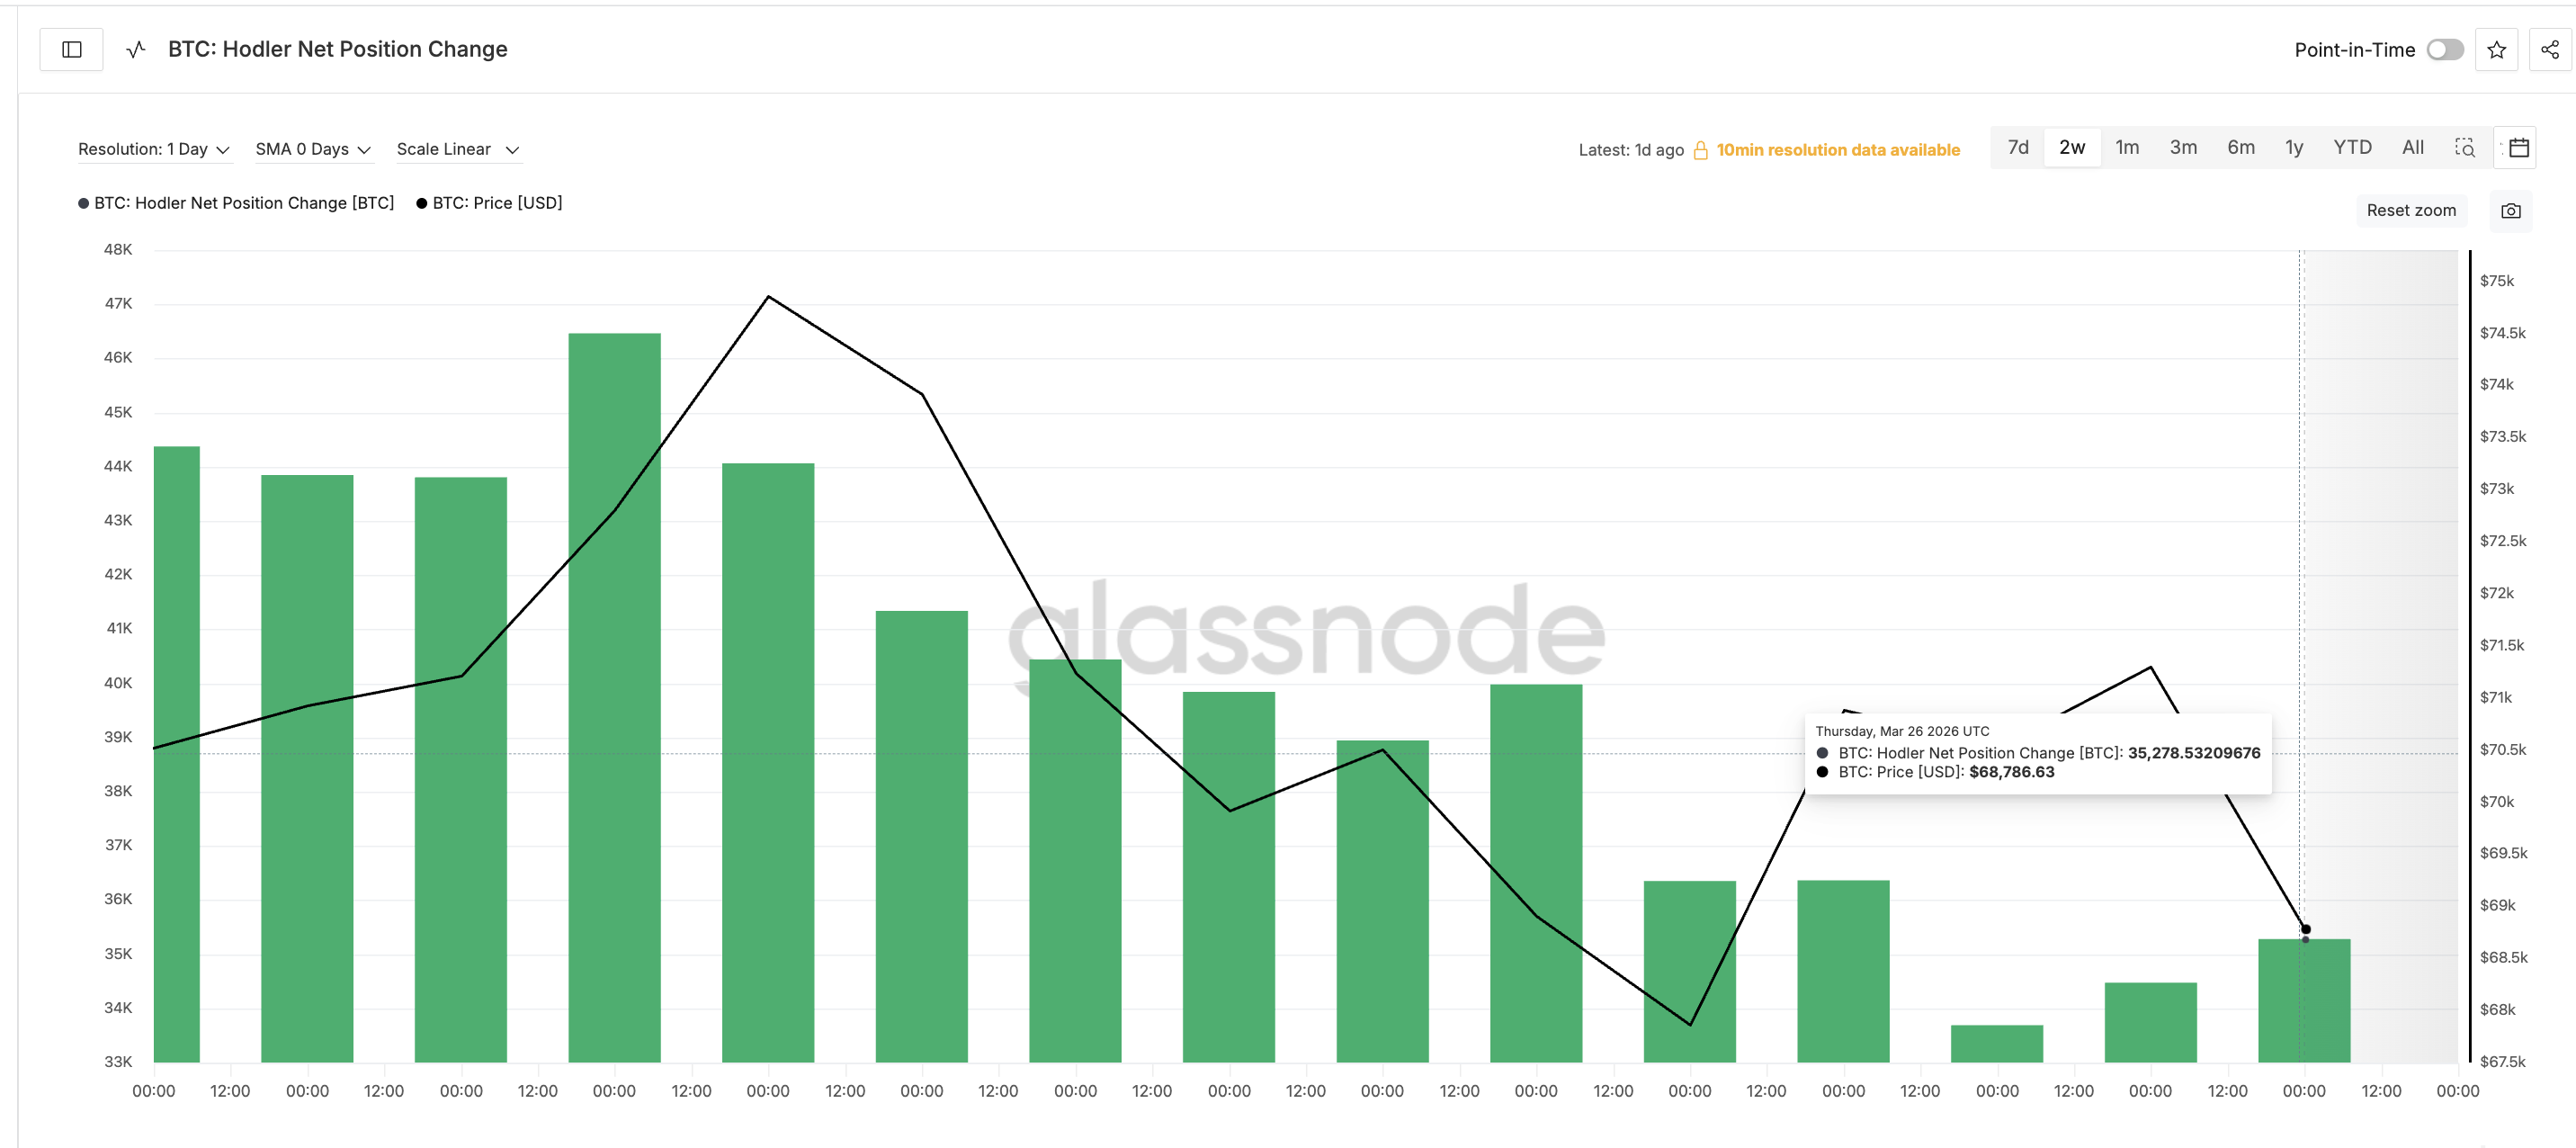
The Bitcoin hodler net position change, a Glassnode metric that tracks the 30-day rolling accumulation by wallets holding BTC for more than 155 days, peaked at 46,462 BTC on March 15. By March 26, that figure had dropped to 35,278 BTC, a decline of roughly 24%.
While the number has recovered slightly since March 24, the broader trend since mid-March is downward. These mid-term holders, often considered the conviction backbone of the market, are reducing their accumulation rate even as Bitcoin trades inside the ascending channel. That behavior suggests they are not convinced the rebound represents a genuine upswing potential.
 BTC Hodler Net Position Change: Glassnode
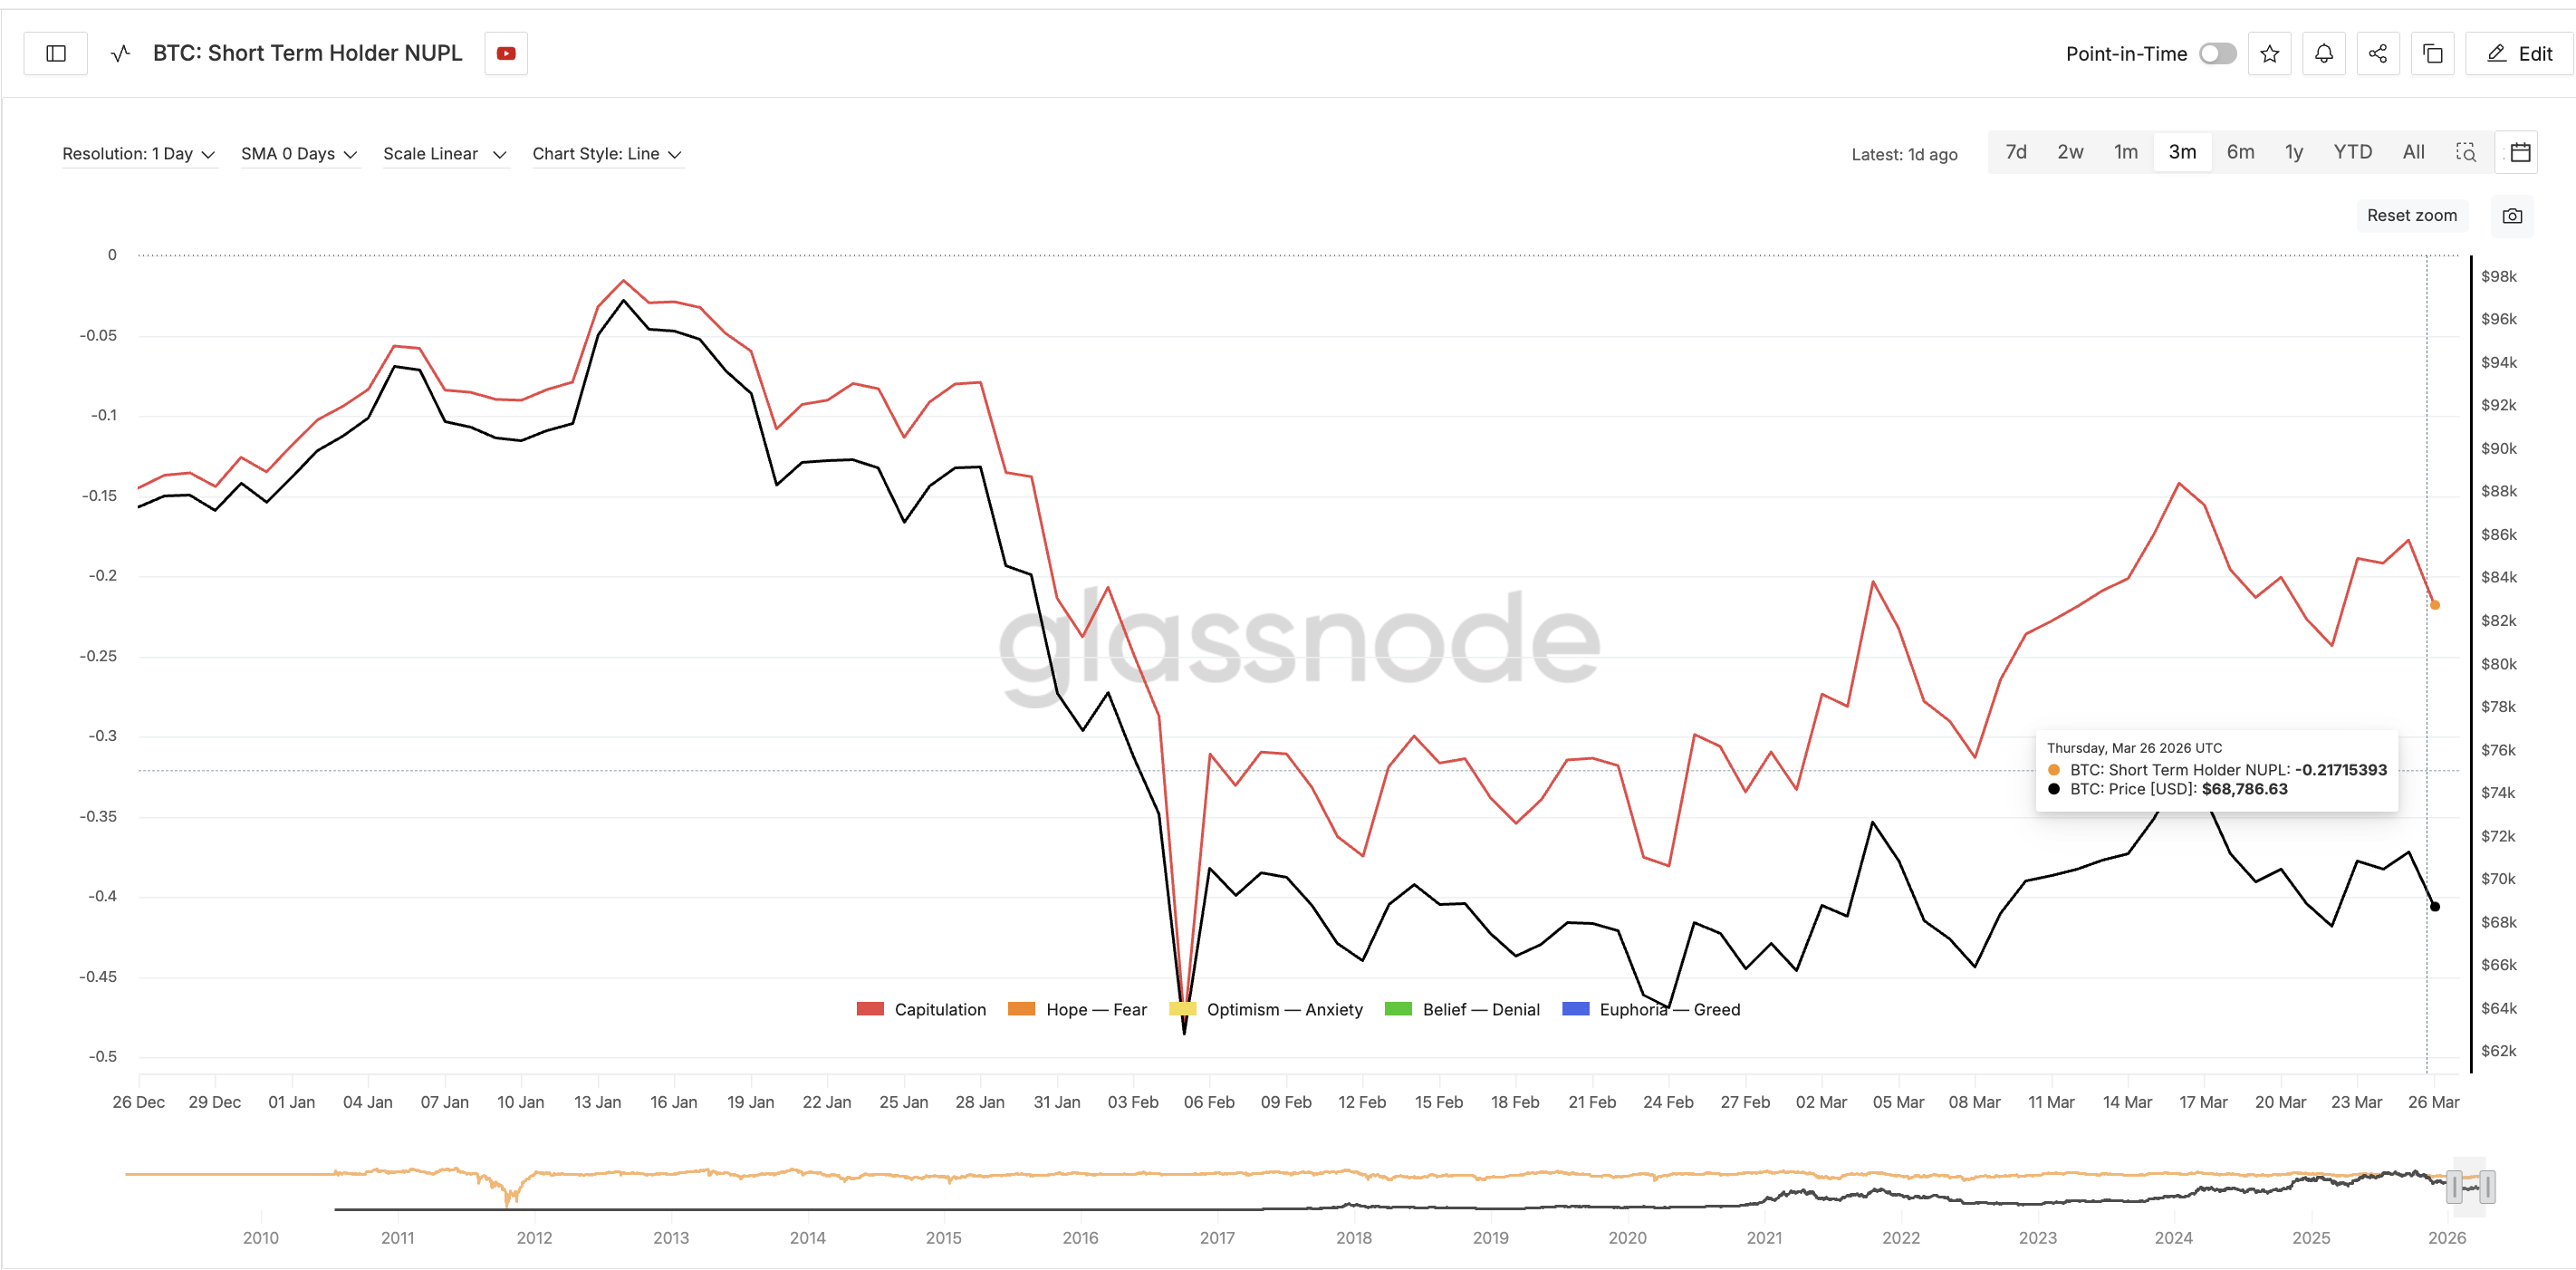
Short-term holder behavior adds another layer of risk. The short-term holder net unrealized profit/loss (NUPL), an indicator that measures aggregate profitability for wallets holding BTC for fewer than 155 days, currently reads -0.21. That places it firmly in the capitulation zone.
However, when Bitcoin hit $62,800 in early February, short-term holder NUPL dropped to -0.47, far deeper into capitulation. The current reading of -0.21, despite prices being only modestly higher at $68,500, means short-term holders are sitting on significantly fewer losses than they were during the February bottom. If the hodler conviction continues to weaken and the channel breaks, these holders could interpret the fading support as a cue to sell and accelerate the decline.
 BTC Short Term Holder NUPL: Glassnode
The on-chain data reveals a market where conviction is eroding quietly. The derivatives market shows whether traders have positioned for that scenario or remain exposed to the wrong side.
Bitcoin Price Faces a Long Liquidation Wall at $64,000
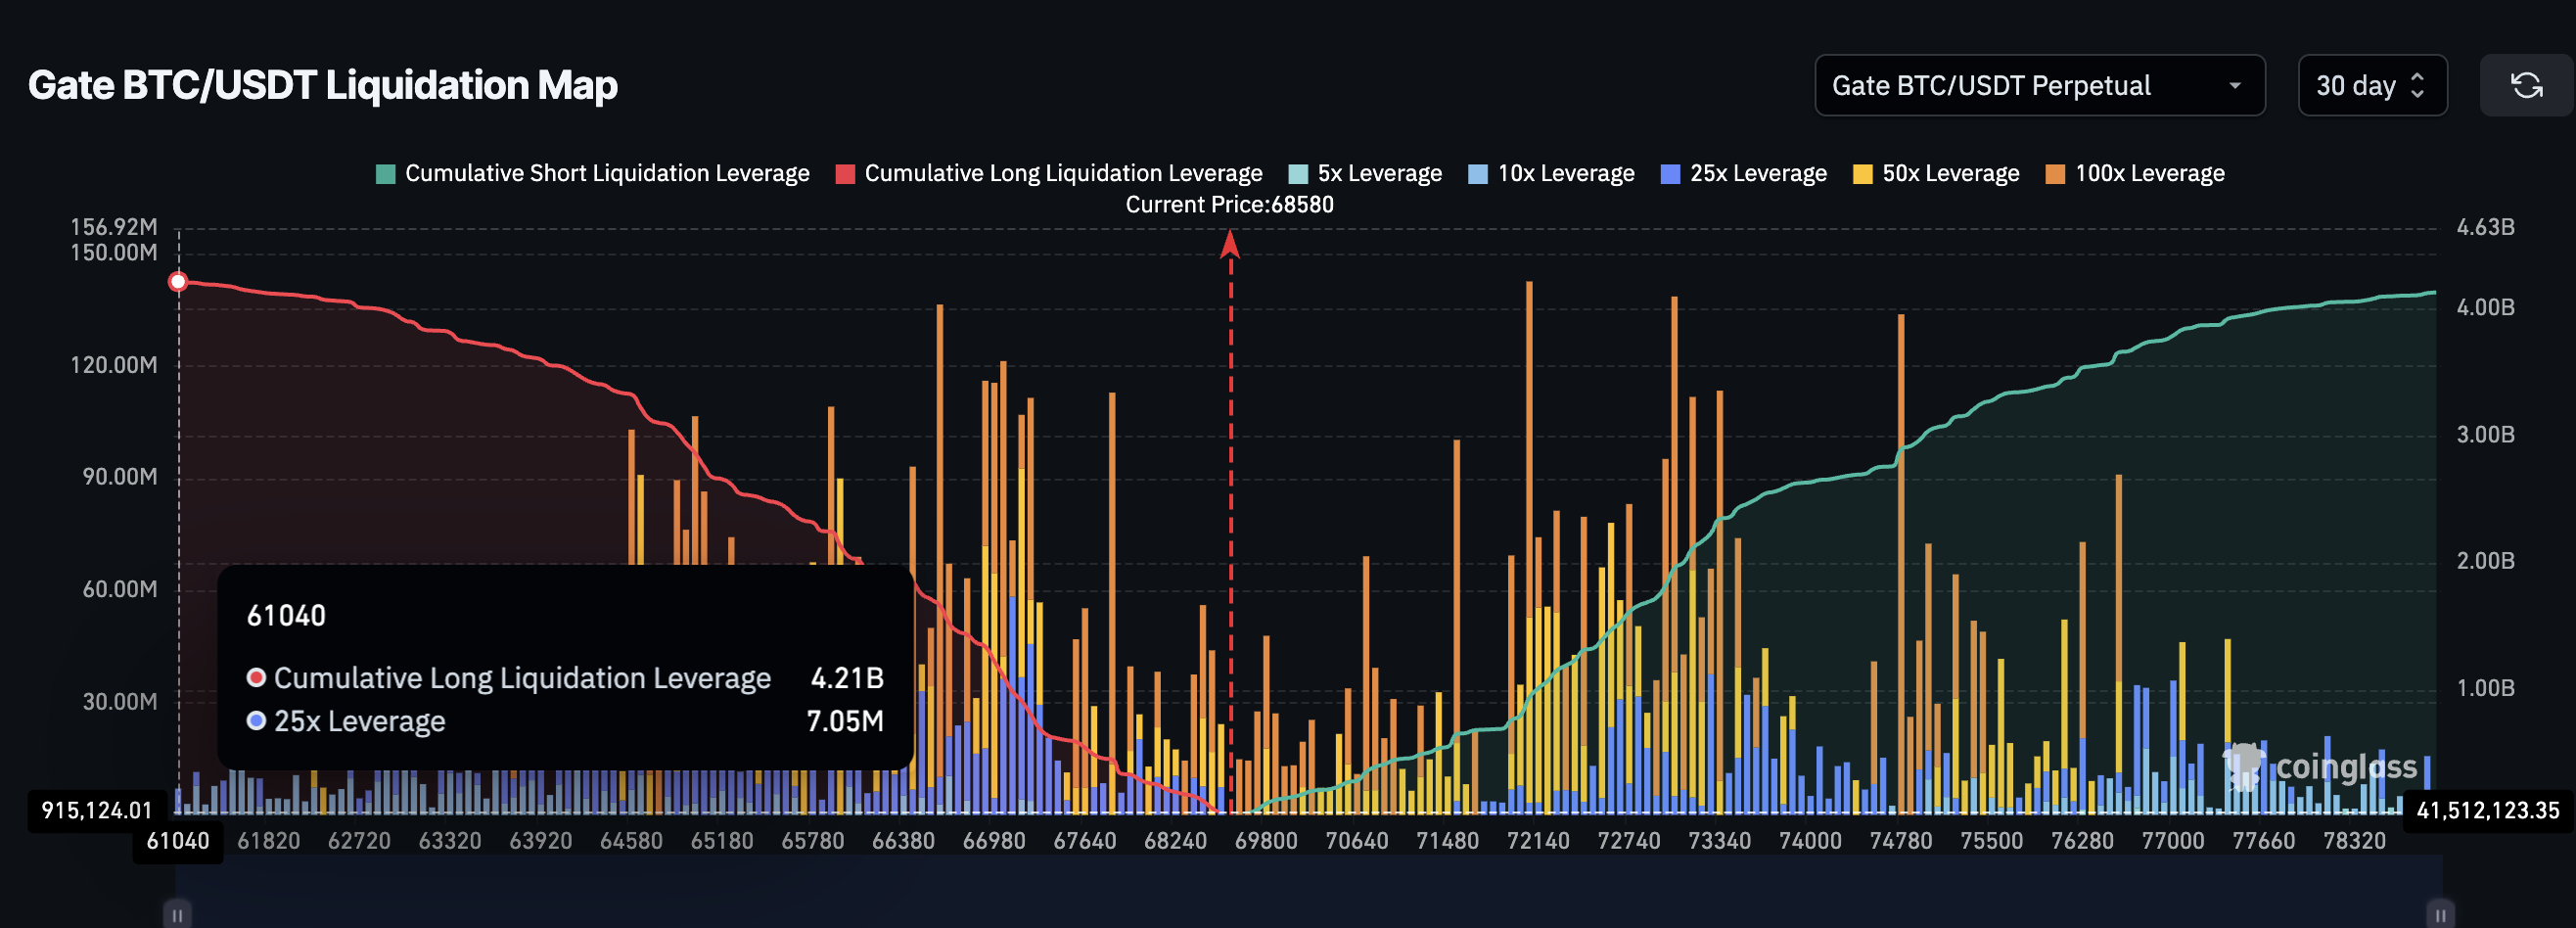
The Gate BTC/USDT perpetual liquidation map for 30-day active positions shows a market that is still quite hopeful. Cumulative long liquidation leverage stands at $4.21 billion, compared to $4.13 billion in short liquidation leverage. While the setup looks balanced, the massive long leverage in a volatile market poses several risks, making it the fourth reason a deeper slide is expected.
Despite the near 40% correction and the ongoing pullback, the majority of leveraged positions remain on the bullish side.
 BTC Liquidation Map: Coinglass
The densest cluster of long liquidations sits at $64,100, where cumulative long leverage reaches $3.55 billion. That means roughly 84% of all outstanding long liquidation leverage would be triggered at or above that single price level.
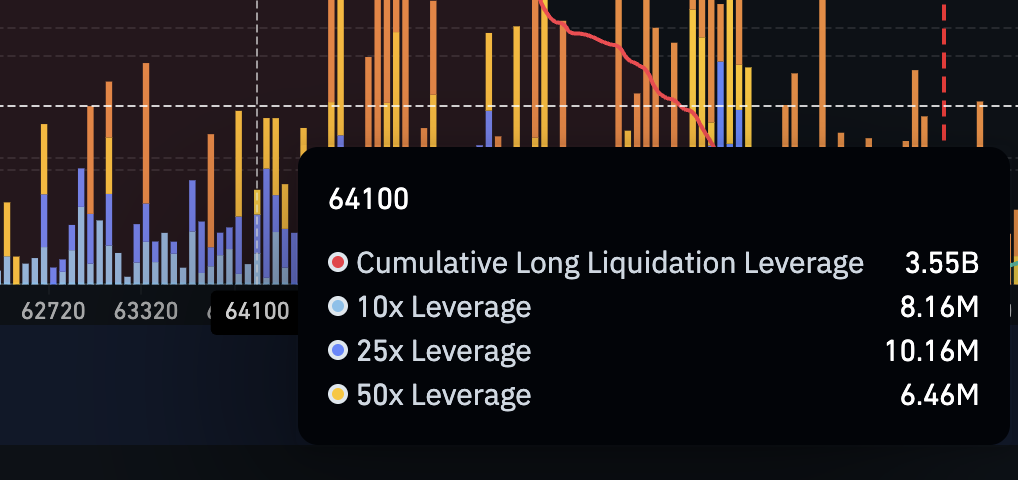 BTC Liquidation Cluster at $64,100: Coinglass
A move to $64,100 (the 64,000 zone) would also align with the 0.618 Fibonacci retracement level. This makes it both a technical and derivatives flashpoint.
For the Bitcoin price prediction on the current structure, the immediate deciding level is at $68,700. BTC is currently testing this level. A failure to hold above it opens the path to $66,400, which aligns closely with the ascending channel’s lower trendline.
If the channel breaks, $64,100 becomes the next major target. A move there would liquidate the bulk of the long leverage, creating a cascading effect that could push BTC toward $60,900 and even $56,800, a level which would worsen the 40% dip highlighted earlier.
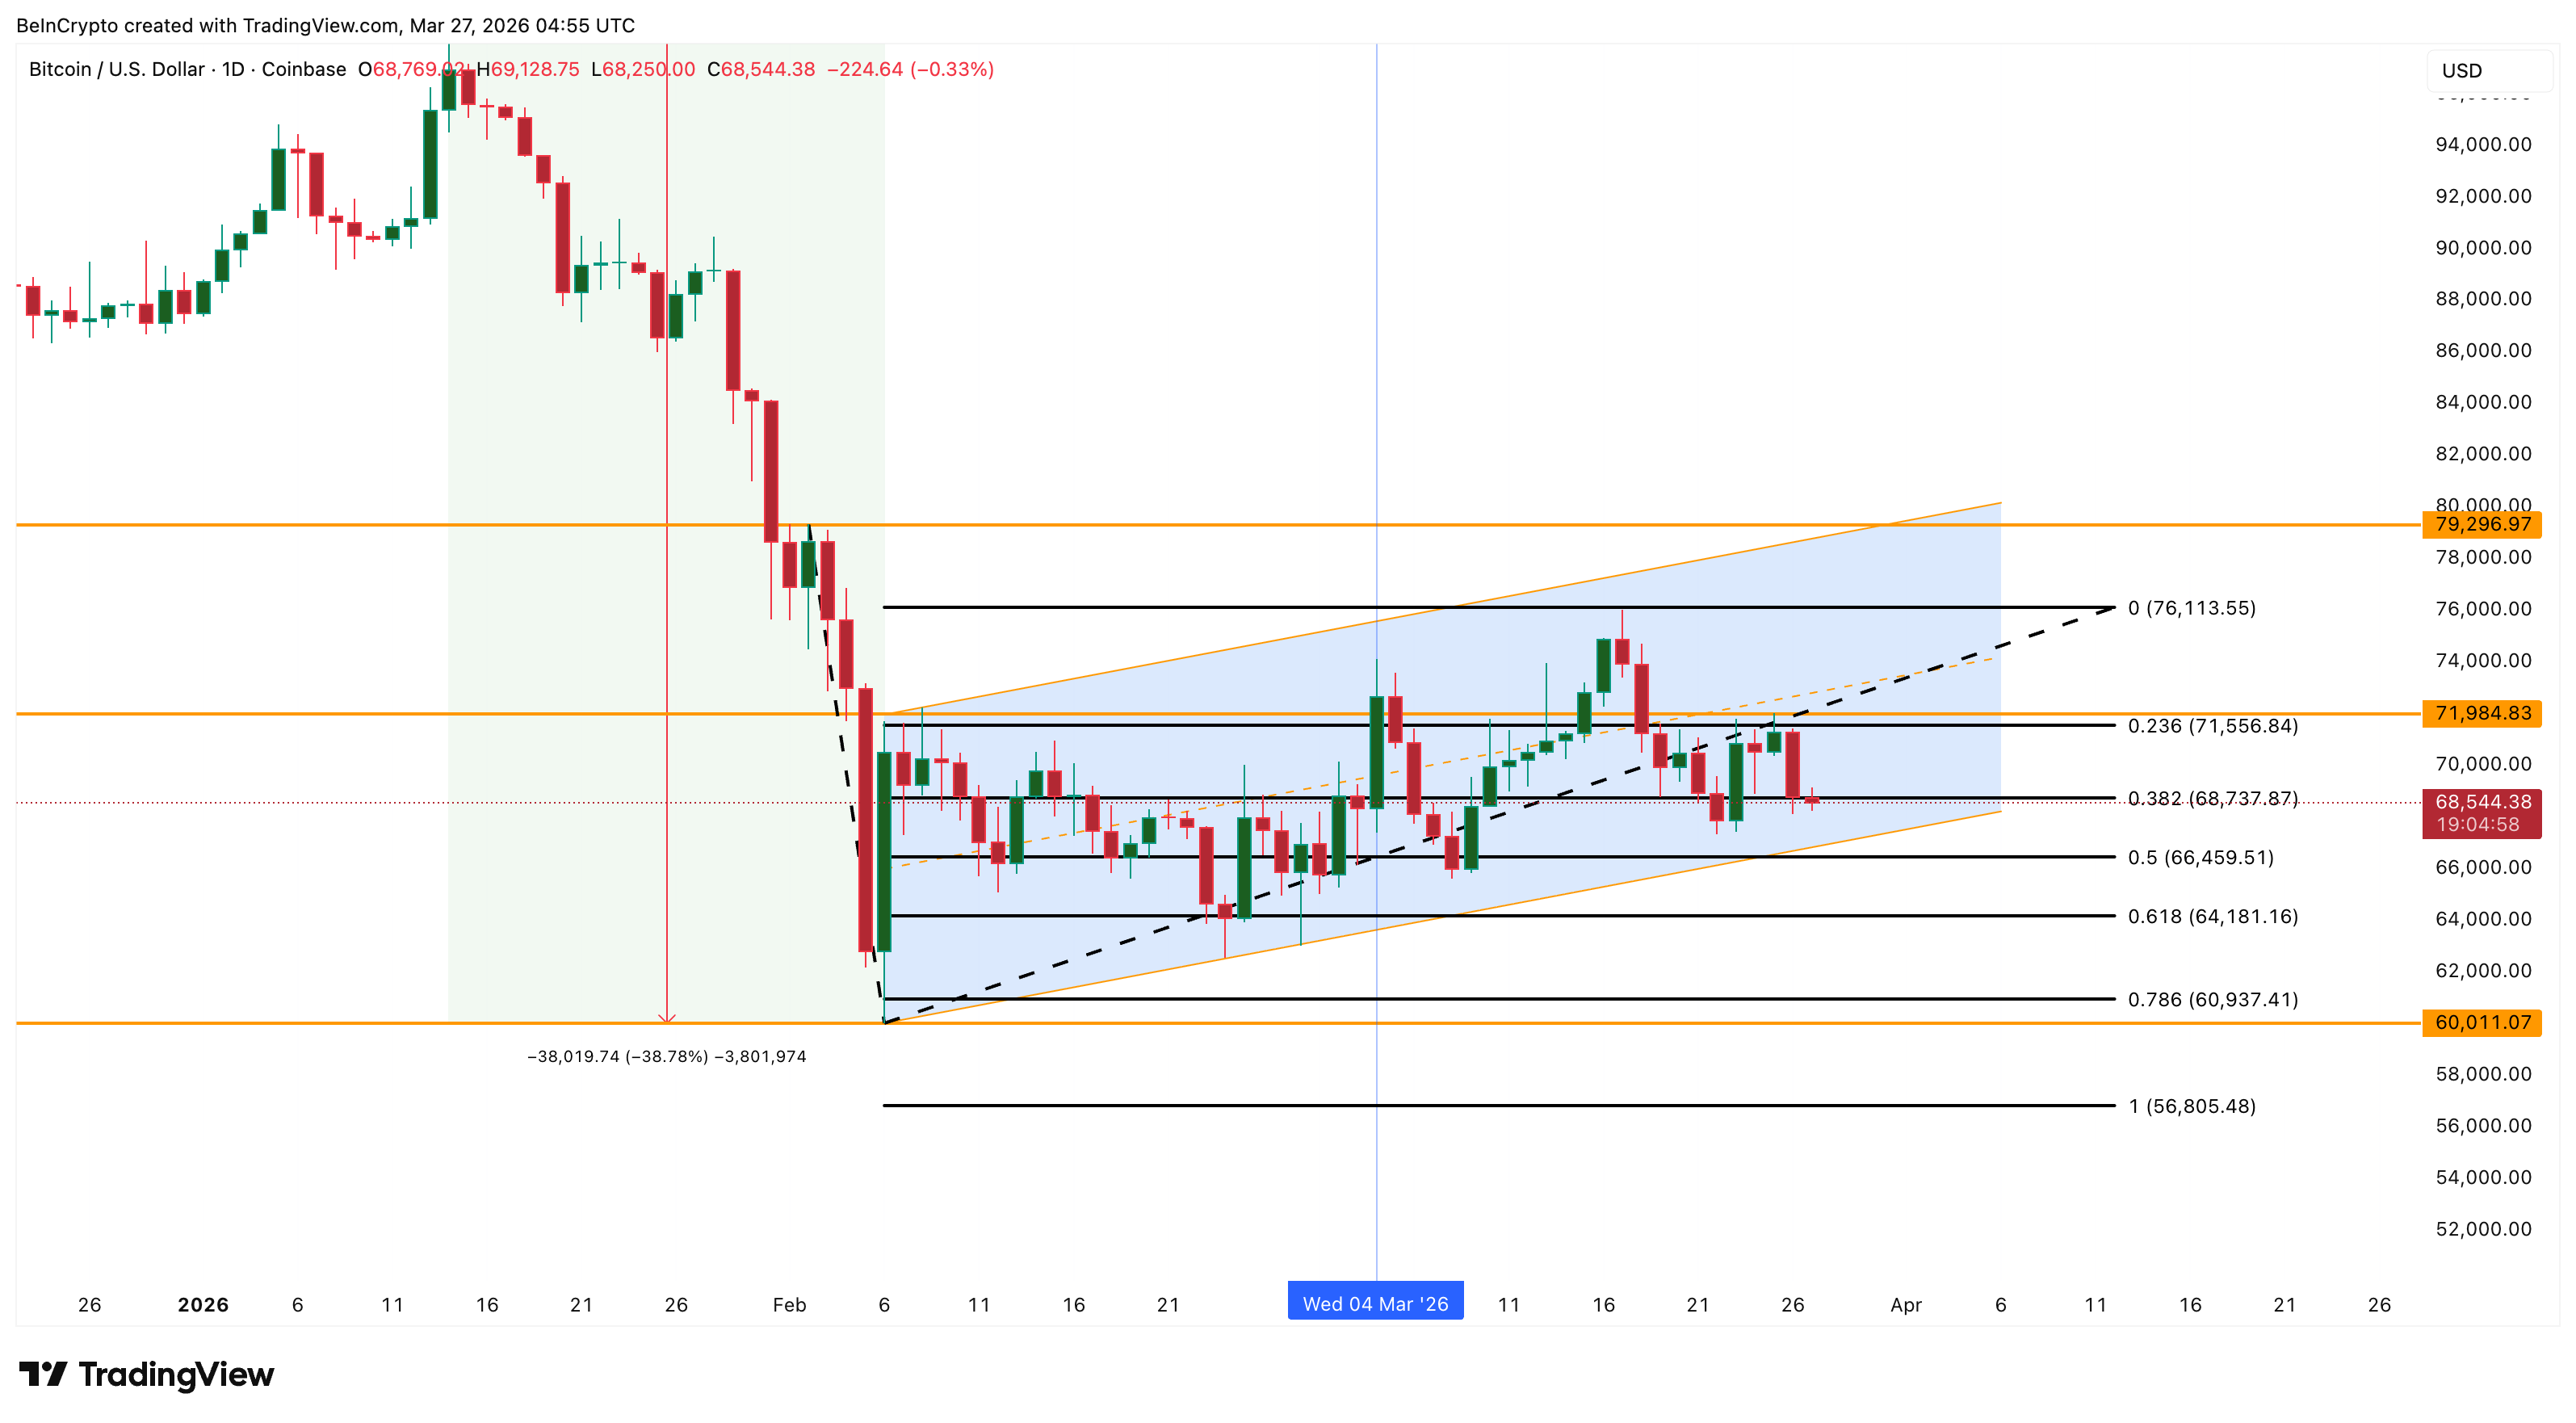 Bitcoin Price Analysis: TradingView
On the upside, BTC needs to reclaim $71,500 to relieve the immediate bearish pressure. Bullish strength returns only above $76,100.
A daily close below $66,400 breaks the ascending channel and exposes $3.55 billion in long liquidations at $64,100. Yet, a reclaim of $71,500 would delay the bearish thesis and keep the rebound alive.
Recommended Articles


