


Why SIREN Price Can Survive a 60% Drop and Still Hit New Highs
Siren (SIREN) price is trading near $1.95 after gaining over 600% in 30 days, but a developing bearish divergence on the 4-hour chart threatens a short-term pullback.
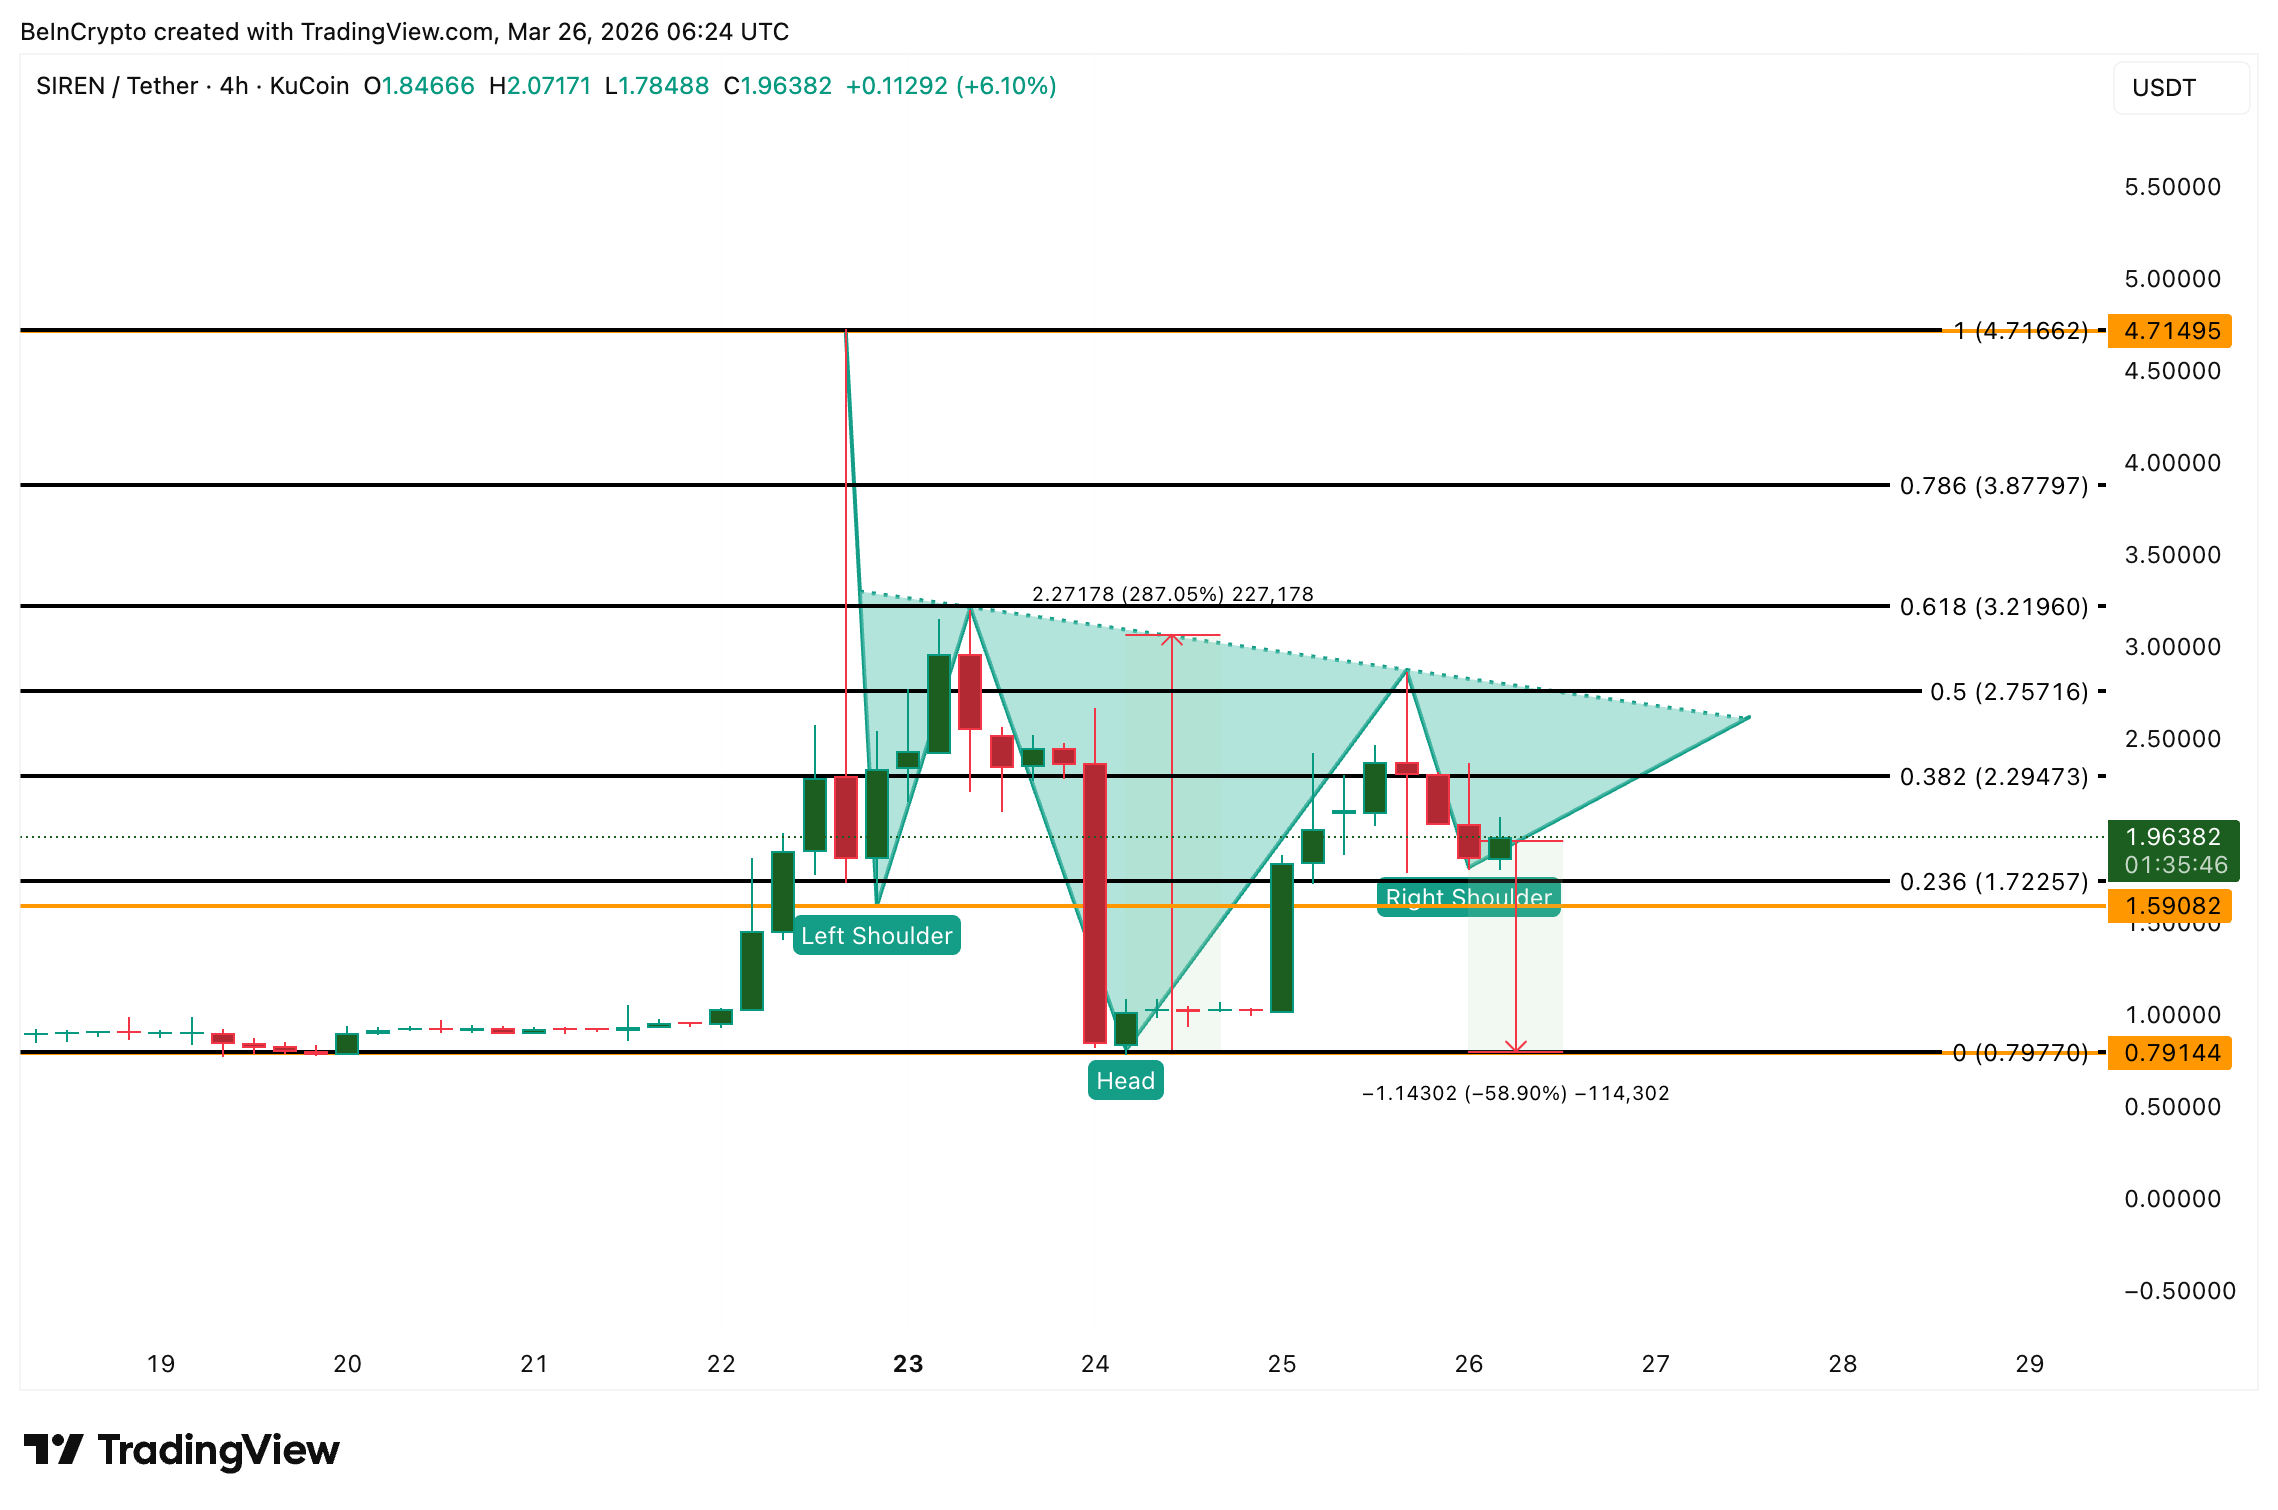
The token crashed 83% from $4.71 to $0.79 between March 22 and March 24 before rebounding sharply. That violent swing has created a potential inverse head-and-shoulders formation on the 4-hour timeframe. This pattern carries a measured move target of roughly 287%. But there is more to that pattern than what meets the eye.
RSI Divergence May Delay the Right Shoulder
The 4-hour SIREN chart shows an inverse head and shoulders pattern with the left shoulder forming around March 21. The head printed on March 24, and the right shoulder is currently developing. A confirmed break above that neckline would open a measured move target of 287%.
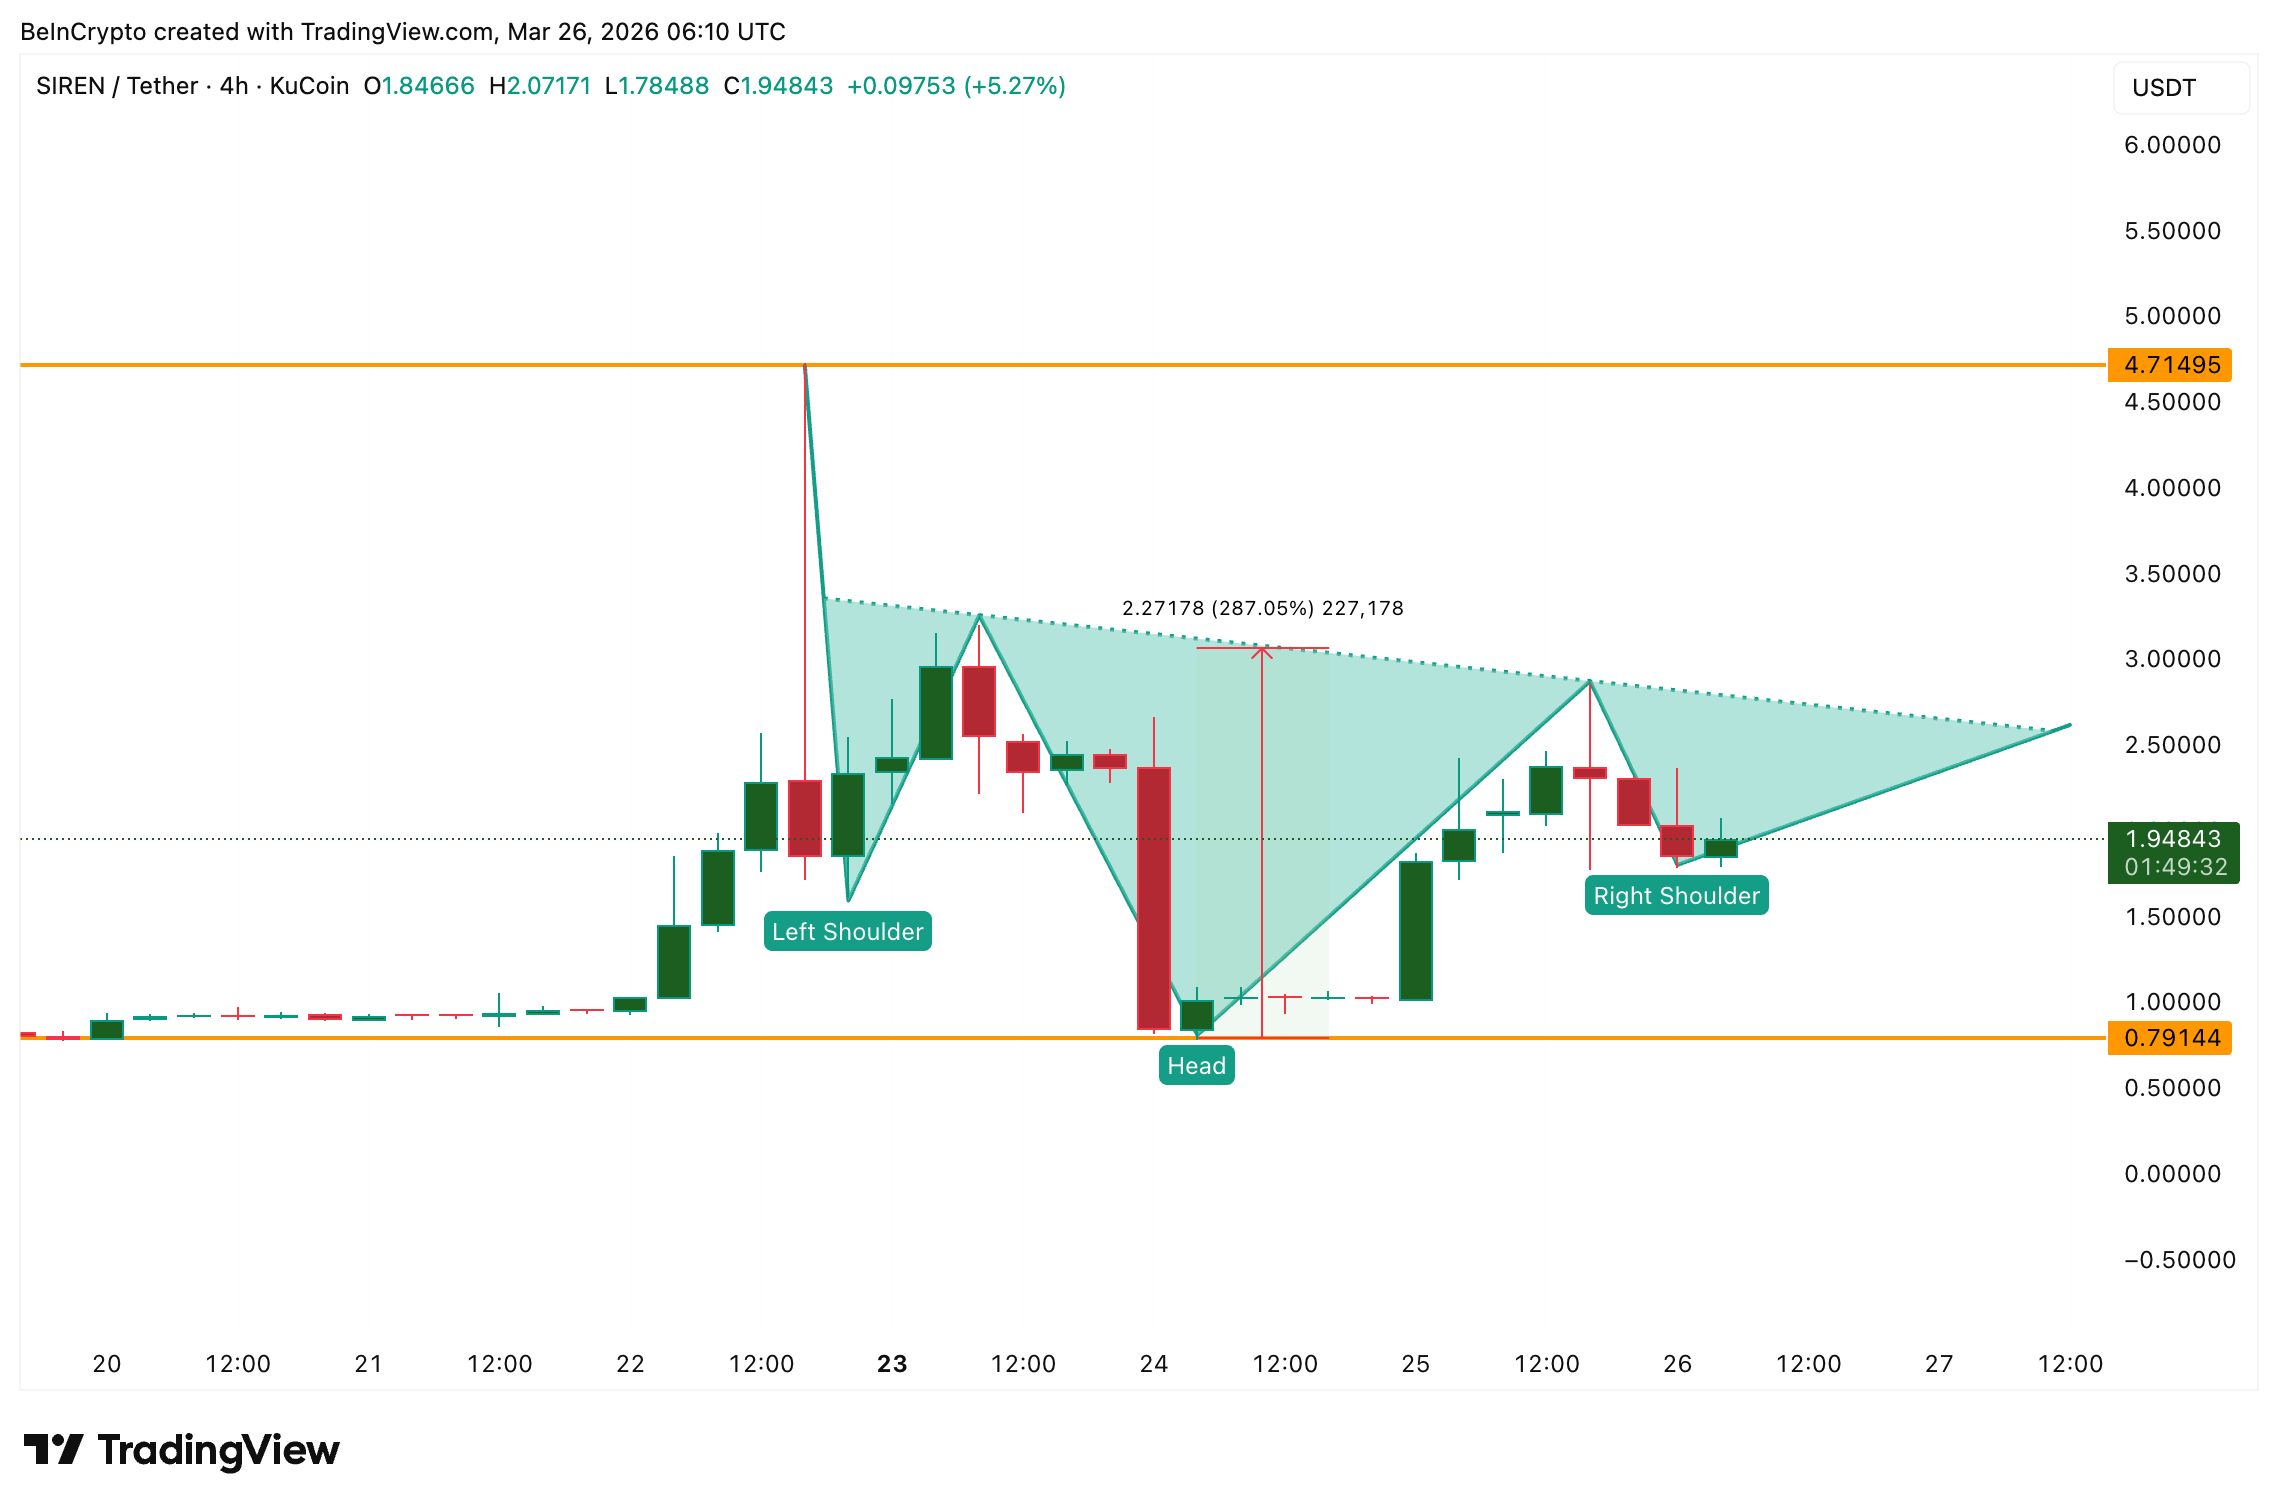 Bullish Price Pattern: TradingView
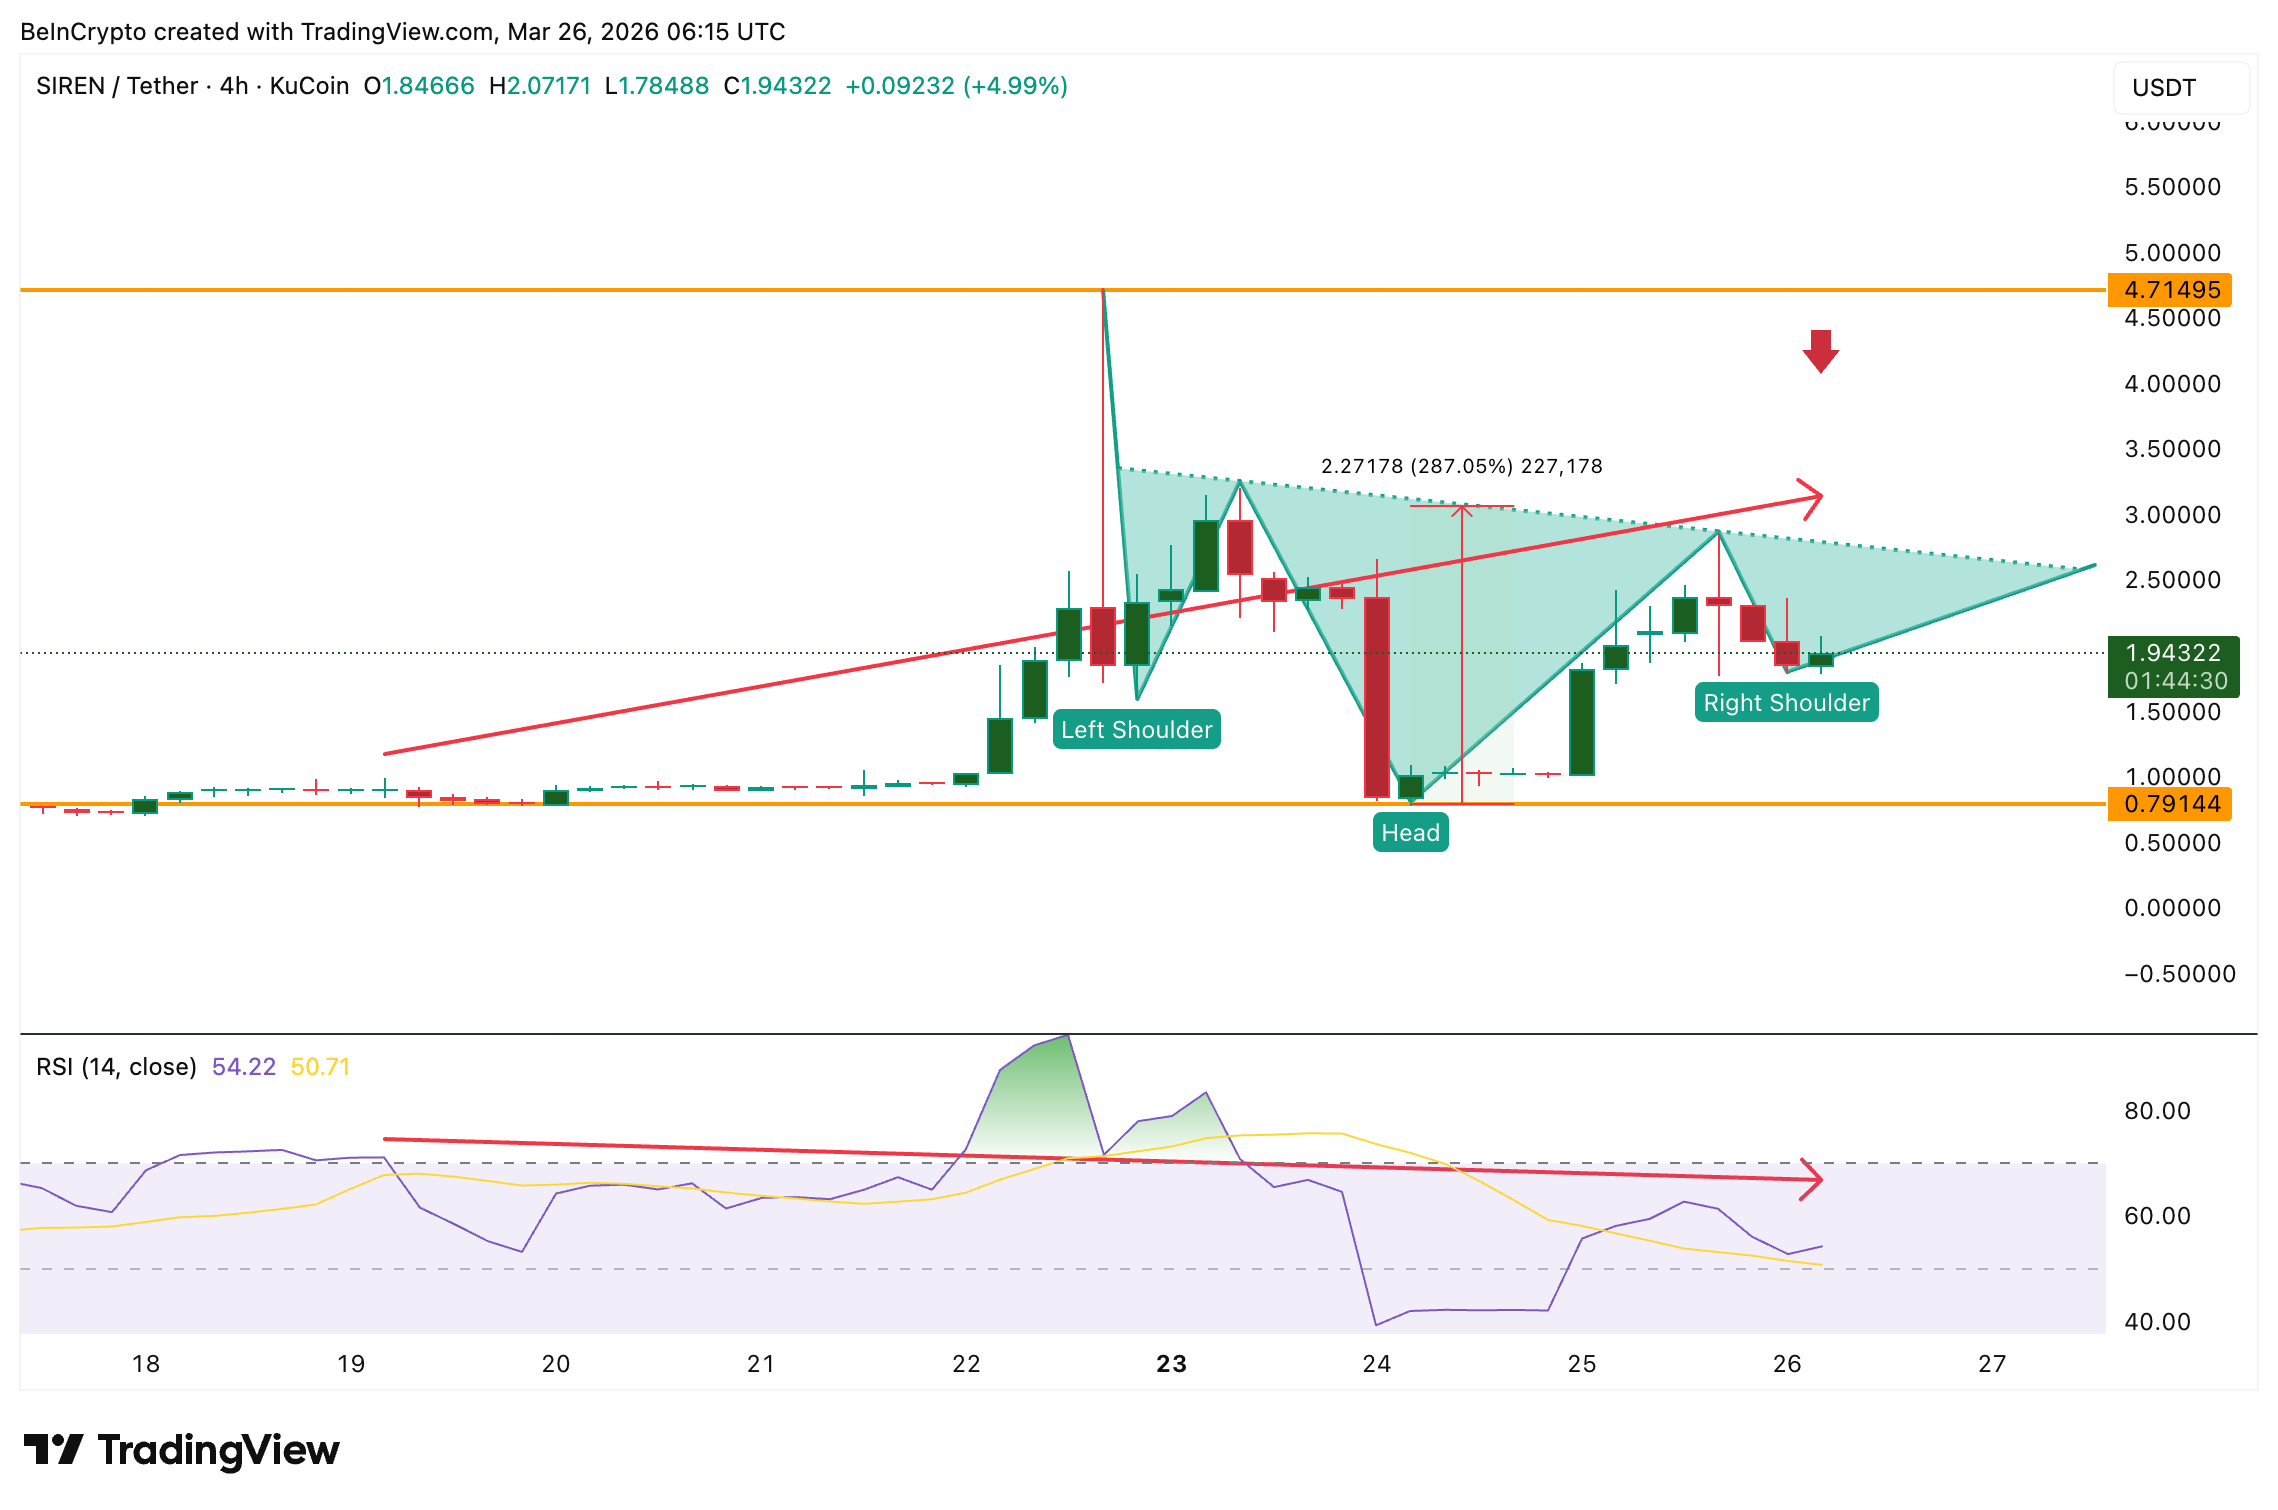
However, the Relative Strength Index (RSI), a momentum oscillator that measures the speed of price changes, is developing a standard bearish divergence on the same timeframe. Between March 19 and March 26, the Siren price formed a higher high while the RSI formed a lower high, with the previous RSI peak occurring in overbought territory above 70.
 SIREN RSI Bearish Divergence: TradingView
The divergence is not yet confirmed. If the next 4-hour candle closes lower than the current green candle, it would establish a swing high and validate the signal. A confirmed divergence would suggest momentum is fading even as price pushes higher, which could cause the right shoulder to form lower.
The key structural detail is that the pattern survives a deep pullback. The head sits at $0.79, so anything above that level keeps the inverse head-and-shoulders intact. Even a 60% decline from the current $1.95 level would keep the bullishness intact. The pattern essentially absorbs extreme volatility, which is consistent with SIREN’s recent behavior.
However, the divergence risk alone does not explain the selling pressure. On-chain holder data adds another layer.
Smart Money Exits as Top 100 Wallets Absorb Supply
Nansen data paints a polarized picture of SIREN token holder behavior over the past seven days. Smart money wallets, typically early-stage investors and sophisticated traders, have slashed their collective holdings by 99.74%, dropping from a significant position to just 158 tokens. That near-total exit signals that the cohort most sensitive to risk has chosen to take profits after the 600% monthly rally.
At the same time, the top 100 addresses increased their combined balance to 998.52 million SIREN, a 96.79% jump. This concentration raises a centralization risk where a small number of wallets control enough supply to move prices sharply in either direction.
Exchange inflows also add to the short-term caution. Exchange balances rose 3.9% over the past week to 71.26 million SIREN. That increase of roughly 2.67 million tokens suggests some holders are moving coins to trading platforms, which typically precedes selling activity.
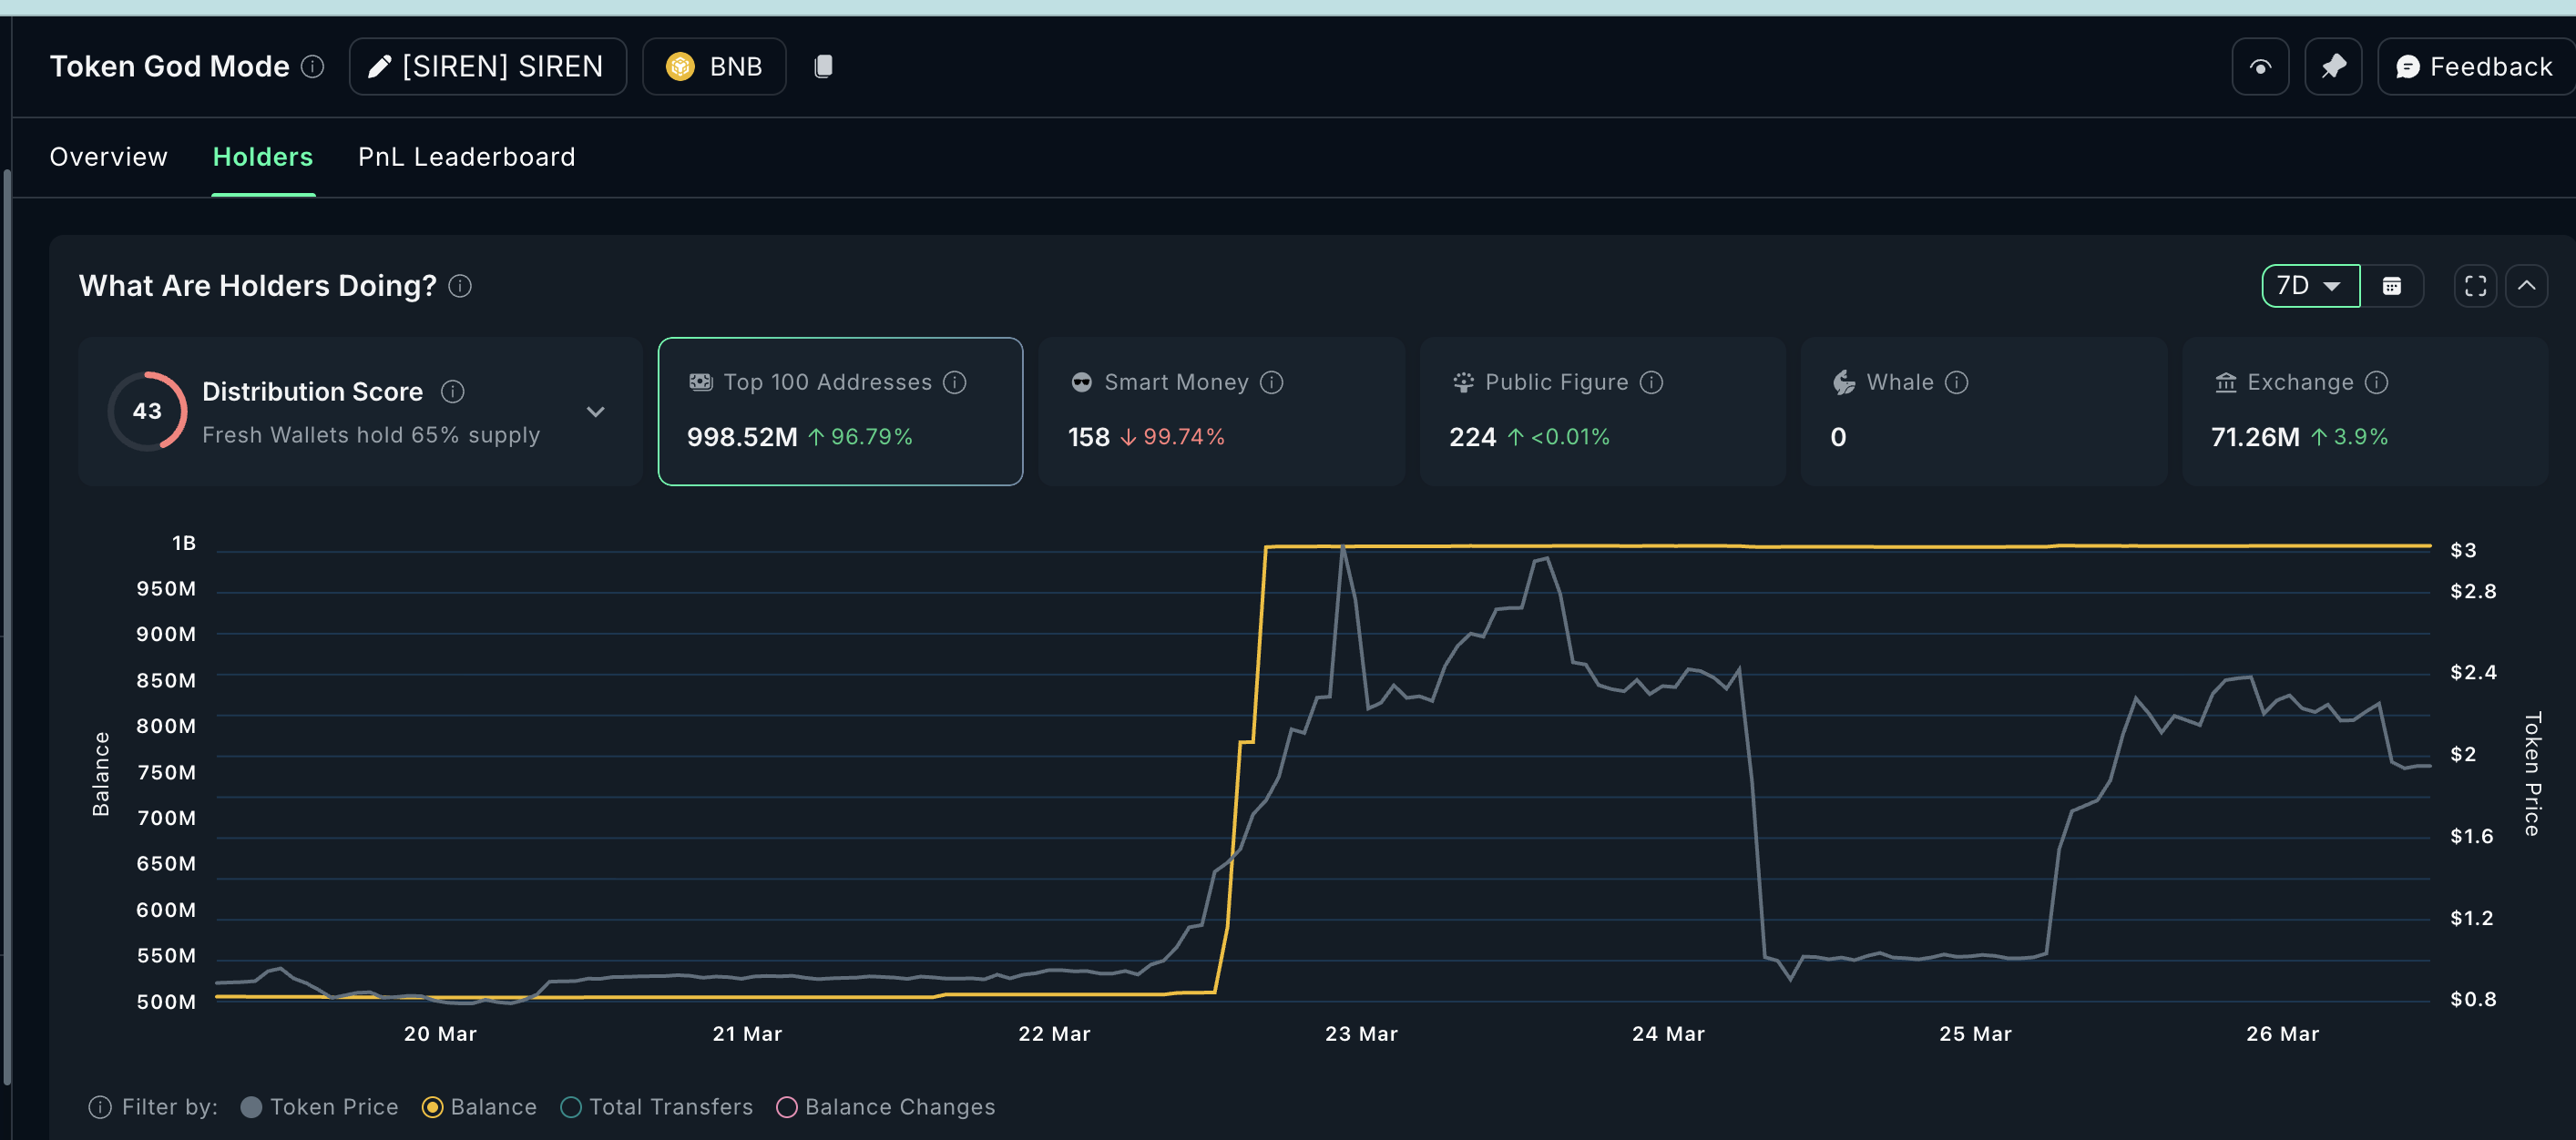 Holder Distribution: Nansen
Want more token insights like this? Sign up for Editor Harsh Notariya’s Daily Crypto Newsletter here.
The combination of smart money exiting, supply concentrating in fewer wallets, and exchange balances rising aligns with the developing RSI divergence signal. Short-term selling pressure appears to be building even as the broader pattern remains technically bullish.
Whether the right shoulder completes at current levels or forms lower depends partly on how the derivatives market responds.
Short Liquidations and the SIREN Price Levels to Watch
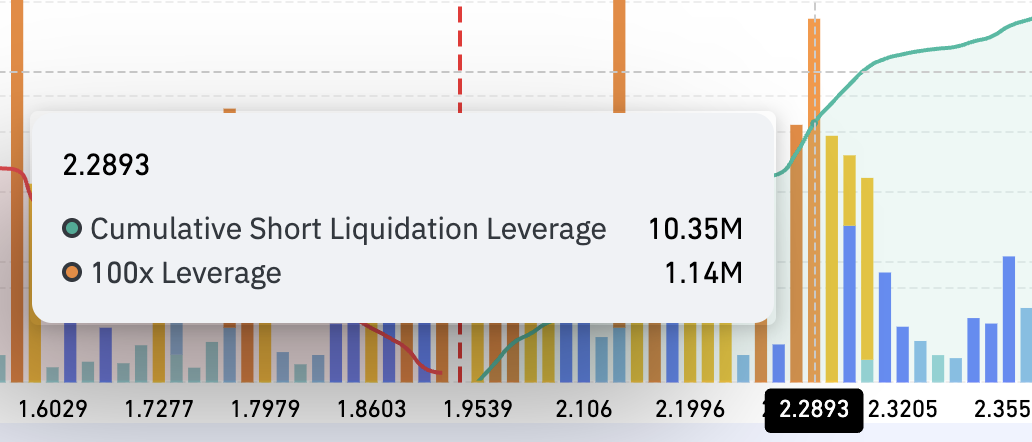
The BingX SIREN/USDT perpetual liquidation map reveals a heavy imbalance in leveraged positioning. Over the past seven days, cumulative short liquidation leverage reached $21.31 million. That’s roughly double the $10.56 million in long liquidation leverage. This means the majority of leveraged bets are positioned for a price decline, aligning with exchange flows and smart money positioning.
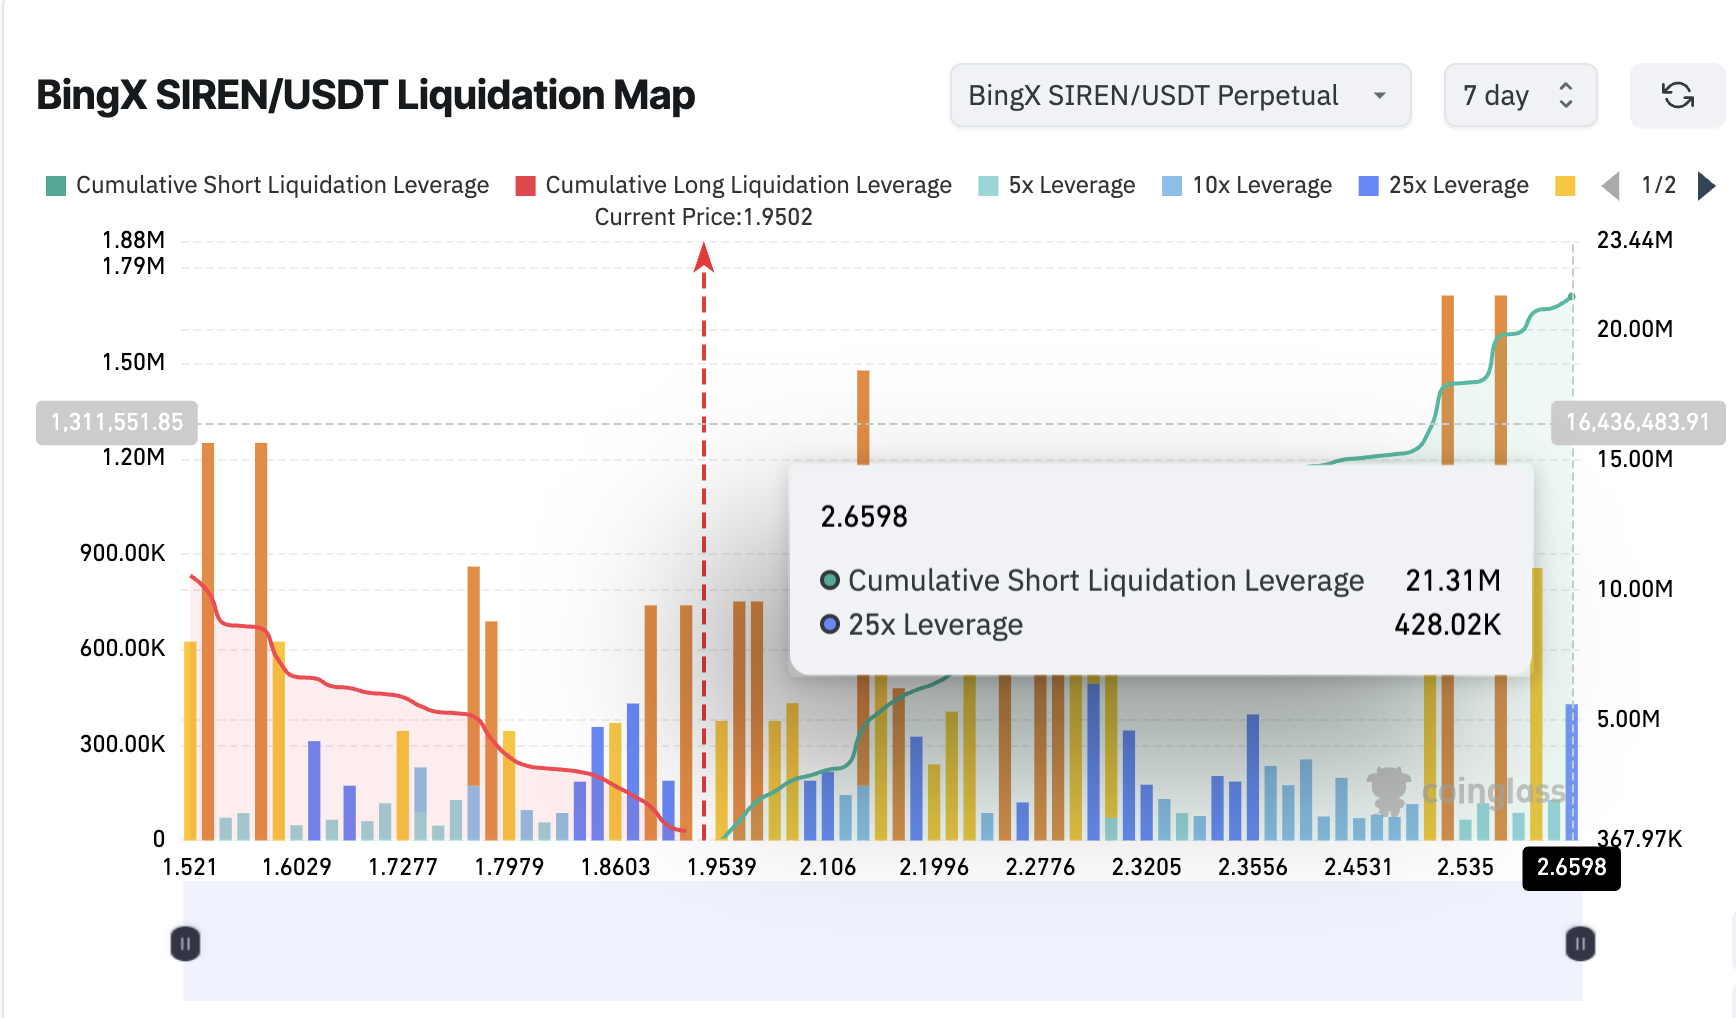 Liquidation Map: Coinglass
The densest short cluster sits near $2.29, where approximately $10.35 million in cumulative short liquidation leverage is concentrated. A 4-hour close above $2.29, which is also a key technical level, could trigger a cascade of forced short closures and push prices higher rapidly.
 SIREN Liquidation Cluster: Coinglass
For the Siren price prediction on the current structure, the immediate resistance sits at $2.29. A move through that level clears the short cluster and opens the path toward the $2.75 neckline. A confirmed break above $2.75 would complete the inverse head and shoulders. And that would project a target higher than $4.71, the current peak.
On the downside, the right shoulder can form anywhere above $0.79 (near 60% drop) without invalidating the pattern. A key technical support lies at $1.72 acts. Below that, the left shoulder low near $1.59 represents the next cushion. A daily close below $0.79 invalidates the entire structure.
 SIREN Price Analysis: TradingView
A 4-hour close above $2.29 could trigger short liquidations toward the $2.75 neckline. And a breakdown below $1.59 would signal the right shoulder has failed and risk extends toward the $0.79 head.
Recommended Articles


