


Goldman Raised Recession Odds to 30% But Bitcoin ETFs Just Posted Their Longest Inflow Streak of 2026
In this post:
Goldman Sachs raised U.S. recession odds to 30% for the third time this year, with EY-Parthenon at 40% and Moody’s at 48.6%, every major forecaster is now running at least double the historical baseline.
Chevron’s CEO warned oil futures haven’t fully priced in the Hormuz disruption
Bitcoin is down 20% YTD and sentiment is at extreme fear, yet Bitcoin ETFs just posted $1.53B in inflows over four straight weeks, the longest positive streak of 2026.
The largest firms on Wall Street are now raising U.S. recession probabilities in tandem as warning signs caused by the Iran war and the resultant global energy disruption accelerate. Goldman Sachs raised its odds of the U.S. sliding into a recession to 30%, its third upward revision this year. Meanwhile, EY-Parthenon puts the odds at 40% and Moody’s Analytics has them at 48.6%. Brent crude is trickling back above $100 per barrel, inflation has re-accelerated to 3.1%, GDP growth has slowed to what some economists describe as stall speed and Chevron CEO Mike Wirth publicly stating that markets may not have fully priced in a longer disruption in the Strait of Hormuz.
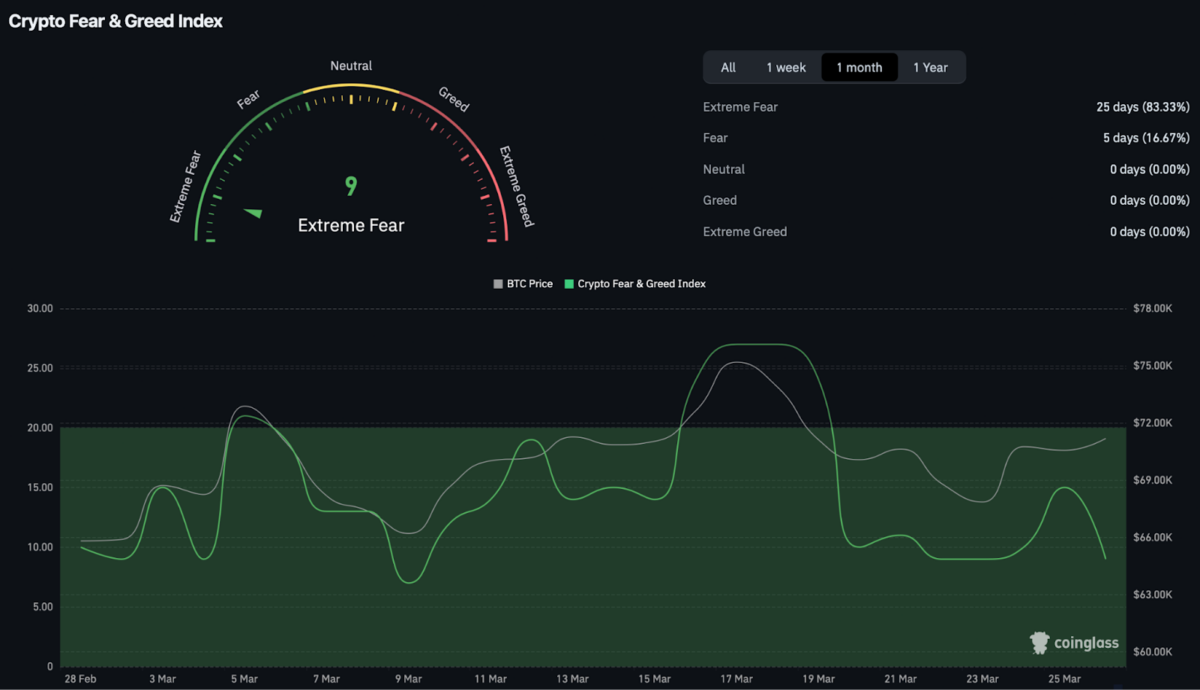
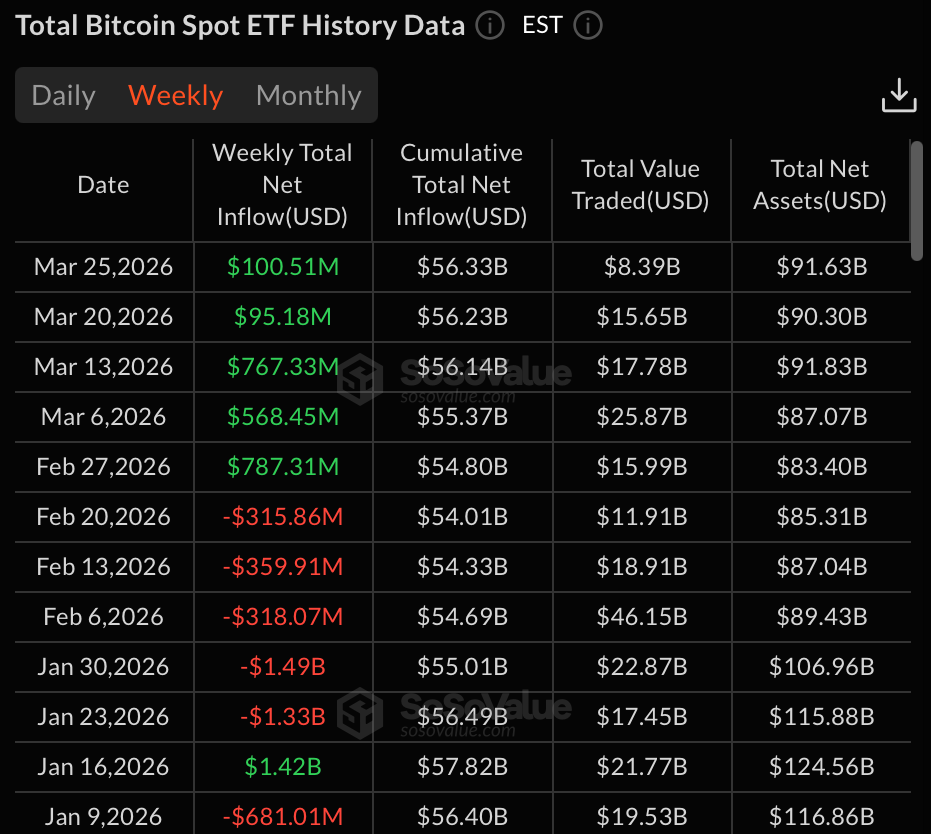
The macro backdrop looks bleak for risk assets and for the most part retail participants in the crypto markets have listened. The crypto fear and greed index is well within the extreme fear territory with a reading of 9. In fact over the past month, data from CoinGlass shows that sentiment has been in this territory for 25 days without even reaching the neutral zone a single day. The sentiment, however, seems to be dramatically different when we shift focus to the institutional investors. SoSo Value data shows that, since the start of the month, Bitcoin ETFs have seen four consecutive weeks of net inflows that add up to $1.53 billion.
The contrast between what the macro data is telling us and the renewed momentum in institutional inflows brings up an important question of whether this steady ETF bid shows dip buying or something far more deliberate.
Goldman’s 30%: The Third Recession Call This Year
On March 25, Fortune and TheStreet reported that Goldman Sachs chief economist Jan Hatzius raised the bank’s U.S. recession odds to 30%. This makes it the third upward revision this year from 20% in January and 25% earlier this month. They also increased their projections around headline PCE to reach around 3.1% by December this year, while seeing a full year GDP growth cut to 2.1%. More importantly, growth in the second half is expected to slow to just 1.25% to 1.75%. At the same time, the labour market is now beginning to show signs of fragility with unemployment projected to rise to 4.6% as hiring has already slowed to near breakeven.
Despite this, Goldman still holds that there is a 70% chance of the U.S. avoiding a recession and still sees rate cuts later this year in September and October. The tone, however, has clearly changed. Goldman CEO David Solomon has flagged four main risks at the moment: Stress building up in the $1.8 trillion private credit market, $655 billion in hyperscaler AI spending that has yet to prove its returns, significant geopolitical uncertainty and rising market volatility.
The bank is no longer the most bearish voice in the room. EY-Parthenon sees a 40% chance of a recession, Wilmington Trust places the odds at 45% while Moody’s Analytics is at 48.6%. For context, the baseline probability of a U.S. recession in any given 12-month period historically sits around 20%. Every major forecaster is now running at least double that, and several are approaching a coin flip.
The Oil Variable Wall Street Can’t Model
Oil is the main factor on top of which the entire macro setup currently hinges upon. Goldman expects prices of Brent Crude to reach a high of $105 in March, $115 in April and then decline back to the $80 mark by the end of the year. This forecast essentially assumes that disruptions around the Strait of Hormuz will dissipate within roughly six weeks. Not everyone is on board with this short term shock narrative however. As reported by CNBC, Chevron CEO Mike Wirth warned that the oil markets are operating on “scant information,” with futures prices not recognizing the severity of the disruption. In Asia specifically, the impact of the energy shock is already being felt, with shortages in refined fuels emerging.
The implications of the disruption carrying on for longer is actually pretty straightforward. Here is the domino effect: If oil prices stay high this trickles down to fuel and food prices. This would then lead to a fresh inflation spike which would force the Fed to not cut rates. This is when recession risks rise in direct proportion to how long the disruption lasts.
The Fed held rates steady at 3.50–3.75% on March 18 with a hawkish dot plot, and while Chair Powell downplayed stagflation concerns at the press conference, markets are still pricing in cuts in September and October. If Wirth is right and the disruption extends well beyond Goldman’s assumed timeline, inflation runs hotter for longer, GDP slows further than the current 2.1% projection, and Goldman’s 30% recession probability starts to look like the floor rather than the ceiling.
The Divergence: Extreme Fear Meets Institutional Buying
Bitcoin is down almost -20% since the start of the year and currently trading around the $70K region. The crypto fear and greed index has been stuck in the extreme fear territory with today’s reading at 9. When you start to look at the data on Bitcoin ETFs, however, a completely different story begins to emerge. Spot Bitcoin ETFs have seen net inflows for the fifth week running since February 27th. So far this month we’ve seen total net inflows now at $1.53 billion which means the total net outflow since the start of the year is now cut to about $286.5 million.
The disconnect is that retail investors are panicking and waiting for more clarity while institutional investors are continuing to add to their exposure despite the volatility. This is an important signal because ETF inflows are usually parked for the long term and is capital that goes through compliance, portfolio committees and structured position sizing before a single dollar is moved. When institutions consistently add exposure through macro deterioration, rising recession odds, and cratering sentiment, it reflects a positioning thesis. The open question is whether that thesis is a high-conviction dip buy, a stagflation hedge being built quietly before the broader market catches on, or some combination of both.
What to Watch: The Recession-Stagflation Fork and Bitcoin’s $70K Decision
The market currently sits between two very different paths. Bitcoin is in the middle of this fork. If the U.S. leans toward a recession where growth falls and equity markets take a hit, Bitcoin will most likely follow suit to the downside. On the other hand, if a stagflationary environment becomes a reality wherein the economy slows and inflation remains high, this is when scarce assets, as seen with Gold in much of the 1970s, tend to outperform and Bitcoin could start behaving more like a macro hedge. Oil is the key factor to watch closely to understand which path is more likely. If Wirth is correct in his assessment and that the physical damage to the supply chain infrastructure could take months to repair, this would likely trickle into inflation running hotter causing the Fed to maintain a pause on rate cuts well past September. That’s when the 30% odds of a recession starts to look conservative.
Finally, watch the two most immediate indicators of how this resolves. If Bitcoin holds above the $70K–$72K range and ETF inflows extend into a fifth straight week, it suggests institutions are positioning for a stagflation hedge. If that range breaks to the downside alongside weakening flows, it signals the opposite, that macro pressure is winning, and Bitcoin is trading as just another risk asset in a slowing economy.
Get seen where it counts. Advertise in Cryptopolitan Research and reach crypto’s sharpest investors and builders.
Recommended Articles


