


Solana DEX Volume Doubles to a One-Year High, but SOL Price Faces a 55% Crash Hangover
Solana (SOL) price trades near $87 after a 55% crash from January highs, yet its decentralized exchange ecosystem just posted the highest weekly volume in a year.
The Solana DEX volume surged to $138.4 billion in the week ending March 16, more than doubling from the $68.1 billion low recorded in mid-February. The rebound suggests that on-chain activity is recovering, but the price has barely responded. That disconnect between usage and price is the central tension of this analysis.
DEX Recovery Meets a Stubborn Chart Pattern
The weekly DEX volume data from BeInCrypto’s exclusive Dune dashboard shows a dramatic reversal. Pumpswap alone accounted for $101.2 billion of the $138.4 billion total, followed by Meteora at $21.3 billion and Raydium at $4.7 billion. The February trough at $68.1 billion coincided with Solana’s steepest price losses, when SOL fell from $149 to roughly $67 between mid-January and early February.
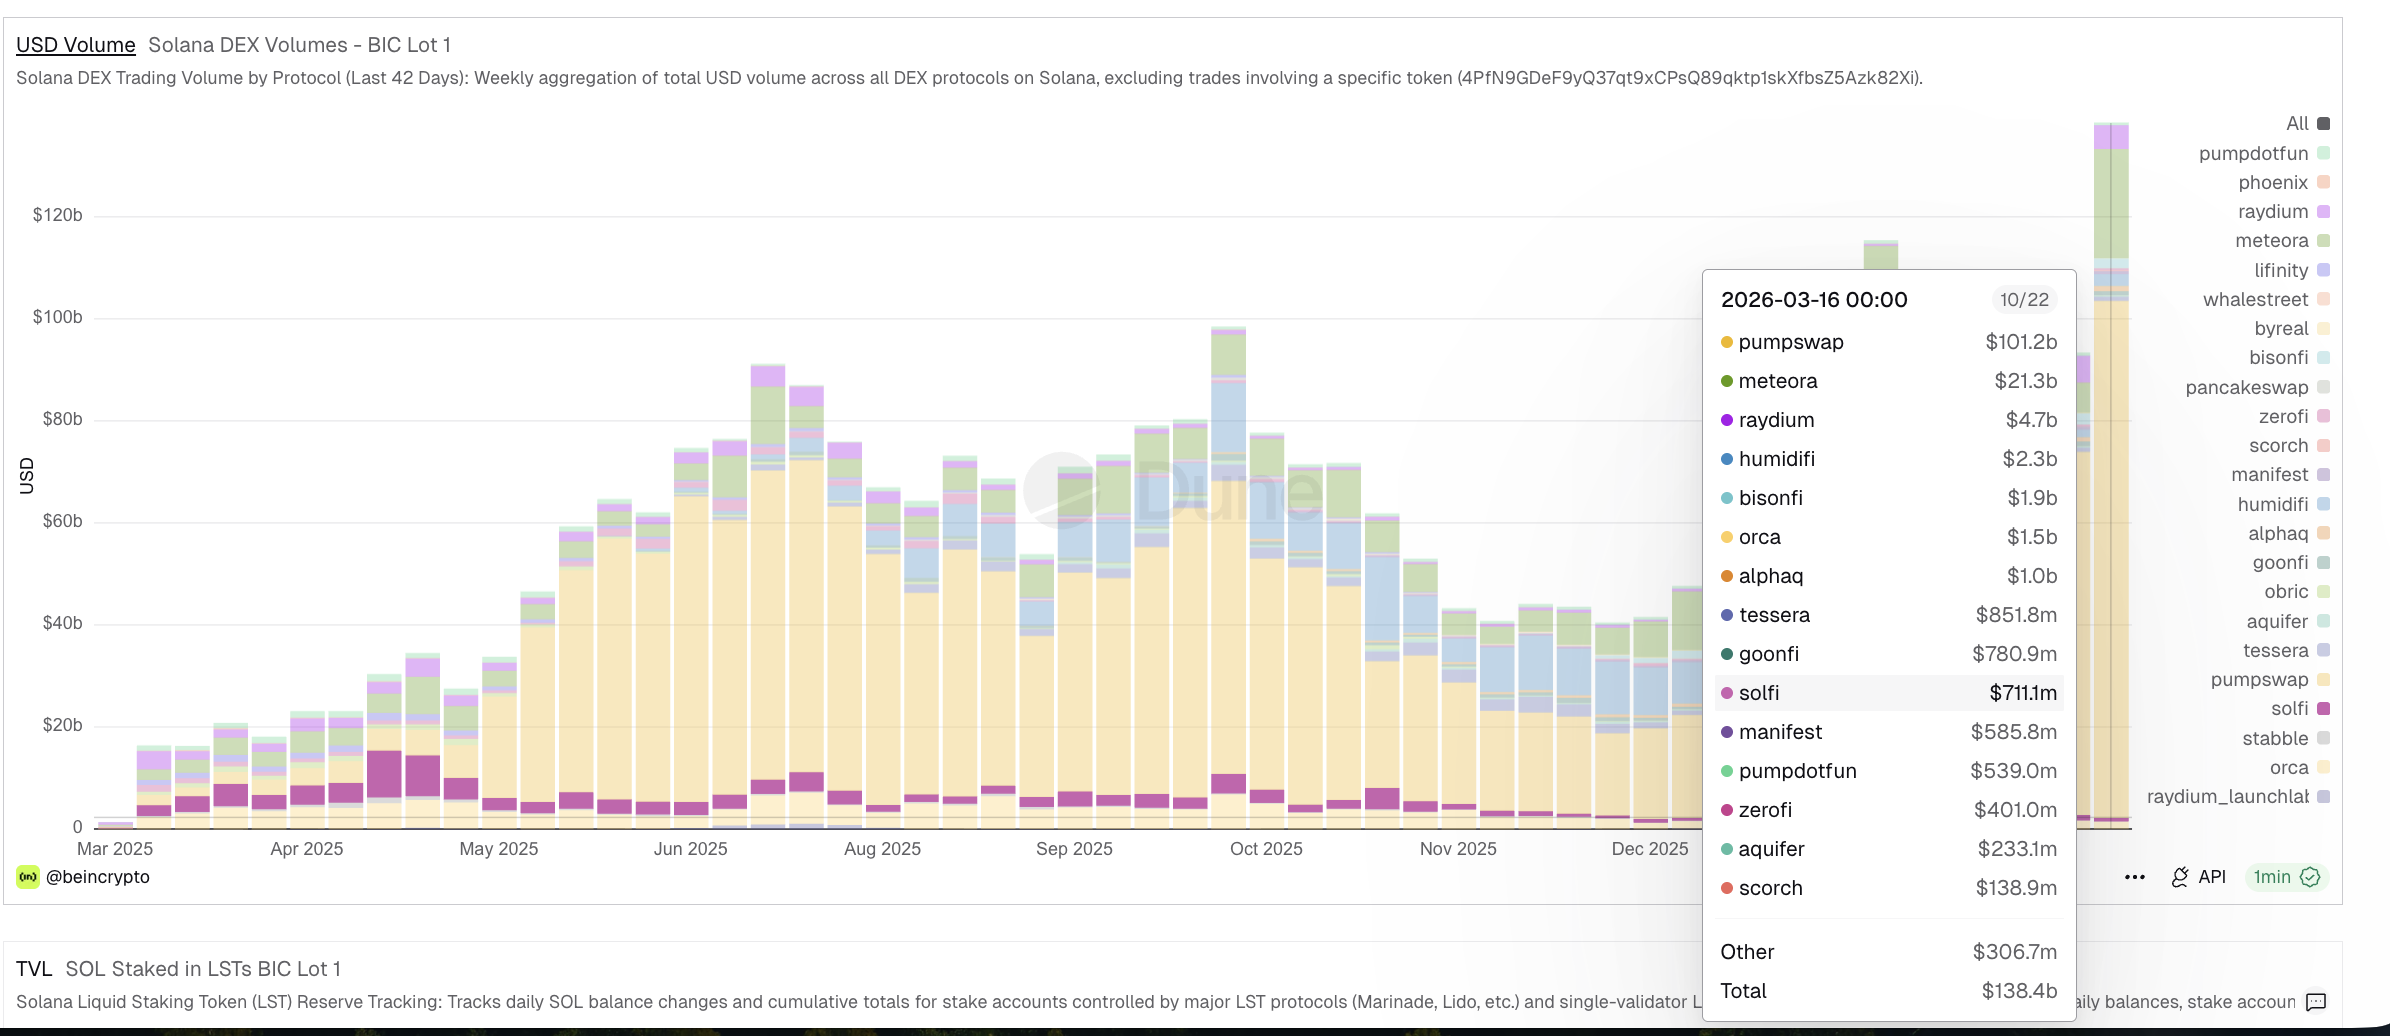 SOL DEX Volume One-Year High: Dune
Want more token insights like this? Sign up for Editor Harsh Notariya’s Daily Crypto Newsletter here.
The recovery in DEX activity aligns with Solana’s move into an ascending channel on the daily chart. Since early February, SOL has been trading between rising trendlines. The channel appears bullish at first glance, but an ascending channel after a 55% crash is not automatically a reversal signal. It often represents a corrective bounce within a larger downtrend unless the upper trendline breaks convincingly.
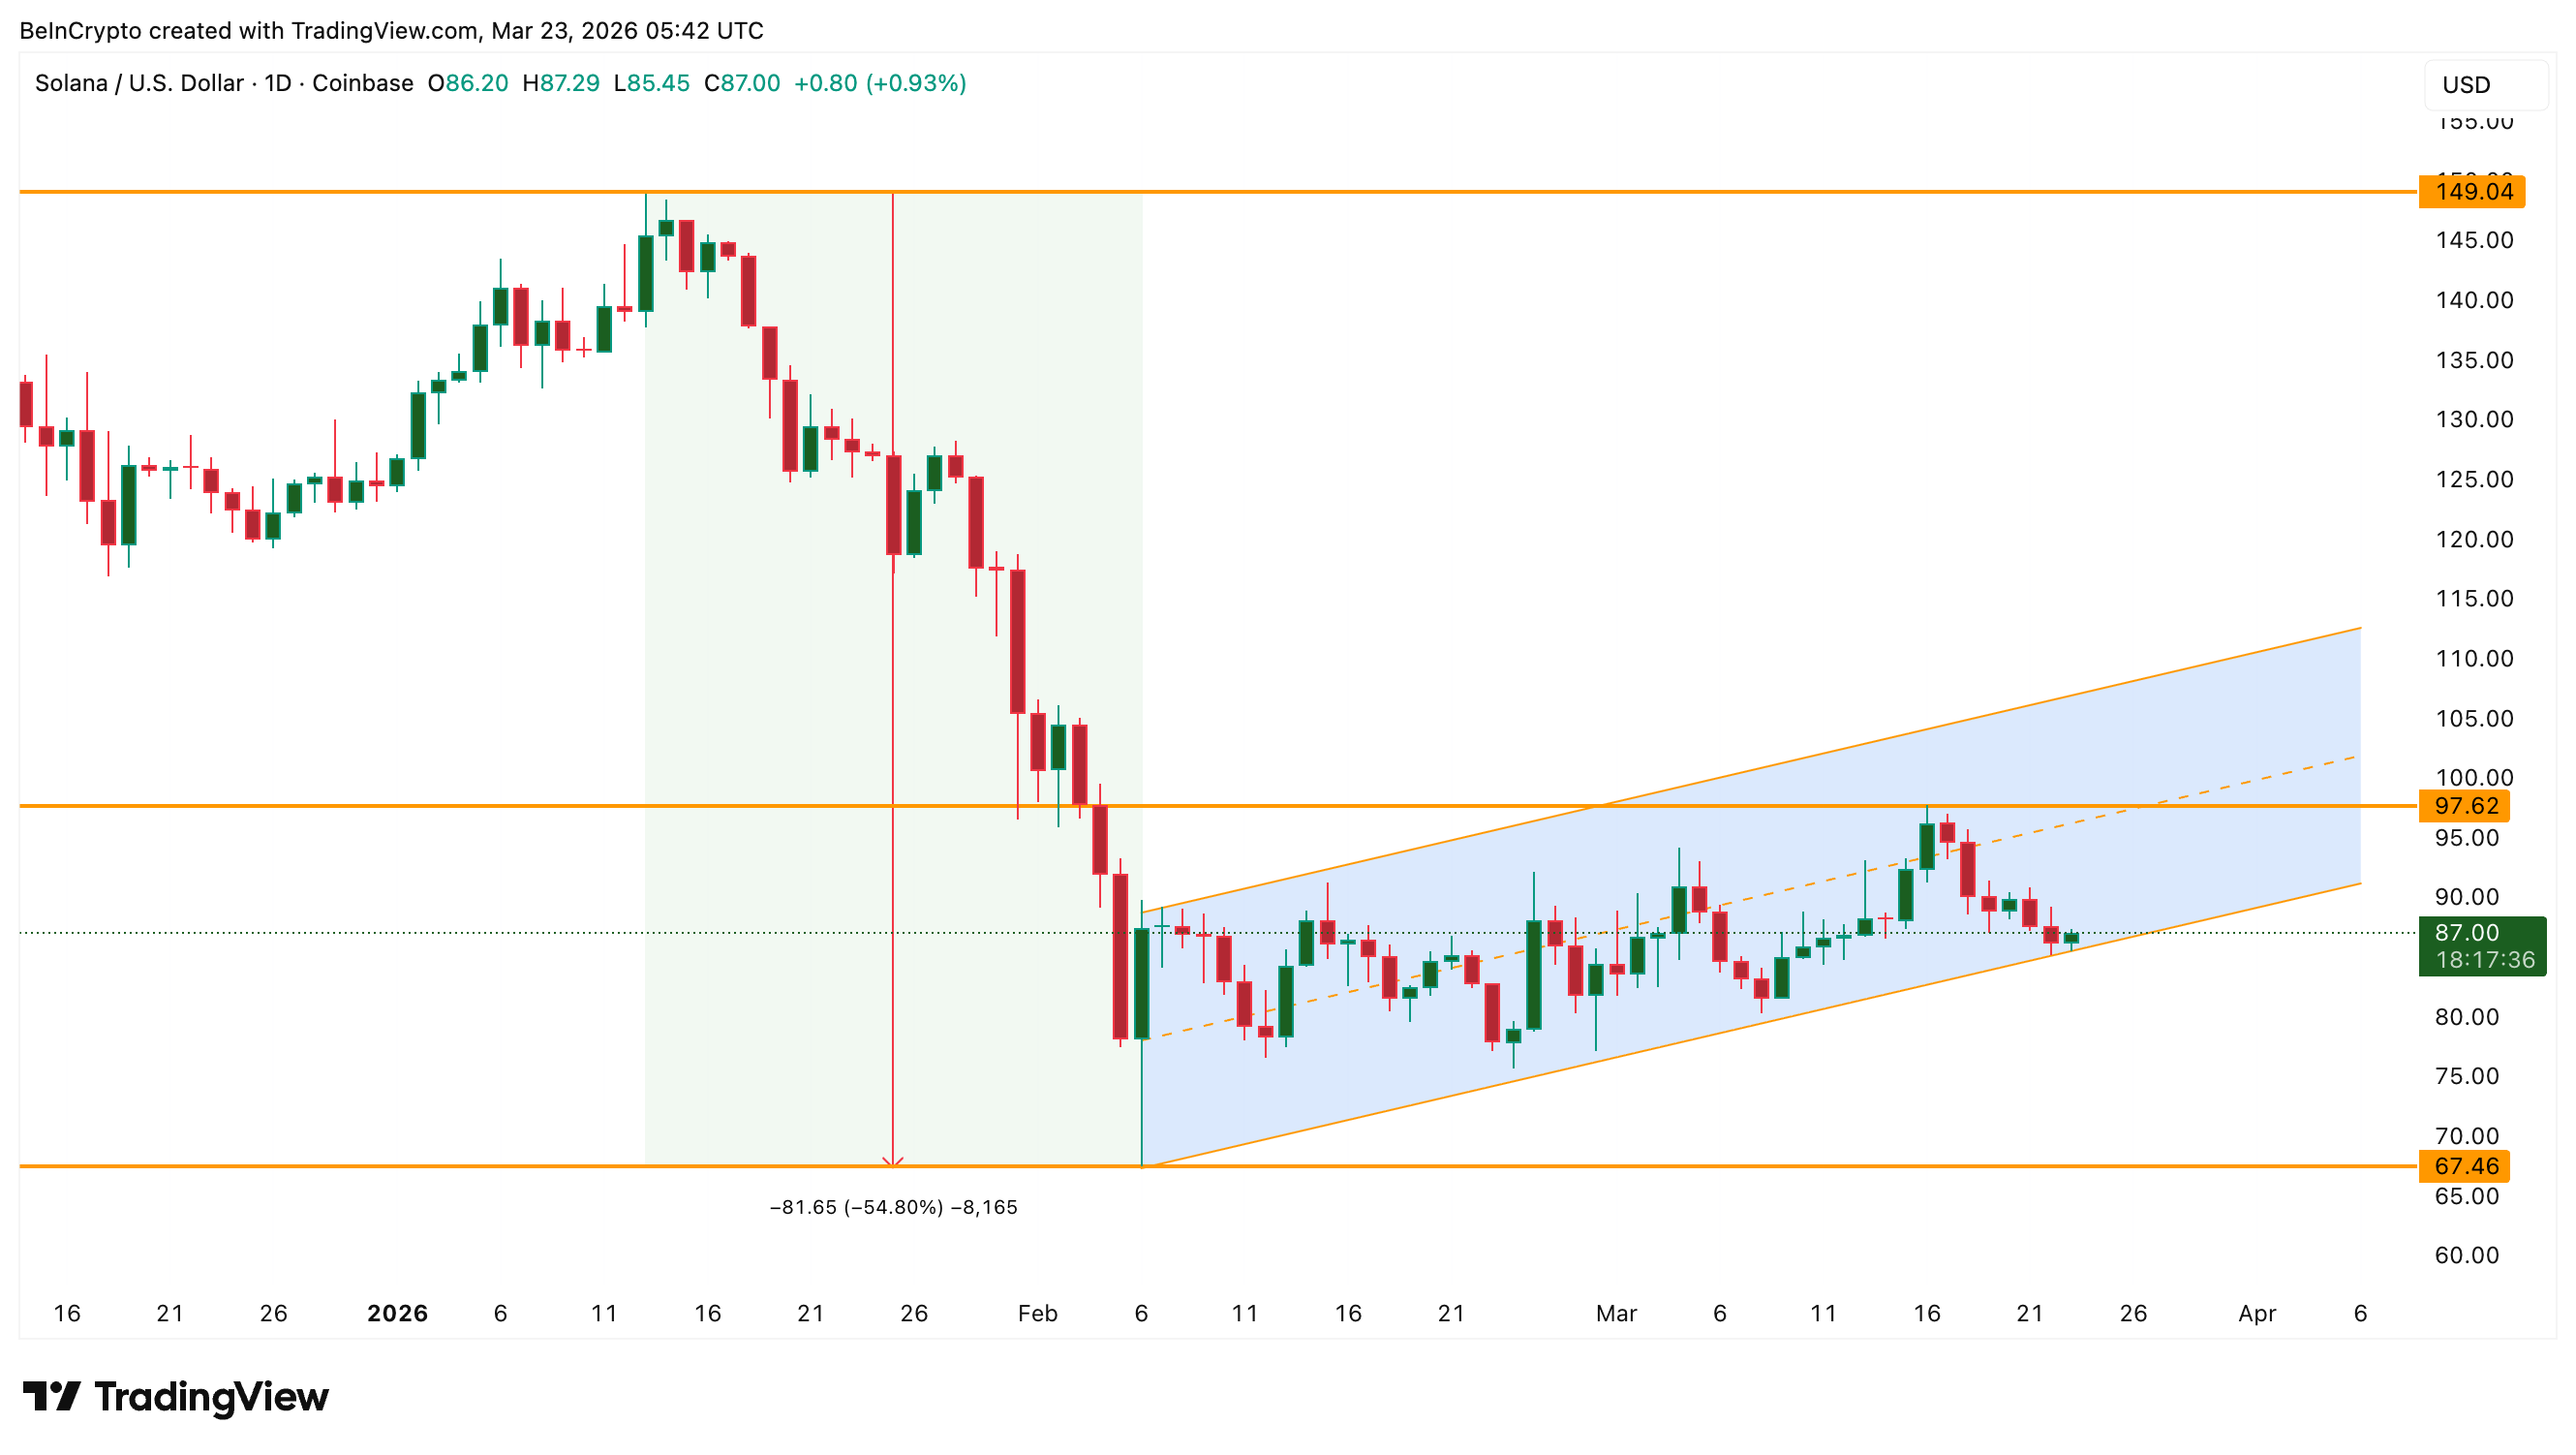 SOL Price Structure: TradingView
The Solana price has tested the $97 swing high and failed. That level has acted as a ceiling since February. Until SOL closes above $97 on a daily basis, the channel remains a recovery structure rather than a confirmed trend reversal. Whether this stalemate breaks depends on who is selling and how much conviction remains underneath the surface.
Short-Term Holders Pose a Sell-Side Risk
The net unrealized profit/loss for short-term holders (NUPL), a Glassnode metric measuring whether recent buyers are sitting on gains or losses, shows an interesting shift. When SOL hit its $67 low in early February, the short-term holder NUPL stood at roughly -0.95, deep in the capitulation zone. By March 22, it had risen to -0.37.
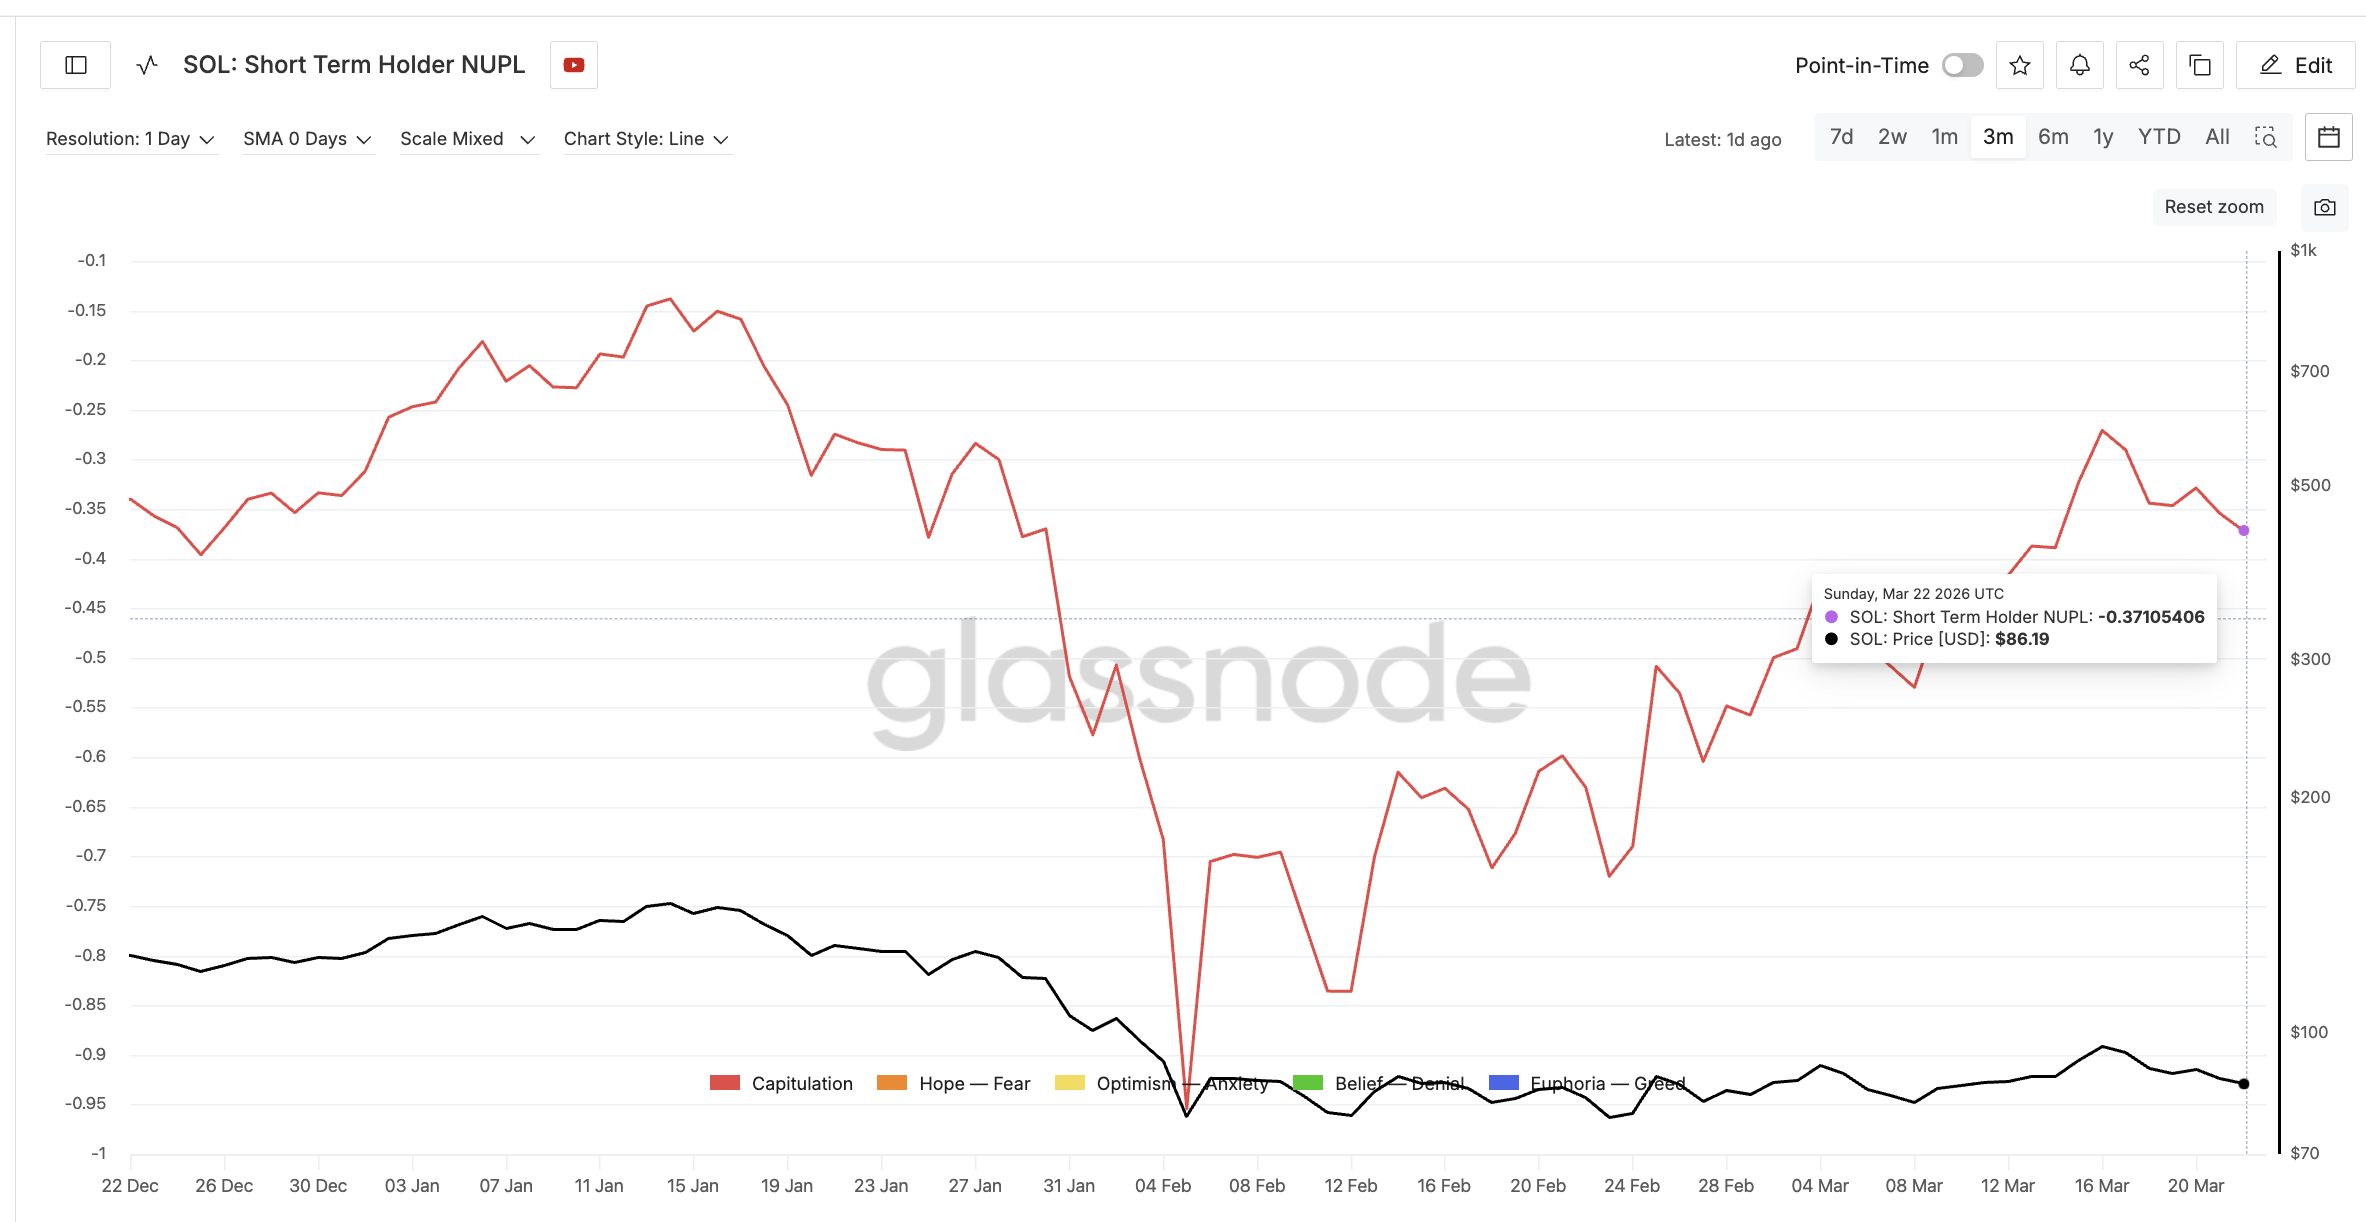 SOL Short-Term Holder NUPL: Glassnode
The reading remains negative, meaning short-term holders are still underwater. However, the gap between their cost basis and the current price has narrowed significantly. That creates a specific risk. As losses shrink, the temptation to sell at breakeven or minimal loss grows stronger. Short-term holders historically exit positions during relief rallies rather than holding for full recoveries.
With Solana up only about 3% month-on-month despite the channel’s gradual rise, even a modest push toward $90 to $95 could trigger breakeven selling from this cohort.
However, the exchange net position change tells a different story. On March 17, roughly 496,000 SOL left exchanges on a net basis. By March 22, that outflow had surged to over 2.18 million SOL, a roughly 340% increase in five days. The acceleration in exchange outflows means spot buyers are withdrawing tokens from exchanges, a signal typically associated with accumulation rather than preparation to sell.
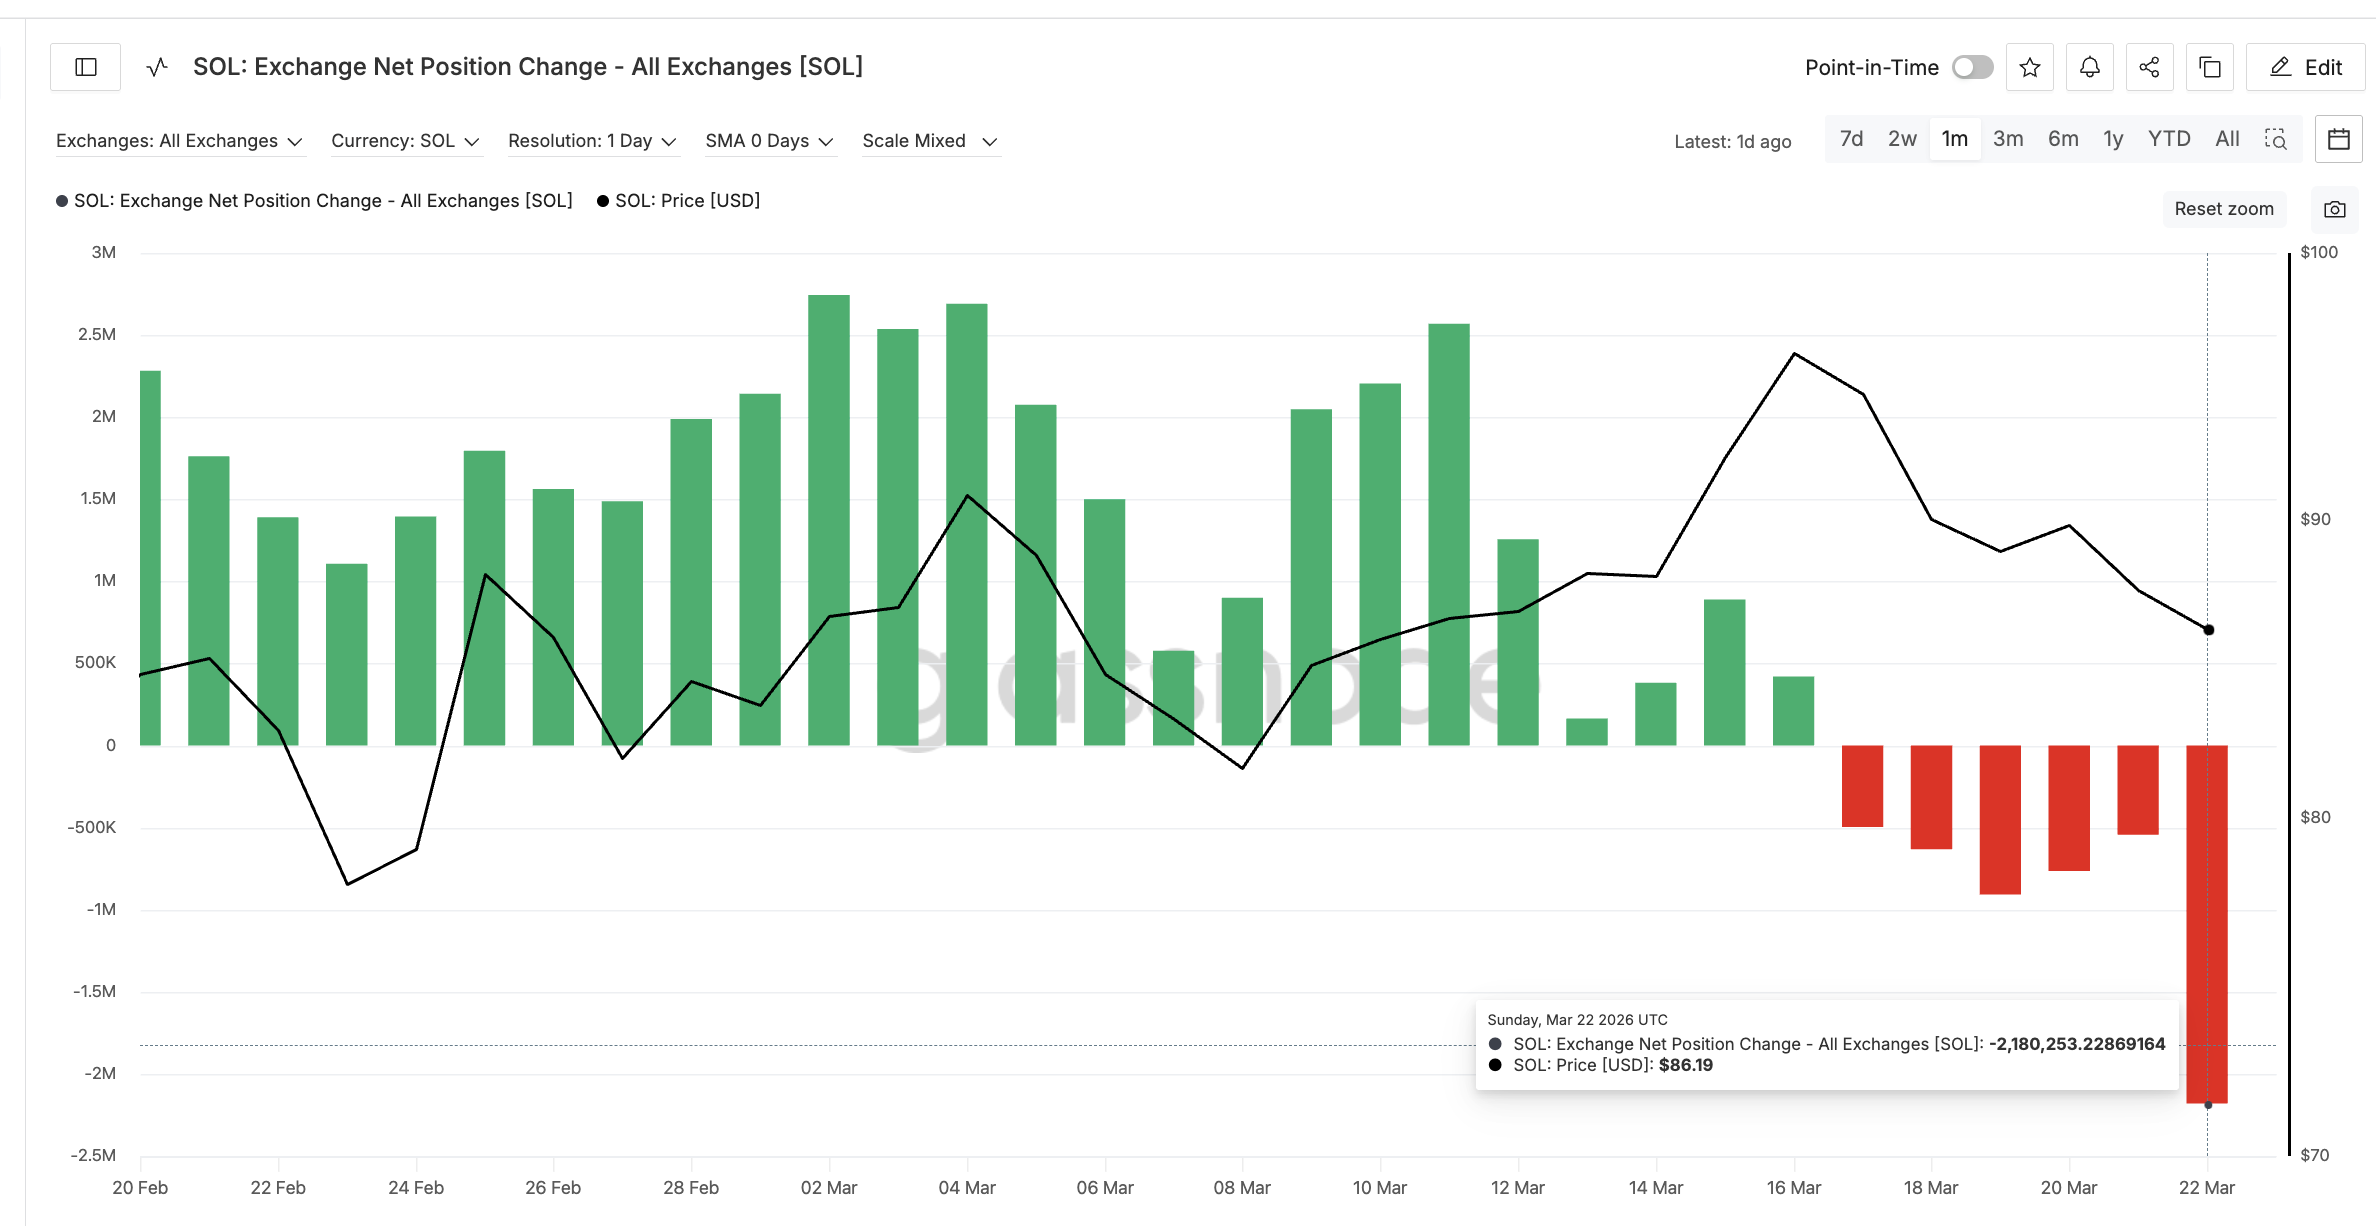 SOL Exchange Net Position Change: Glassnode
The tension is clear. Long-term conviction buyers are pulling SOL off exchanges. But short-term holders with shrinking losses sit ready to sell into any strength. The SOL price chart determines which group wins.
Solana Price Chart Reveals Make-or-Break Levels
SOL currently trades near $87, just above the lower trendline of the ascending channel around $85. A daily close below $85 would break the channel and open a path toward $80, followed by the year-to-date low at $67.
On the upside, the first meaningful hurdle remains $97, the swing high that has rejected every rally attempt since February. A break above $97 would bring the 0.5 Fibonacci level at $100 into focus. That’s a psychological barrier and the point where bullish conviction would begin to shift. Above $100, the upper trendline of the ascending channel near $108 becomes the target, followed by $115 and ultimately $134 at the 1.618 extension.
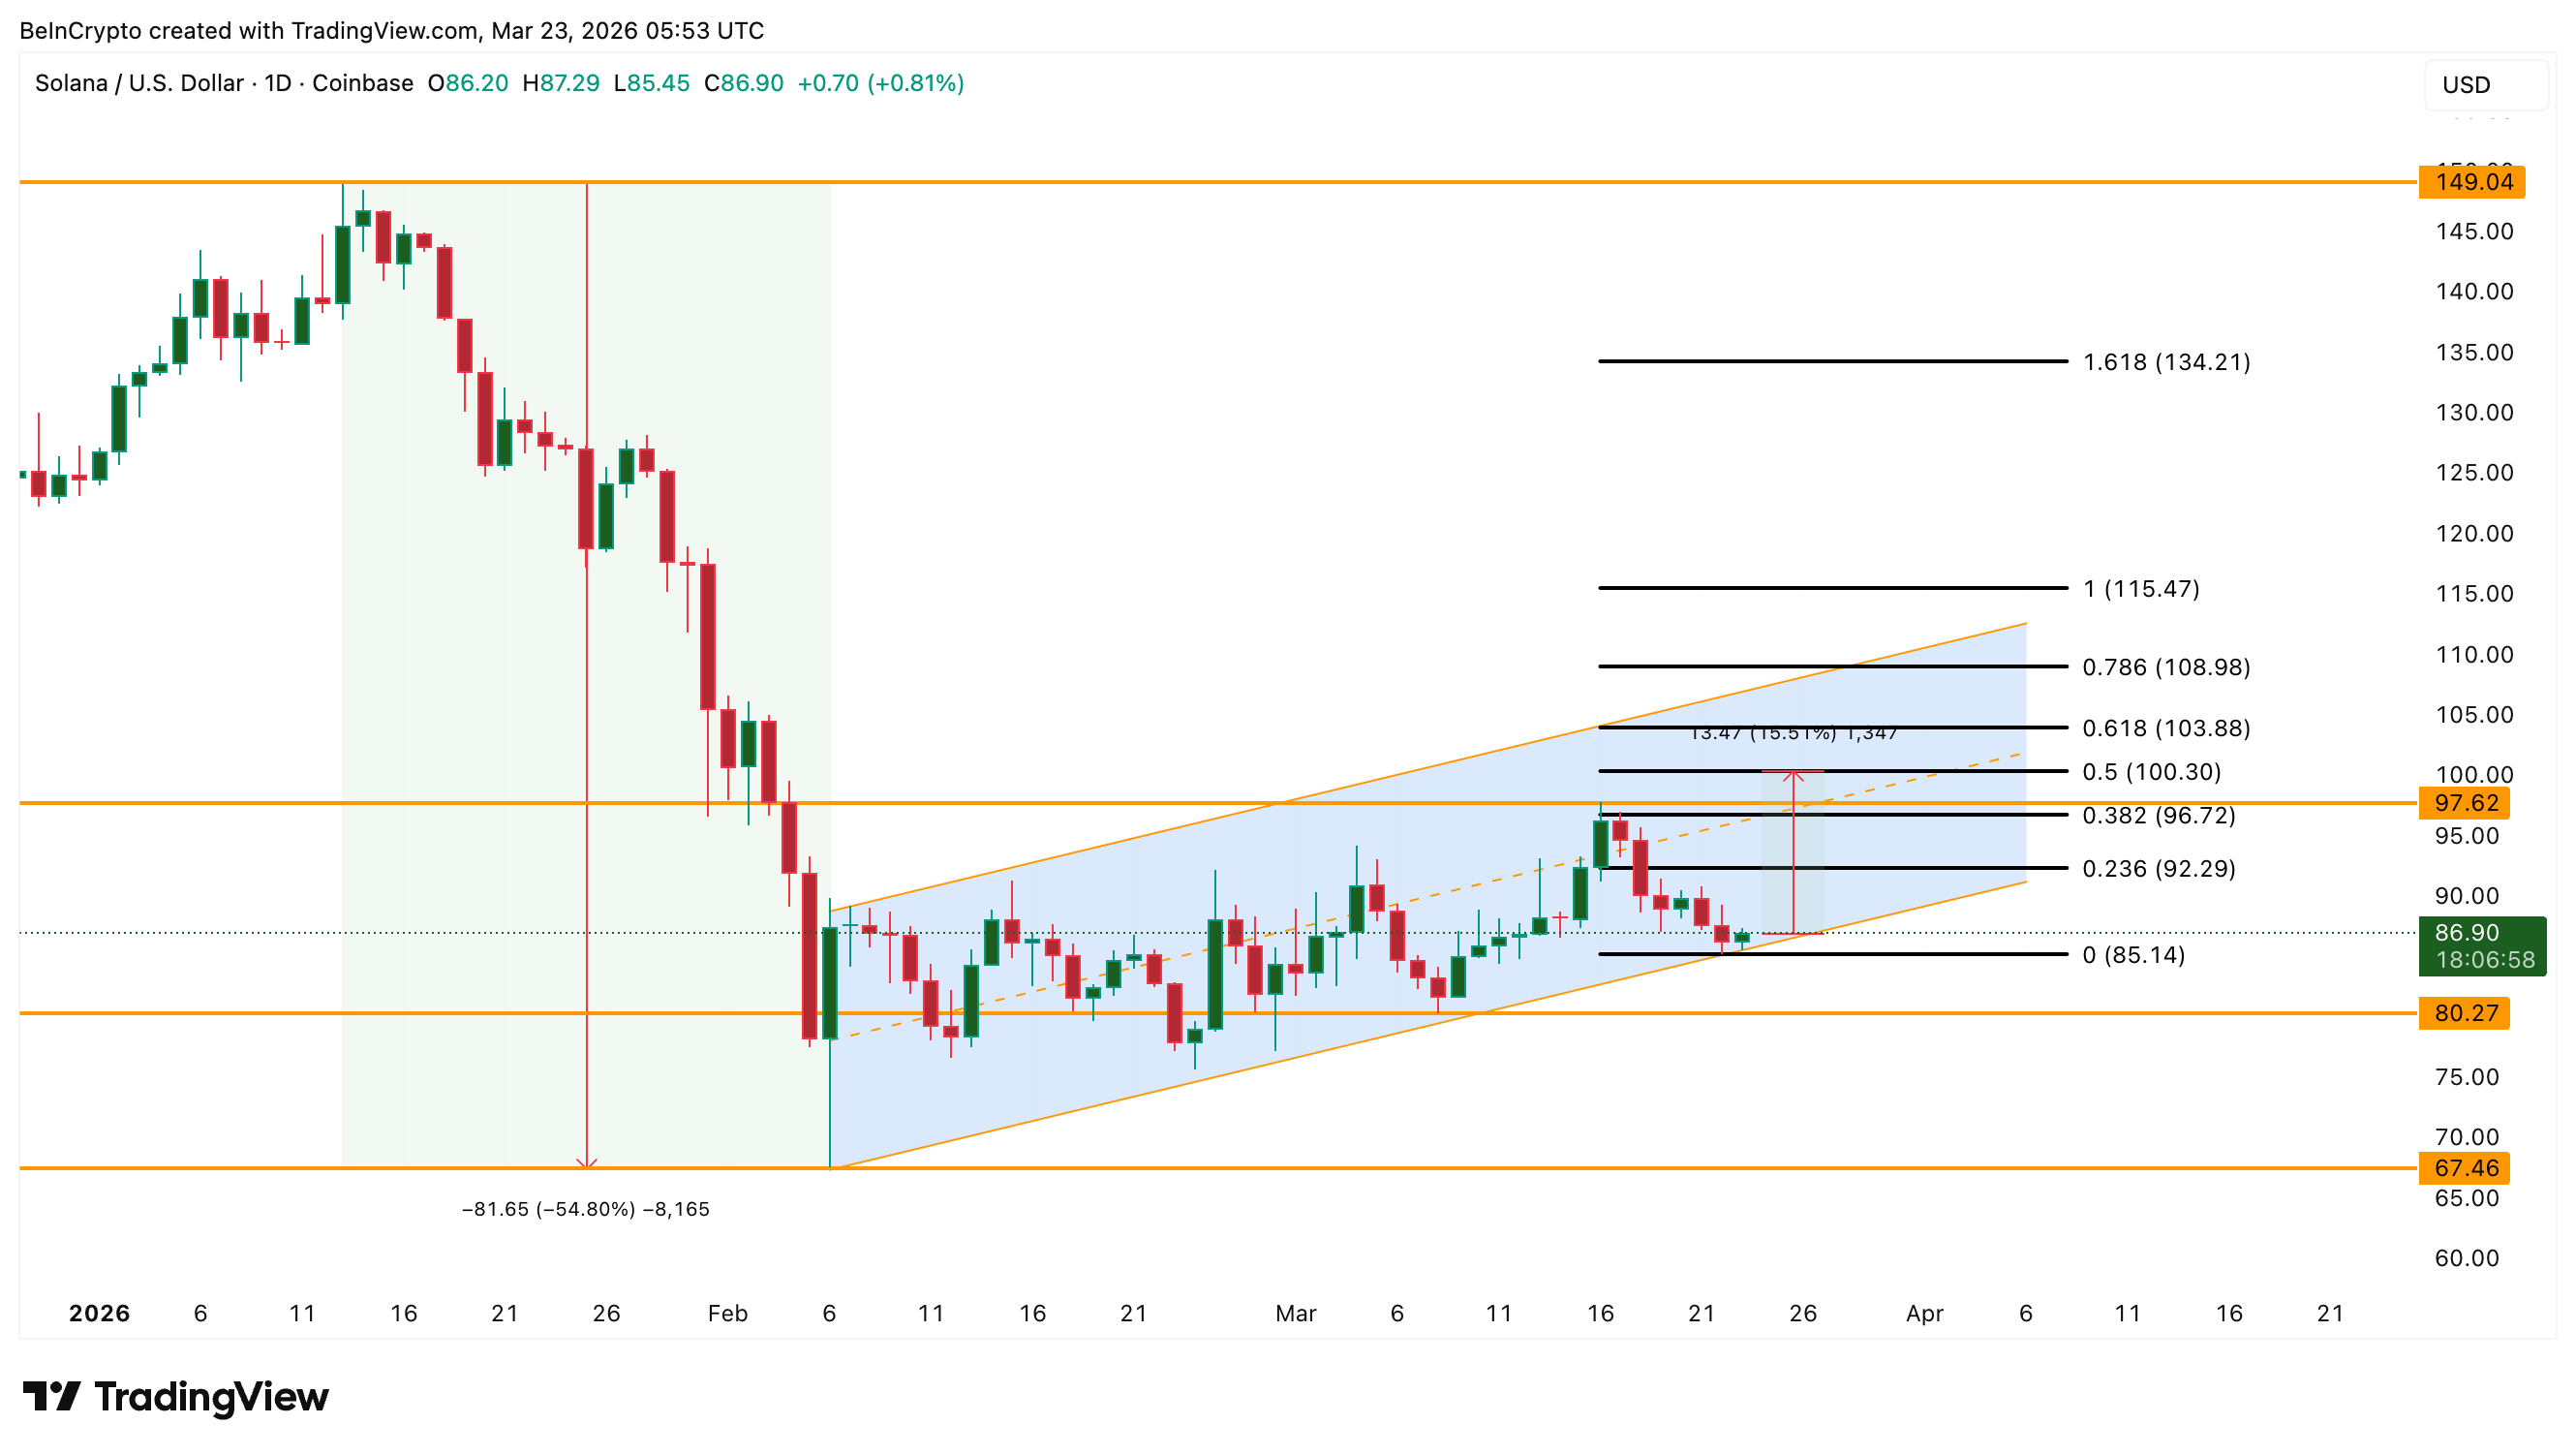 SOL Price Analysis: TradingView
The DEX volume surge favors the bulls, but the SOL price structure requires proof. SOL has gained barely 3% in over a month despite a 103% jump in on-chain trading activity. That divergence resolves in one of two directions. For now, holding above $85 separates a valid channel recovery from a breakdown that reopens the path to $67.
Recommended Articles


